A pressure-driven capillary electrophoretic system with injection valve sampling
Chao
Han
a,
Jiannan
Sun
a,
Jinhua
Liu
ab,
Heyong
Cheng
*a and
Yuanchao
Wang
a
aCollege of Material Chemistry and Chemical Engineering, Hangzhou Normal University, Hangzhou, 310036, China. E-mail: hycheng@hznu.edu.cn; Fax: +86-571-28866903; Tel: +86-571-28866903
bQianjiang College, Hangzhou Normal University, Hangzhou, 310036, China
First published on 16th October 2014
Abstract
To improve repeatability and efficiency and to simplify the operation procedure of capillary electrophoresis (CE), a pressurized CE system (p-CE) with injection valve sampling was developed. It consisted of one high-pressure pump, a six-port injection valve, a PEEK cross, a separation and back pressure capillary, an ultraviolet-visible detector and a high voltage power supply. The pressure-driven flow ranging from 4.5 nL min−1 to 0.81 μL min−1 in the separation capillary was produced by splitting to the flow from the high-pressure pumps (0.005–0.4 mL min−1). Nano-volume sample injection (<10 nL) was conducted by a micro-volume rotary injector (0.5–5 μL) with flow splitting. In the p-CE system, the new commercial capillary could be directly used without any wash, and the capillary-flush process between runs was also eliminated. In this case, the analytes were driven toward the outlet of the separation capillary by the pressurized flow, the electric field force and minute electroosmotic flow, and they were separated owing to the electrophoretic mobility. The p-CE system allows for the independent variation of the pressurized flow rate and electrical field and electrophoretic separation of good repeatability (below 3%) under high electrical fields (500–1000 V cm−1) and flow rate gradient modes. The feasibility of the p-CE system in real analysis was demonstrated by iodate quantification in iodized table salts. The separation of iodide and iodate was realized within 0.3 min, proving its high analytical speed.
1. Introduction
In response to the demand from the analytical community for sustainable development in recent years, proposals for green analytical methodologies have been related to prevention of wastes and accidents, safer solvents and auxiliaries, energy efficiency, renewability, reducing derivatives and real-time analysis.1–3 Capillary electrophoresis (CE), which is characterized by low consumption of samples and reagents, high separation efficiency, fast analytical speed and excellent biocompatibility, meets the principles of green analytical chemistry. As a result, capillary electrophoresis is gaining great popularity as a well-established separation technique for many fields such as pharmaceutical research, clinical application, environmental monitoring, and food analysis.4–6In capillary electrophoresis, the analytes (cations, anions or neutral compounds) are pulled through the capillary in the same direction by electroosmotic flow (EOF), separated according to the electrophoretic mobility (such as charge and size), and detected at the outlet end of the capillary. As the heart of CE, EOF results from the effect of the applied electrical field on the solution double layer at the interior wall of the separation capillary. Electroosmotic flow rate is dependent on the applied electrical field, the charge density of the capillary wall, and the relative permittivity and viscosity of the electrolyte. Because EOF rate could be affected by various factors (such as capillary interior wall, temperature, pH and ionic strength of background electrolyte (BGE), organic additives, and inorganic ions), precise control of EOF without any alteration is a nontrivial and unreachable task. Minor variations in EOF are responsible for many of the repeatability issues in CE;7 hence, the repeatability of CE-based methods is usually, to some extent, inferior to chromatographic methods (high performance liquid chromatography and gas chromatography), which hinders the application of CE in the routine analysis. To improve the repeatability of capillary electrophoretic methods, EOF should be replaced by another flow with high precision to drive the sample flowing toward the end terminal of the separation column. Pressure-driven apparatuses, including syringe and high-pressure pumps, can feed a fluid flow at flow rates of several picoliters to several milliliters per minute with precisions of less than 1%, which are widely used in flow injection analysis8 and liquid chromatography,9 respectively. If the pressure-driven flow at flow rates comparable to electroosmotic flow rates (several nanoliters to several microliters per minute) by syringe or high-pressure pumps could be utilized to push the analytes toward the detection window, the abovementioned aims would be achieved. Haumann et al. adopted an additional flow by a positive or negative gas-generated pressure to transport small anions toward the UV detector.10 Recently, Mai and Hauser optimized resolution and analysis times of cations and anions by capillary zone electrophoresis by superimposing a hydrodynamic flow in narrow capillaries during separation. The pressure-assisted flow varied in the range of 0.015–0.55 cm s−1, which would possibly reverse the electroosmotic flow.11–14 In order to inhibit bubble formation inside the injector, Yao et al. applied a pressurized flow along the separation column;15 nevertheless, EOF was still the major flow in the capillary. In addition, pressure-driven flows are also employed in microfluidic devices for sample injection,16 enhancement of electrophoretic resolution17 and speeding up the separation.18 To date, reports on capillary electrophoresis with pressurized flow but with EOF as the dominant flow are scarce.
Variation in sample injection before electrophoretic separation is another important factor to reduce the repeatability of CE analysis.7 Generally, a minute sample volume is introduced into the separation capillary via electromigration, pressure, siphoning or diffusion. It is well known that discrimination owing to the mobility difference of analytes is encountered during electrokinetic or electromigration injection. Furthermore, electrokinetic injection is generally not as reproducible as its hydrodynamic counterpart because variations in sample matrix may result in differences in sample resistance, and therefore quantity loaded into the separation column.7 Hydrodynamic sample injection is accomplished by applying positive pressure at the injection end of the capillary, negative pressure at the exit end of the capillary, or by siphoning action obtained by elevating the injection reservoir relative to the exit reservoir. Hydrodynamic injection is highly reproducible and nearly independent of the sample matrix. However, precise control of applied pressure or height differential of the vials is in high demand, which is arduous and troublesome. Furthermore, perfect sealing between the pressure source and the sample vial (or the waste vial) is required during pneumatic hydrodynamic injection to ensure the same sample volume at each injection.7 Owing to satisfactory repeatability of the sample injection, commercially available high-pressure rotary injectors with internal loop volumes as low as 10 nL are widely used in liquid chromatography. In other words, a rotary injector is more favorable for injecting an absolute amount of a sample into the separation column compared to electrokinetic and hydrodynamic injections. For instance, Tsuda et al. fabricated a ceramic rotary injector with a sample loop of 0.35 μL for the injection of a sample into the FEP tubing (0.2 mm i.d. × 195 mm long).19 However, no application of the homemade rotary injector in capillary electrophoresis has been reported to date, as the sample loop volume was far more than the maximum sustainable sample volume (several nanoliters to several tens of nanoliters). The same group then developed a non-conductive nanoinjector to further downscale the injection volume to several nanoliters.20 Since then, a few groups concentrated on developing a nanoinjector for CE. Hanai and Tsuruta constructed a slide-type 2 nL injector for CE.21 Yan's group reported quantitative CE analysis using commercial nano-rotary-type injectors (10 nL and 20 nL).15,22 However, the nanoinjectors are subject to blockage, in addition to relatively high cost. Although micro-volume rotary injectors widely used in conventional high performance liquid chromatography are inexpensive and possess strong robustness over nanoinjectors, their applications in CE analysis are, to the best of our knowledge, rarely reported. Apart from the abovementioned strategies, many other approaches are adopted to reduce the unrepeatability of CE, which include both hardware (highly advanced temperature control for samples, capillary and detector, precise control of voltage and signal acquisition) and software (such as data-sampling time, software for CE system, normalized peak area, regression algorithm, mobility-scaled axis for the electropherogram, and most notably internal standardization) improvements.23
In addition to its unsatisfactory precision, CE also suffers from relatively long analytical time per run. For instance, the separation time attained in standard CE instruments mostly ranges from ca. 5 to 30 min.24 Although high-speed electrophoretic separation along short capillaries or microchannels under high electrical fields (>500 V cm−1)24,25 is performed to dramatically enhance analytical throughput, the capillary-flushing process before analysis and between runs is another criticizable issue. In conventional CE, the separation column is usually flushed successively using 0.1 mol L−1 NaOH, H2O and BGE before every use and each injection to maintain an active and reproducible inner surface; however, the procedure is tedious. Furthermore, 30 min or more for capillary flushing before every use and several minutes for capillary washing between runs are normally consumed, which considerably affect the entire efficiency of CE analysis. As previously assumed, the capillary-flush process might be eliminated if EOF was replaced by another flow with high precision to drive the flow in the separation capillary. On this occasion, the entire efficiency would be undoubtedly improved, and the CE analysis operation procedure would also be simplified.
In this work, a pressurized capillary electrophoresis (p-CE) system with a micro-volume rotary injector for sample introduction was developed by the use of high-pressure pumps. The pressure-driven flow at nanoliters per minute in the separation capillary was obtained by splitting to the flow from high-pressure pumps. A nanoliter sample was injected into the separation capillary by splitting to the microliter sample. The principle of pressurized capillary electrophoresis was discussed in detail, and the estimation to the sample injection by the micro-volume rotary injector was conducted. Electrophoretic separation on high electrical fields (>500 V cm−1) and under the gradient mode was performed to prove the extended applications of the proposed p-CE system. Finally, the feasibility of the p-CE system in real analysis was demonstrated by speciation analysis of iodine in edible table salts.
2. Materials and methods
2.1 Chemicals and reagents
All reagents used were of either analytical or chromatographic grade. Benzylamine, thiourea, N-phenylthiourea, benzoic acid and potassium biphthalate were purchased from Aladdin Chemistry (Shanghai, China) to individually prepare their standard solutions (10 mM) with ultrapure water. The standard stock solutions of 1000 mg L−1 I− and IO3− were prepared from potassium iodide and potassium iodate (Sinopharm Chemical Reagent Co., Ltd., Shanghai, China), respectively, in ultrapure water and used for iodine speciation analysis in edible table salts. Standard solutions were prepared by the successive dilution of the abovementioned stock solutions in the 0.2% (m/v) NaCl solution. Sodium tetraborate (Na2B4O7·10H2O) and disodium hydrogen phosphate (Na2HPO4·12H2O) were purchased from Sinopharm Chemical Reagent (Shanghai, China) for the preparation of borate and phosphate buffers, respectively. Ethylene dimethacrylate (EDMA) and glycidyl methacrylate (GMA) were obtained from Sigma-Aldrich (St. Louis, MO, USA) and azobisisobutyronitrile (AIBN) was purchased from Fourth Shanghai Reagent Plant (Shanghai, China). The polymerization mixture was prepared according to the literature,26i.e. the monomer (0.96 g EDMA, 1.421 g GMA), porogenic solvent (50/50 wt% methanol–hexane: 3.60 g) and photoinitiator (24 mg AIBN) were mixed and purged with nitrogen for 10 min before use. All solutions were filtered through a membrane of 0.22 μm pore size before analysis. Ultrapure water with a resistivity of 18.2 MΩ cm, obtained from a Milli-Q Plus water purification system (Millipore, Bedford, MA, USA), was used throughout the experiment.2.2 Instrumentation
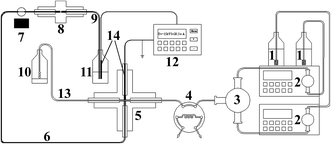
The pressurized capillary electrophoretic separation (p-CE) was carried out on a Unimicro TriSepTM-2100 pressurized capillary electrochromatography unit (p-CEC) (Unimicro (Shanghai) Technologies Co., Ltd., Shanghai, China), which is shown in Fig. 1. The p-CEC system consisted of two micro-volume double plunger pumps (2) with a 0.0001–9.9999 mL min−1 flow rate range, a mixer with two inlets and one outlet (3), an electrical injection six-port valve with a 2 μL sample loop (4), a PEEK cross (5), an electrochromatographic capillary, a 190–700 nm variable wavelength ultraviolet-visible detector (7) and a high voltage power supply with an output voltage range from 0 to ±30 kV and an output current range of 0–100 μA (12). The electrochromatographic capillary was replaced by a hollow fused silica capillary for electrophoretic separation (6). In particular, a back-pressure capillary was placed after the separation capillary, and their connection was realized via a PEEK MicroFingertight Union of 5 nL internal volume for 360 μm o.d. tubing with fittings included (Part no. P-772) from Upchurch Scientific (Oak Harbor, WA, USA) (8). The two inlets of the mixer (3) were for the individual outlets of the micro-volume double plunger pumps (2). The outlet of the mixer (3) was connected to Port 5 of the six-port valve (4). The two horizontal openings of the PEEK cross (5) were connected to Port 6 of the six-port valve (4) and the splitting capillary (13). The splitting capillary (13) was a 60 cm fused silica capillary (50 μm i.d. and 365 μm i.d., Yongnian Ruifeng Optical Fabric Factory, Hebei, China). One vertical port of the PEEK cross (5) was connected to the separation capillary (30–60 cm long, 50 or 75 μm i.d. and 365 μm i.d., Yongnian Ruifeng Optical Fabric Factory, Hebei, China) (6) via a 0.38 mm i.d. and 1.59 mm o.d. PEEK tubing. The remaining vertical port of the PEEK cross (5) was for the platinum electrode connected to the high voltage power supply. The platinum electrode was a 3 cm long platinum wire with a diameter of 350 μm. The 350 μm platinum wire was injected into a 3 cm PEEK tubing (0.38 mm i.d. and 1.59 mm o.d.) and connected to the PEEK cross (5) via PEEK fitting. The other terminal of the Pt wire was connected to the ground electrode of the high voltage power supply. A 5 mm open window at the separation capillary (6) for UV detection was fabricated by removing the polyimide coating with a scalpel and further cleaning with methanol.27 The back-pressure capillary (9) was a 5 cm fused silica capillary with a Teflon® AF Fluoro-polymer external coating (75 μm i.d. and 363 μm o.d., Polymicro Technology, Phoenix, AZ, USA), in which a monolithic plug was created. The back-pressure capillary (9) and the output electrode of the high voltage power supply (12) were both inserted into the electrolyte waste reservoir (11).2.3 Fabrication of the backpressure capillary
A 2 cm macroporous polymer plug was prepared in the back-pressure capillary using a photo-initiated, free-radical polymerization technique.28 Prior to the fabrication of the monolithic polymer column, the capillary was washed with acetone and water, filled with 0.2 mol L−1 NaOH solution for 30 min, washed with water, filled with 0.2 mol L−1 HCl solution for 30 min, washed again with water and acetone, and then dried in a vacuum oven at a temperature of 120 °C for 2 h. They were then filled with 30% of 3-(trimethoxysilyl)propyl methacrylate in acetone and allowed to react at room temperature under darkness for 24 h.28 The vinylized capillary was then washed with acetone and dried using a stream of nitrogen to enable covalent attachment of the monolith. Then, the capillary was completely filled with the polymerization mixture, and both ends of the capillary were sealed with silicon septa. The capillary was then covered with a mask that had a 2 cm open window, allowing the middle section of the capillary to be exposed to UV light. The polymerization was initiated by exposing the masked capillary to UV light (7 mW cm−2) at a distance of 9.0 cm for 35 min. After the completion of the reaction, methanol was passed through the monolithic column to remove porogenic solvents and other unreacted soluble compounds by one micro-volume double plunger pump (2) at a flow rate of 5 μL min−1. The washing process was continued for 1 h, and ultrapure water was then passed for 1 h. The back pressure of the back-pressure capillary was determined to be 35 bar on pumping methanol at a flow rate of 1 μL min−1.2.4 Experimental process by the p-CE system
The commercially fused silica capillary was directly cut to a specific length and a detection window at the appreciate position was fabricated as described in the Instrumentation section. Then, the components of the p-CE system were assembled as Fig. 1, and one high-pressure pump commenced to feed the electrolyte (5 mM phosphate buffer at pH 6.0 unless otherwise noted) into the capillary. The entire procedure includes three steps: electrophoretic conditioning, sampling and separation. In the first step, a −10 kV output of the high-voltage power supply was applied along the separation capillary and the high-pressure pump ran for flow delivery at 100 μL min−1. Moreover, the intensity of UV absorbance with time was monitored to normalize the baseline. Once a stable and straight baseline was obtained, the high-voltage power supply was switched off, and the flow rate of the pump was changed to desirable values (i.e., 80 μL min−1). In the second step, a 5 μL volume of standard or sample was manually flown through the sample loop of the injection valve (at the load position) by a 10 μL flat-needle syringe. Next, the injection valve was changed to the inject position, and the sample in the loop was injected into the separation capillary by the pressure-driven flow. At the same time, data acquisition was automatically activated to record the electropherogram. In the next 5 s, the high-voltage power supply was switched on (negative potentials were applied at the exit terminal of the separation capillary in the waste reservoir unless otherwise noted), and the separation step was started. After a set collection time, the signal acquisition was stopped and the high-voltage power supply was switched off again. Another run could be performed simply by repeating the sampling and separation steps.Warning: during the entire experiment, any contact to the high-voltage electrode is forbidden when applying potentials along the separation capillary.
2.5 Pretreatment of edible table salt
Three table salt samples were randomly purchased from one supermarket in Hangzhou. Then, three aliquots of each table salt sample (0.2 g) were then weighed and dissolved in a 100 mL volume of 10 mM borate solution (pH 9.2). The resulting sample solution was then filtered through a 0.45 μm membrane for further analysis. The spike recovery test was carried out by spiking a 0.2 g sample with the mixture standard solution (0.2 mg L−1) before dissolution with borate solution.3. Results and discussion
3.1 Considerations on the pressurized capillary electrophoretic system
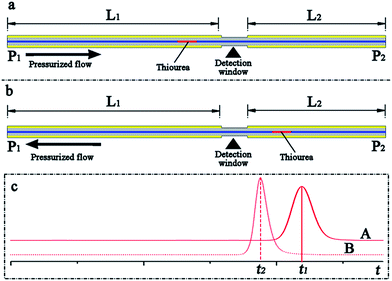
The main objective of this work was to develop a pressurized capillary electrophoresis system to improve the repeatability of CE based analysis and simplify the CE experimental process. The commercially available fused silica capillary was cut to a specific length and then directly utilized as the separation column, eliminating the capillary-flush process. Because the interior wall of the capillary was not activated by basic solutions such as NaOH and KOH, only a small fraction of silanol (Si–OH) groups in the interior surface was ionized into negatively charged silanolate (Si–O–) groups; thus, the electroosmotic flow rate in the capillary may be minute. To make neutral compounds and anions migrate toward the exit terminal of the capillary, a pressure-driven flow was fed through the capillary from the source to the destination. The pressure-driven flow, on the one hand, should exceed the electrophoretic flow, confirming that anions were carried along with the BGE solution toward the cathode. On the other hand, the pressure-driven flow rate should also be adjusted in the same range as the common electroosmotic flow in the conventional CE analysis, which was typically sub-microliter to microliter per minute and drove the analytes through the separation capillary toward the exit. Therefore, the pressure-driven flow rate should be set in the scale of microliter per minute in p-CE. Otherwise, the analytes were driven out of the separation capillary rapidly before their separation, and the electrophoretic separation may fail. Although nano-flow and micro-flow pumps were commercially available and could be employed to directly produce the suitable pressurized flow, their costs were much more than those of conventional pumps. Therefore, a conventional high-pressure gradient binary pump was selected. In this case, flow splitting was performed to obtain the required pressurized flow by the use of a conventional high-pressure pump (as shown in Fig. 1).A simple experiment was performed to evaluate the pressurized and electroosmotic flow velocities in our system in the following manner. As shown in Fig. 2, a capillary length of 50 cm (50 μm i.d. and 365 μm i.d.) served as the separation column, whereas 10 mg L−1 thiourea was used as the sample, and the UV detection window was fabricated 30 cm away from one capillary terminal (point P1). The separation capillary were divided into two fractions (L1 = 30 cm and L2 = 20 cm) by the detection window. First, the terminal P1 was chosen as the inlet, and the effective length was L1 = 30 cm (Fig. 2a). Once the six-port rotary valve was changed from the load position to the inject position after the loading of thiourea into the sample loop, the UV intensity was simultaneously recorded. Next, the terminal P2 was chosen as the inlet, and the effective length was L2 = 20 cm (Fig. 2b). After repeating the abovementioned sample injection and UV detection, the migration times (t1 and t2) were obtained from elution profiles A and B (Fig. 2c). The pressurized flow velocity (νp) under a certain flow rate of the high-pressure pump was calculated by dividing the difference in the length (ΔL = L1 − L2) by the difference between the migration times (Δt = t1 − t2). Pressurized flow rates under various flow rates of the high-pressure pump could be determined by replicating the abovementioned procedure, which is listed in Table 1. If the flow rate of the high-pressure pump was fixed at 100 μL min−1 and a certain electrical field was applied along the separation capillary during the UV detection, the total flow velocity (νa) could be determined by a similar method. The electroosmotic flow velocity (νo) was obtained by subtracting the constant pressurized flow velocity from the total flow velocity (νo = νa − νp), which are provided in Table 2.
| Flow rate of high pressure pump | Linear flow rate (RSD%) | Volumetric flow rate | Split ratio (RSD%) | Flow rate of high pressure pump | Linear flow rate (RSD%) | Volumetric flow rate | Split ratio |
|---|---|---|---|---|---|---|---|
| a Flow rate of high pressure pump linear and volumetric flow rates are described in μL min−1, mm s−1 and μL min−1, respectively. | |||||||
| 5 | 0.038 ± 0.003 (8.89) | 0.0045 ± 0.0003 | 1517 ± 137 (9.03) | 200 | 3.14 ± 0.06 (1.86) | 0.370 ± 0.005 | 541 ± 7 (1.29) |
| 10 | 0.065 ± 0.004 (6.15) | 0.0077 ± 0.0005 | 1307 ± 85 (6.50) | 220 | 3.47 ± 0.06 (1.73) | 0.409 ± 0.007 | 538 ± 9 (1.67) |
| 20 | 0.21 ± 0.01 (4.76) | 0.025 ± 0.001 | 809 ± 32 (3.96) | 240 | 3.86 ± 0.07 (1.81) | 0.455 ± 0.007 | 528 ± 8 (1.52) |
| 40 | 0.64 ± 0.01 (1.56) | 0.075 ± 0.002 | 531 ± 14 (2.64) | 260 | 4.32 ± 0.08 (1.80) | 0.509 ± 0.008 | 511 ± 8 (1.57) |
| 60 | 0.91 ± 0.02 (1.83) | 0.107 ± 0.002 | 560 ± 10 (1.83) | 280 | 4.78 ± 0.08 (1.67) | 0.563 ± 0.009 | 497 ± 8 (1.61) |
| 80 | 1.10 ± 0.02 (1.82) | 0.130 ± 0.002 | 618 ± 9 (1.46) | 300 | 5.15 ± 0.08 (1.55) | 0.606 ± 0.009 | 495 ± 7 (1.41) |
| 100 | 1.32 ± 0.02 (1.52) | 0.155 ± 0.002 | 643 ± 8 (1.20) | 320 | 5.64 ± 0.09 (1.56) | 0.664 ± 0.011 | 482 ± 8 (1.66) |
| 120 | 1.81 ± 0.03 (1.66) | 0.213 ± 0.004 | 563 ± 11 (1.95) | 340 | 5.98 ± 0.08 (1.34) | 0.704 ± 0.009 | 483 ± 6 (1.21) |
| 140 | 2.05 ± 0.04 (1.91) | 0.241 ± 0.005 | 580 ± 12 (2.07) | 360 | 6.29 ± 0.09 (1.42) | 0.741 ± 0.011 | 486 ± 7 (1.44) |
| 160 | 2.39 ± 0.05 (1.89) | 0.281 ± 0.006 | 569 ± 12 (2.12) | 380 | 6.44 ± 0.10 (1.49) | 0.758 ± 0.012 | 501 ± 8 (1.60) |
| 180 | 2.80 ± 0.04 (1.43) | 0.330 ± 0.005 | 546 ± 8 (1.47) | 400 | 6.88 ± 0.11 (1.51) | 0.810 ± 0.013 | 494 ± 8 (1.62) |
| Electric field | Linear flow rate (RSD%) | Volumetric flow rate | Electric field | Linear flow rate (RSD%) | Volumetric flow rate |
|---|---|---|---|---|---|
| a Linear and volumetric flow rates and electric field are described in mm s−1, μL min−1 and kV cm−1, respectively. | |||||
| 0.02 | 0.025 ± 0.005 (20.0) | 0.0029 ± 0.0006 | 0.22 | 0.129 ± 0.006 (3.85) | 0.0152 ± 0.0007 |
| 0.04 | 0.041 ± 0.004 (9.76) | 0.0048 ± 0.0005 | 0.24 | 0.136 ± 0.005 (3.57) | 0.0160 ± 0.0006 |
| 0.06 | 0.052 ± 0.004 (7.69) | 0.0061 ± 0.0005 | 0.26 | 0.149 ± 0.006 (3.33) | 0.0175 ± 0.0007 |
| 0.08 | 0.056 ± 0.005 (8.93) | 0.0066 ± 0.0006 | 0.28 | 0.156 ± 0.006 (3.75) | 0.0184 ± 0.0007 |
| 0.10 | 0.063 ± 0.003 (4.76) | 0.0074 ± 0.0004 | 0.30 | 0.174 ± 0.007 (3.53) | 0.0205 ± 0.0008 |
| 0.12 | 0.075 ± 0.004 (5.33) | 0.0088 ± 0.0005 | 0.32 | 0.183 ± 0.008 (3.28) | 0.0215 ± 0.0009 |
| 0.14 | 0.082 ± 0.004 (4.88) | 0.0097 ± 0.0005 | 0.34 | 0.191 ± 0.008 (3.68) | 0.0225 ± 0.0009 |
| 0.16 | 0.091 ± 0.003 (3.32) | 0.0107 ± 0.0004 | 0.36 | 0.196 ± 0.007 (3.47) | 0.0231 ± 0.0008 |
| 0.18 | 0.106 ± 0.005 (4.55) | 0.0125 ± 0.0006 | 0.38 | 0.204 ± 0.009 (3.06) | 0.0240 ± 0.0011 |
| 0.20 | 0.114 ± 0.004 (3.64) | 0.0134 ± 0.0005 | 0.40 | 0.208 ± 0.008 (3.35) | 0.0245 ± 0.0009 |
Two conclusions could be made from Table 1. First, the pressurized flow rate linearly ascended with the flow rate of the high-pressure pump (R = 0.9955), whereas the split ratio fluctuated around 500 with the flow rate of the high-pressure pump above 40 μL min−1. As the high-pressure pump offered better precisions of flow rate at higher flow rates, it was operated at sub-mL min−1 flow rates for obtaining high-precision nano-flow in the separation channel. The stabilities of the pressure-driven flow and splitting ratio were determined to vary in the ranges of 1.34–8.89% and 1.20–9.03%, respectively. It is noteworthy that the repeatabilities were all superior to 2.12% at high pressurized flow rates (>60 μL min−1), demonstrating good stability of the pressurized flow and splitting ratio. Hence, large split ratios ensured that the pressurized flow altered in the nL min−1 level when the pump was operated in the sub mL min−1 level. The large split ratios were ascribed from the high hydrodynamic resistance of the monolithic plug in the back-pressure capillary. The split ratio could also be conveniently changed by increasing or decreasing the length and inner diameter of the splitting capillary. Second, the pressurized flow velocities (νp) in the capillary varied in the ranges of 0.038–6.88 mm s−1, which were in the same scale with the conventional EOF velocity. For a new capillary without any treatment, the EOF velocities increased from 0.025 mm s−1 to 0.21 mm s−1 under electrical fields in the range of 0.02–0.40 kV cm−1. Once the flow rate of the high-pressure pump exceeded 40 μL min−1, the pressurized flow would be far larger than the EOF, which indicated that the former is capable of replacing EOF to drive the analytes toward the exit.
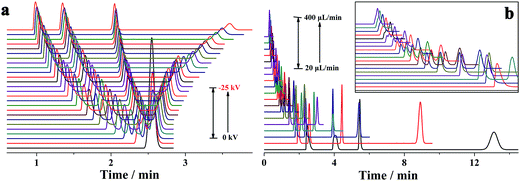
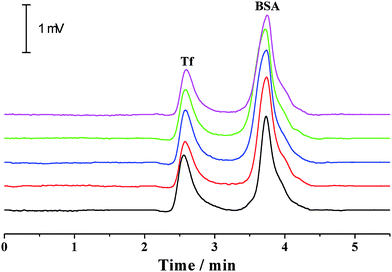
For a given analyte, its migration velocity (ν) in the quartz capillary is dependent upon the pressurized (νp), electrophoretic (νe) and electroosmotic (νo) flow velocities, which can be defined as follows: ν = νp + νe + νo. The pressurized and electroosmotic flow velocities are the same for all analytes, regardless of charge and size. The electrophoretic migration velocity is different for various analytes, which relies on the electrical field and the charge. Negatively charged analytes are attracted to the positively charged anode, counter to the EOF, whereas positively charged analytes are attracted to the cathode, in agreement with the EOF. For all neutral analytes, the electrophoretic migration velocity is equal to zero. Both positively and negatively charged compounds could be electrophoretically separated owing to their differences in electrophoretic mobility. The migration time is in the order of small multiply charged cations, large single-charged cations, neutral analytes, large single charged anions and small multiply charged anions, which is in accordance with that by the conventional capillary electrophoresis. Moreover, this was confirmed by the separation of benzylamine, thiourea, benzoic acid and biphthalate under various electric fields and pressurized flows (Fig. 3). Because the analytes were only separated by electrical force, the separation was improved with the electrical field (Fig. 3a). The migration times of all analytes in the separation capillary were shortened by the pressurized flow of higher rates, and hence the separation was impaired with the pressurized flow rate (Fig. 3b). However, the migration velocity of a given analyte in the PTFE or alkyl-silanized capillary is equal to νp plus νe (ν = νp + νo) because EOF velocity was determined to be nearly zero (<0.002 mm s−1). We also performed the electrophoretic separation of benzylamine, thiourea, benzoic acid and biphthalate in the PTFE and alkyl-silanized capillaries. The experimental results indicated a moderate delay in the migration time (prolonged by 1.3–15.2% in comparison with those performed in the untreated quartz capillary), which proved the abovementioned description. Proteins are routinely analyzed by the scientific community using conventional CE. The suitability of the p-CE system in the separation of proteins was also investigated by using transferrin (Tf) and bovine serum albumin (BSA). Fig. 4 shows five repeated separations of Tf and BSA using an unmodified capillary without flushing. The results indicated the suitability of the p-CE system for the separation of proteins without flushing. Because sample injection was accomplished by an injection valve and the separation was performed in the untreated capillary by the electrophoretic force in combination with a major pressurized flow and a minor EOF, irreversible protein adsorption to the surface of the unmodified capillary resulted in a negligible effect, offering satisfactory repeatability for protein separation. It was worth noting that the proposed p-CE system may offer an additional advantage in the simultaneous separation of negatively and positively charged proteins in one run because the cationic and anionic proteins could all be driven toward the waste by the pressure-driven flow.
In conventional CE, the buffer solution flow velocity (νB) is equal to the electroosmotic flow velocity (νo). Minor variations in EOF are responsible for many of the repeatability issues in CE.7 Different from conventional capillary electrophoresis, the buffer solution flow velocity (νB) in our p-CE system is the sum of the pressurized (νp) and electroosmotic (νo) flow velocities, i.e., νB = νp + νo. Therefore, the standard deviation of the buffer solution flow velocity (sB) could be determined by the following equation:
| sB2 = sp2 + so2 | (1) |
| CνB = sBνB−1 = (sp2 + so2)0.5νB−1 | (2) |
It was shown from Tables 1 and 2 that so2 is much lower than sp2 and νp is much larger than νo because the interior wall of the separation capillary was not activated in the p-CE system. Therefore, CνB is approximately equal to sp ×νB−1, i.e., CνB ≈ spνB−1, which indicates the repeatability improvement in the p-CE system would even work for separations with an unacceptably high RSD in the conventional system.
It is well known that the electrokinetic force generates EOF with a flat flow velocity profile, whereas the pressure yields a laminar flow with a parabolic flow velocity profile. The flat flow velocity profile is beneficial because it does not contribute to the dispersion of the sample zone. In contrast, the laminar flow results in peak broadening. Providing that the pressurized flow served as the dominant drive in the proposed pressurized capillary electrophoresis, the influence of the pressurized flow rate on the separation efficiency (as the theoretical plate number) was investigated. The experimental results (Fig. 5) indicated that the theoretical plate numbers increased with increasing the pressurized flow rate and reached maximum values at 20 μL min−1. Further increasing the flow rate induced the decrease of the theoretical plate numbers. The varying degrees of the theoretical plate numbers were in the order of anions > neutrals > cations. By increasing the pressurized flow rate, the time for transporting the sample zone across the detection window was shortened, which resulted in reduced band broadening due to molecular diffusion and improved the separation efficiency. However, high flow-rate pressurized flow dramatically reduced the retaining time in the separation time, which to a large extent hindered the electrophoretic separation of the analytes. More importantly, the parabolic flow velocity profile of the pressure-driven flow at higher flow rates (>20 μL min−1) worsened band broadening, leading to a drop in the theoretical plate number as the major factor. As a result, the separation efficiency became worse at high pressurized flow rates. As can be seen from Fig. 3b, the resolutions between neighboring peaks were impaired upon increasing the pressurized flow. Once the pressurized flow rate exceeded 200 μL min−1, peak overlapping was observed. Furthermore, peak capacity might also decrease with the pressurized flow. It is noteworthy that the proposed p-CE system allows for independent variation of the pressurized flow rate and electrical field with respect to the analysis speed and separation efficiency. High pressurized flow rates would be selected to achieve rapid analysis with large electrophoretic mobility difference, whereas low pressurized flow rates were desirable for better separation efficiency to the analytes with minute electrophoretic mobility difference. If the mobilities of the analytes were variable over a wide range, a gradient-pressurized flow could be employed to obtain rapid baseline separation, which will be discussed in the following section. Conversely, the analysis speed and separation efficiency were both affected by the electrical field in conventional CE. High electrical fields are favorable to the analysis speed but adverse to separation efficiency, whereas low electrical fields retard the analysis speed but improve separation efficiency. As a result, the electric field is a compromise between analysis speed and separation resolution.
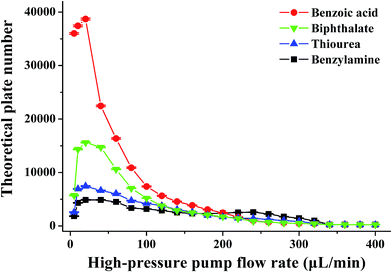 | ||
| Fig. 5 The effect of the pressurized flow rate on the theoretical plate number. The conditions were the same as those in Fig. 3. | ||
In our experiment, we also found that the positions in which the charged and ground anodes were placed influenced the electrophoretic separation. When the positively or negatively charged anode was connected to the PEEK cross with the ground anode placed in the electrolyte waste reservoir, the electrophoretic separation may be affected by micro-bubbles owing to electrical discharge or even failure. In this example, electrospray may be formed at the exit of the splitting capillary as long as it did not dip into the liquid, which would result in the increase of the split ratio. In addition, the operation of the mixer and the six-port rotary injector made of stainless steel may lead to a high risk of electrical shock. However, if the positively or negatively charged anode was placed in the electrolyte waste reservoir with the ground anode connected to the PEEK cross, the abovementioned problems did not occur, as the electrolyte waste reservoir was a sealed bottle to inhibit electrical discharge at the capillary tip. For safety reasons and experimental requirements, the inlet of the separation capillary was grounded.
3.2 Estimation on sample injection by a six-port rotary injector
It is well known that rotary injectors are characterized by satisfactory repeatability of sample injection and suitability for automatic sampling. As early as 1987, Tsuda et al. had a sense of accurate sample injection for capillary zone electrophoresis by the use of a homemade ceramic rotary injector.9 However, the sampled volume was much more than the sustainable amount in conventional CE, which inhibited its application in CE. Although they fabricated a non-conductive nanoinjector for CE, its application potential was scarce.10 With the development of nanoflow liquid chromatography and mechanical manufacturing, the internal loop volumes of commercial rotary injectors are further downscaled to 10 nL. In our preliminary experiment, a 50 nL manual nano-injection valve of stainless steel was utilized for the sample injection in pressurized capillary electrophoresis. The nano-injection valve was installed before the inlet of the separation capillary but after the PEEK cross. The effective electrophoresis could only be achieved on applying low separation voltages (less than −8 kV). The reason could be ascribed from the presence of bubbles under high voltages due to the metal surface of the nano-injection valve. In this case, low pressurized flow rates were sustainable for the sake of baseline separation, which may lead to long analytical time. However, the problem could be eliminated by using specific nano-injection valves made of nonconductive materials such as PEEK, fine ceramic and PTFE, and the PEEK-type nano-injection valve is also commercially available. The only shortcoming lies in the higher cost of the nano-injection valves compared with micro-volume rotary injectors. Nevertheless, the great advantage of the former is 100% sample efficiency.As the PEEK-type nano-injection valve is not available to us, a micro-volume six-port rotary injector for high performance liquid chromatography is an alternative selection. Considering the excessive injected volume of the micro-volume six-port rotary injector, sample splitting must be performed. Therefore, just as shown in Fig. 1, the injector was placed in front of the PEEK cross. The actual sample volume introduced into the separation could be obtained by dividing the sample loop volume by the split ratio. The actual sample volume (1.3–4.1 nL) was altered with the flow rate of the high-pressure pump. To demonstrate the repeatability of this sample injection method, 10 replicate injections of two samples (0.1 mM, thiourea and N-phenylthiourea) by the six-port rotary injector with various sample loops (0.5–10 μL) were performed at a pump flow rate of 100 μL min−1. In comparison, 10 replicate injections of the same samples by the electrokinetic injection method (10 kV injection voltage and 10 s injection time) and negative pressure sampling method (−100 mbar pressure and 10 s injection time) were also carried out. The RSDs from the peak height and area are provided in Table 3. Precisions of less than 2% (n = 10) were obtained for all sampling volumes by the injector, which were slightly better than those by the negative pressure sampling method (1.26–2.01%). The precision of sample injection by the rotary injector was significantly superior to that by the electrokinetic injection method. The result indicated good repeatability of the sample injection by the rotary injector. Injection valve sampling may exhibit extreme advantages in the precise injection of viscous and matrix-complex samples (i.e., saline waters), in which high RSDs of sample volumes were encountered by hydrodynamic and electrokinetic injection. The only blemish of the valve sampling method by microliter injection valves was the low sample efficiency (approximately 0.2%).
| Sampling method | Precision (RSD%, n = 10) | ||||
|---|---|---|---|---|---|
| By peak height | By peak area | ||||
| Thiourea | N-Phenyl-thiourea | Thiourea | N-Phenyl-thiourea | ||
| Six-port injection valve | 0.5 μL | 1.26 | 1.12 | 1.43 | 1.40 |
| 1 μL | 1.08 | 0.94 | 1.26 | 1.28 | |
| 2 μL | 0.89 | 0.81 | 1.10 | 1.04 | |
| 5 μL | 0.95 | 0.87 | 0.98 | 1.02 | |
| 10 μL | 0.84 | 0.72 | 0.93 | 0.95 | |
| Electrokinetic injection | 2.82 | 2.66 | 3.04 | 3.23 | |
| Negative pressure sampling | 1.33 | 1.26 | 1.45 | 2.01 | |
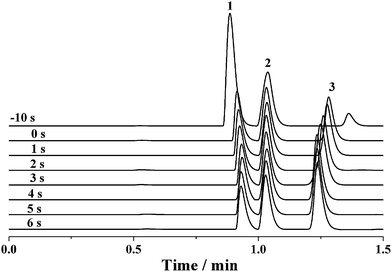
Because the sample loop of the rotary injector is generally filled with the sample by a syringe, it seems that the discrimination effect would be dissolved for the sample injection using rotary injectors similar to the negative pressure sampling method. However, the discrimination phenomenon may still occur if a potential was applied along the separation capillary before complete sample injection into the capillary by the pressure-driven flow. Fig. 6 shows the electropherograms of the mixture solution of 0.1 mM benzylamine, thiourea and benzoic acid when a −12 kV voltage was applied after various intervals from the switch of the rotary injector. When the separation voltage was applied before the sample injection, the intensity of benzylamine was significantly enhanced, whereas that of benzoic acid was dramatically degraded with the intensity of thiourea nearly kept constant. As the delay time between applying the separation voltage and switching the injector was increased to 4 s, the intensity of benzylamine was gradually diminished, accompanied by the increase of the benzoic acid intensity. At the same time, the intensity of thiourea was nearly invariable. By further prolonging the time interval to 6 s, the intensities of all analytes were levelled off. The abovementioned result could be attributed to the interaction between the electrokinetic force and the charged chemicals. The potential was attractive to the positively charged benzylamine but repulsive to the negatively charged benzoic acid. Hence, more benzylamine was pulled into the separation capillary, whereas more benzoic acid was excluded from the separation capillary when the sample flowed across the PEEK cross, which subsequently induced an increased intensity of benzylamine but decreased intensity of benzoic acid. Furthermore, the discrimination effect may be aggravated upon increasing the potential. However, once the delay time exceeded 4 s, the sample had flowed past the PEEK cross and was introduced into the separation capillary. It was reasonable that the intensities were barely changed. Due to a lack of effect of the electrokinetic force on the neutral thiourea, its intensity was hardly altered. To achieve high-precision sample injection without discrimination, the high voltage was initiated in 5 s after the sample injection process was started.
3.3 Electrophoretic separation under high electric fields
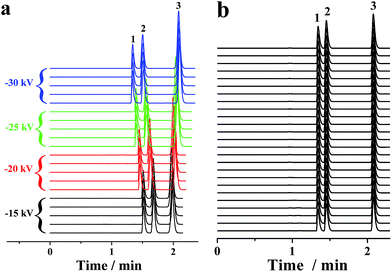
In conventional CE analysis, the electrical field is generally lower than 500 V cm−1 with constraints of the Joule heating effect. Hence, the separation of multiple compounds with close mobilities was arduous work. Certain derivatization of these analytes to expand their mobility diversity is a probable solution. However, the derivatization was a challenging, tiresome and time-consuming task. Another alterative strategy is to perform the electrophoretic separation under electrical fields of more than 500 V cm−1. On this occasion, one or more actions must be taken to limit the Joule heating, which can be reduced by either lowering the ionic strength or decreasing buffer mobility. Because EOF was far less than the pressurized flow in the proposed p-CE system, lowering the ionic strength was adopted. Accordingly, 2 mM phosphate buffer was used as the electrolyte. The electropherograms of the mixture solution of 0.1 mM benzylamine, 0.2 mM thiourea and 0.2 mM benzoic acid on applying a variety of high voltages (from −15 to −30 kV) along the 30 cm capillary were demonstrated by Fig. 7a. The RSDs were 0.62–1.11% for migration time, 1.33–1.75% for peak height and 2.04–2.87% for peak area under 500 V cm−1; 0.67–1.18% for migration time, 1.36–1.75% for peak height and 2.05–2.89% for peak area under 667 V cm−1; 0.61–1.14% for migration time, 1.30–1.72% for peak height and 2.01–2.83% for peak area under 833 V cm−1; and 0.66–1.20% for migration time, 1.38–1.83% for peak height and 1.93–2.84% for peak area under 1000 V cm−1. Next, 25 replicated trials (4 min for each separation) under an electric field of 1000 V cm−1 were performed over a 100 min period, which are provided as Fig. 7b. The precisions of migration time, peak height and peak area were variable in the ranges of 1.15–1.56%, 1.39–1.94% and 1.43–2.26%, respectively, demonstrating the long-term stability of CE analysis under high electrical fields. These results proved that the p-CE system was practical for routine CE analysis under very high electrical fields. The sustainable electrical field for the proposed p-CE system was comparable to that for microchip electrophoresis (characterized by high-speed analysis under ultra-high electrical fields), indicating that a fraction of the application range of the latter may be replaced by the former. The suitability of electrophoretic separation under high electrical fields (>500 V cm−1) by the proposed p-CE system may be attributed to numerous reasons. First, the ionic strength of phosphate buffer was lowered to 2 mM; thus, Joule heating effect was dramatically diminished. Second, a high back pressure was applied between the inlet and outlet of the separation capillary to avoid possible micro-bubble production due to severe Joule heating, which was accomplished by fixing the back pressure capillary after the separation. Furthermore, the pressurized flow in the proposed p-CE system could also partially remove Joule heat from the separation column.3.4 Electrophoretic separation under gradient mode
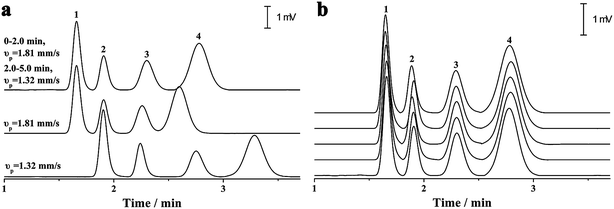
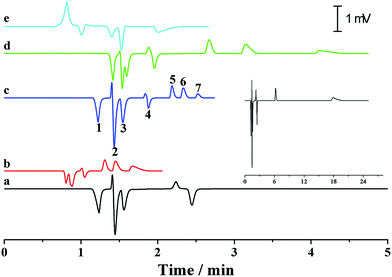
As previously discussed, independent optimization of the pressurized flow rate and electrical field was one advantage of the proposed p-CE system. For the analytes whose electrophoretic mobility differences were too large or small, high or low pressurized flow rates under isocratic modes would be preferred. However, for the analytes with a wide mobility range, the use of a low constant pressurized flow rate may prolong the analysis time and broaden peak widths significantly, whereas the baseline separation of analytes with minute mobility differences could not be achieved by using a high constant pressurized flow rate. In this case, a pressurized flow under a flow rate gradient mode could be employed to obtain optimal separation. The electrophoretic separations of 0.1 mM benzylamine, thiourea and benzoic acid, and 0.05 mM phthalate were performed under constant pressurized flow rates of 0.213 and 0.155 μL min−1, and under gradient pressurized flow rates (0.213 μL min−1 in first 2 min and 0.155 μL min−1 in the next 3 min), and the electropherograms are illustrated in Fig. 8a. Better resolution (2.27–3.23) but longer separation time was acquired at 0.155 μL min−1 under an isocratic flow rate mode, whereas shorter separation time but worse resolution (1.61–2.41) between benzoic acid and phthalate was obtained at 0.213 μL min−1 under an isocratic flow rate mode. Conversely, a compromise between resolution (2.09–2.56) and separation time was achieved under the abovementioned flow rate gradient mode. The precision of the separation under the abovementioned flow rate gradient mode was evaluated by five replicate runs (Fig. 8b). The RSDs of migration time, peak height and peak area were variable in the ranges of 0.55–1.2%, 1.20–2.42% and 1.88–2.90%, respectively, demonstrating good repeatability of CE analysis under the flow rate gradient mode.Simultaneous analysis of cations and anions of high mobility by the p-CE system under the flow rate gradient mode proved its merits. Lithium, potassium and calcium ion, as well as chloride, bromate and iodate, were selected as the target analytes. The separations of the abovementioned ions by the p-CE system under constant and gradient flow rate modes are demonstrated in Fig. 9a–c. For comparison, the analysis of the target ions was also performed by conventional CE under normal co-EOF (Fig. 9d)10 and reversed counter-EOF (Fig. 9e).29 The experimental results indicated that both the p-CE under a constant flow rate mode and the conventional CE systems under co-EOF and counter-EOF modes suffered from co-elution and/or peak tailing of cations or anions. However, an optimal separation of these ions was only achieved by the p-CE system under the flow rate gradient mode, which could also be achieved by CE with double side injection.10,30 This indicated that the proposed p-CE system is a simple and effective alternative in the analysis of multi-analytes with wide mobility ranges.
3.5 Determination of iodate in edible table salts
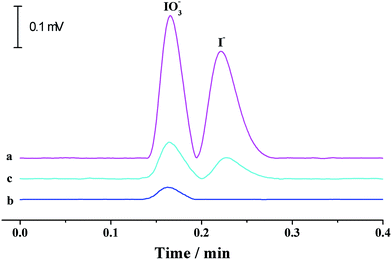
Iodine is one of the essential trace elements of thyroid hormones in the human body and other biological species. Iodine deficiency and excessive iodine intake can both lead to adverse effects. As table salt is an important iodine resource for human beings, iodine content in edible salt is important to strictly control daily iodine intake. The suitability of the proposed p-CE system in practical applications was demonstrated by the quantification of iodide and iodate in three edible table salt samples (S1–S3). The running buffer used for iodine speciation was 10 mM borate solution (pH 9.2). The separation capillary was a 75 μm fused silica capillary with a total length of 35 cm and an effective length of 20 cm. Electrophoresis was carried out under an electrical field of 600 V cm−1 (+21 kV) and at a flow rate of 200 μL min−1. The detection wavelength was set at 210 nm. Under optimized conditions, linear calibration curves with the regression equations of I = 510C + 216 (R = 0.9995) for iodide and I = 503C + 224 (R = 0.9993) for iodate (I: the UV intensity (μV × s), C: concentration of iodine species (mg L−1)) over the range of 0.05 to 100 mg L−1 were obtained with detection limits of 0.014 mg L−1 for iodide and 0.015 mg L−1 for iodate (0.2% (m/v) NaCl solution as the blank). Typical electropherograms for the separation of iodide and iodate in a 1 mg L−1 standard solution and the table salt S1, as well as its spiked solution, are shown in Fig. 10. Iodate contents in the three samples were variable in the range of 38.2–47.4 mg kg−1, which agreed well with the labeled values (20–50 mg kg−1) in iodized table salt. The recoveries (Table 4) varying from 94% to 104% validated the accuracy of the proposed method. It is worth mentioning that the separation time was less than that by microchip electrophoresis,26 proving the potential of the proposed p-CE system to high-speed analysis.| Sample | Determined (mg L−1) | Spiked (mg L−1) | Found (mg L−1) | Recovery (%) | ||||
|---|---|---|---|---|---|---|---|---|
| I− | IO3− | I− | IO3− | I− | IO3− | I− | IO3− | |
| S1 | ND | 0.094 ± 0.006 | 0.20 | 0.20 | 0.194 ± 0.006 | 0.283 ± 0.009 | 97 | 94 |
| S2 | ND | 0.076 ± 0.003 | 0.20 | 0.20 | 0.189 ± 0.006 | 0.271 ± 0.007 | 95 | 98 |
| S3 | ND | 0.088 ± 0.003 | 0.20 | 0.20 | 0.207 ± 0.007 | 0.295 ± 0.007 | 104 | 97 |
4. Conclusion
This work demonstrated the feasibility of a pressurized flow and valve sampling in an electrophoretic separation to improve the repeatability of CE analysis. The pressurized flow ranging from nL min−1 to μL min−1 was supplied by a high-pressure pump operated at ∼mL min−1 with flow splitting. The microliter sample from the rotary injector was injected into the separation capillary at a nanoliter level after the same flow splitting. The independent variation of the pressurized flow rate and electrical field could be carried out with respect to the analysis speed and separation efficiency. Furthermore, electrophoretic separation under either high electrical fields (>500 V cm−1) or gradient flow rate modes was practical for optimal separation. The proposed p-CE system offered good repeatability and wide applied range. By the coupling of an autosampler, a highly precise, reproducible and automatic CE system is anticipated for routine analysis in a variety of fields. In the near future, the p-CE system will be coupled with other detectors such as laser-induced fluorescence, electrochemiluminescence and inductively coupled plasma mass spectrometry.Acknowledgements
The authors acknowledge the financial support from the National Natural Science Foundation of China under project no. 21275038 and 21405030, the Analysis and Measurement Foundation of Zhejiang Province under project no. 2014C37094 and 2014C37100, and the Scientific Research Foundation of Zhejiang Provincial Department of Education under project no. (Y201430445).References
- A. Gałuszka, Z. Migaszewski and J. Namieśnik, TrAC, Trends Anal. Chem., 2013, 50, 78–84 CrossRef PubMed.
- L. H. Keith, L. U. Gron and J. L. Young, Chem. Rev., 2007, 107, 2695–2708 CrossRef CAS PubMed.
- M. Tobiszewski, A. Mechlińska and J. Namieśnik, Chem. Soc. Rev., 2010, 39, 2869–2878 RSC.
- A. A. Alhusban, M. C. Breadmore and R. M. Guijt, Electrophoresis, 2013, 34, 1465–1482 CrossRef CAS PubMed.
- M. Castro-Puyana, V. García-Cañas, C. Simó and A. Cifuentes, Electrophoresis, 2012, 33, 147–167 CrossRef CAS PubMed.
- M. Geiger, A. L. Hogerton and M. T. Bowser, Anal. Chem., 2011, 84, 577–596 CrossRef PubMed.
- M. C. Breadmore, J. Chromatogr., A, 2012, 1221, 42–55 CrossRef CAS PubMed.
- A. M. Idris, Crit. Rev. Anal. Chem., 2010, 40, 150–158 CrossRef CAS.
- L. R. Snyder, J. J. Kirkland and J. W. Dolan, Introduction to Modern Liquid Chromatography, John Wiley & Sons, Inc., 2010 Search PubMed.
- I. Haumann, J. Boden, A. Mainka and U. Jegle, J. Chromatogr., A, 2000, 895, 269–277 CrossRef CAS.
- T. D. Mai and P. C. Hauser, J. Chromatogr., A, 2012, 1267, 266–272 CrossRef CAS PubMed.
- T. D. Mai and P. C. Hauser, Talanta, 2011, 84, 1228–1233 CrossRef CAS PubMed.
- T. D. Mai and P. C. Hauser, Electrophoresis, 2011, 32, 3000–3007 CrossRef CAS PubMed.
- T. D. Mai, S. Schmida, B. Müller and P. C. Hauser, Anal. Chim. Acta, 2010, 665, 1–6 CrossRef CAS PubMed.
- C. Yao, R. Gao and C. Yan, J. Sep. Sci., 2003, 26, 37–42 CrossRef CAS.
- R. M. Saito, W. K. T. Coltro and D. P. de Jesus, Electrophoresis, 2012, 33, 2614–2623 CrossRef CAS PubMed.
- L. Xia and D. Dutta, Anal. Chem., 2012, 84, 10058–10063 CrossRef CAS PubMed.
- Q. J. Song, G. M. Greenway and T. McCreedy, J. Anal. At. Spectrom., 2003, 18, 1–3 RSC.
- T. Tsuda, T. Mizuno and J. Akiyama, Anal. Chem., 1987, 59, 799–800 CrossRef CAS.
- E. Iizuka, T. Tsuda, M. Munesue and S. Samizo, Anal. Chem., 2003, 75, 3929–3933 CrossRef CAS.
- T. Hanai and H. Tsuruta, Instrum. Sci. Technol., 1994, 22, 151–155 CrossRef CAS.
- M. Li, J. Zhou, X. Gu, Y. Wang, X. Huang and C. Yan, J. Sep. Sci., 2009, 32, 267–274 CrossRef CAS PubMed.
- B. X. Mayer, J. Chromatogr., A, 2001, 907, 21–37 CrossRef CAS.
- F. Opekar, P. Coufal and K. Štulík, Chem. Rev., 2009, 109, 4487–4499 CrossRef CAS PubMed.
- Q. Li, T. Zhang and Q. Fang, Chin. J. Anal. Chem., 2013, 41, 650–657 CAS.
- H. Cheng, J. Liu, X. Yin, H. Shen and Z. Xu, Analyst, 2012, 137, 3111–3118 RSC.
- Y. Chen, J.-V. Höltje and U. Schwarz, J. Chromatogr., A, 1994, 685, 121–129 CrossRef CAS.
- X. Mao, Y. Luo, Z. Dai, K. Wang, Y. Du and B. Lin, Anal. Chem., 2004, 76, 6941–6947 CrossRef CAS PubMed.
- C. Johns, W. C. Yang, M. Macka and P. R. Haddad, J. Chromatogr., A, 2004, 1050, 217–222 CrossRef CAS PubMed.
- A. J. Gaudry, R. M. Guijt, M. Macka, J. P. Hutchinson, C. Johns, E. F. Hilder, G. W. Dicinoski, P. N. Nesterenko, P. R. Haddad and M. C. Breadmore, Anal. Chim. Acta, 2013, 781, 80–87 CrossRef CAS PubMed.
| This journal is © The Royal Society of Chemistry 2015 |

