 Open Access Article
STEM-in-SEM high resolution imaging of gold nanoparticles and bivalve tissues in bioaccumulation experiments†
C. A.
García-Negrete
*a,
M. C.
Jiménez de Haro
a,
J.
Blasco
b,
M.
Soto
c and
A.
Fernández
*a
aInstituto de Ciencia de Materiales de Sevilla (CSIC - Univ. Sevilla), Avda. Américo Vespucio nr. 49, CIC Cartuja, 41092 Sevilla, Spain. E-mail: asuncion@icmse.csic.es; carlos.garcia@icmse.csic.es
bInstituto de Ciencias Marinas de Andalucía (ICMAN-CSIC), Campus Universitario Río San Pedro, 11519 Puerto Real (Cádiz), Spain
cZoology and Cell Biology Dept., Science and Technology Faculty & Research Centre in Experimental Marine Biology and Biotechnology (PiE-UPV/EHU) University of the Basque Country, Sarriena auzoa Z/G, 48940 Leioa-Bizkaia, Basque Country, Spain
First published on 5th February 2015
Abstract
The methodology termed scanning transmission electron microscopy in scanning electron microscopy (STEM-in-SEM) has been used in this work to study the uptake of citrate stabilized gold nanoparticles (AuNPs) (average particle sizes of 23.5 ± 4.0 nm) into tissue samples upon in vitro exposure of the dissected gills of the Ruditapes philippinarum marine bivalve to the nanoparticle suspensions. The STEM-in-SEM methodology has been optimized for achieving optimum resolution under SEM low voltage operating conditions (20–30 kV). Based on scanning microscope assessments and resolution testing (SMART), resolutions well below 10 nm were appropriately achieved by working at magnifications over 100k×, with experimental sample thickness between 300 and 200 nm. These relatively thick slices appear to be stable under the beam and help avoid NP displacement during cutting. We herein show that both localizing of the internalized nanoparticles and imaging of ultrastructural disturbances in gill tissues are strongly accessible due to the improved resolution, even at sample thicknesses higher than those normally employed in standard TEM techniques at higher voltages. Ultrastructural imaging of bio-nano features in bioaccumulation experiments have been demonstrated in this study.
Introduction
The characterization of in vitro nanoparticles’ uptake and localization has been an issue of increasing attention.1 Transmission electron microscopy (TEM) is currently used to provide detailed information regarding the nanoparticles’ uptake and localization by allowing both visualization of nanoparticles location within target cells and/or tissues and, in conjunction with spectroscopic methods, characterization of the composition of internalized nanoparticles.1,2 However, characterization of soft materials by TEM has been limited due to their susceptibility to high-voltage electron beams.3 A hybrid characterization technique such as STEM-in-SEM may be a convenient characterization approach for these materials offering advantages such as lower accelerating voltages, larger field of view, and exclusion of a post-specimen projection lens.3,4 A STEM system added to the standard SEM is often designated as STEM-in-SEM or “low voltage STEM” (a term referring to the 20–30 kV regime, i.e. low relative to typical TEM operating energies).5 The STEM-in-SEM technique is based on two principles. First, as in SEM, the beam focuses on a small spot that scans over the sample and imaging is performed by mapping some signal intensity synchronously with the scan.5 Second, as in TEM, image information is extracted from electrons that have passed through a thin sample.5Bivalve molluscs are the recognized pollution indicators in ecological monitoring programs.6–8 Among several bivalves, Ruditapes philippinarum is a model frequently used for investigating the effects and mechanisms of actions underlying the potential toxicity of NPs in marine invertebrates.9,10 Recently, an in vitro approach based on haemocytes of the clam Ruditapes philippinarum was used to investigate the effects of TiO2 nanoparticles on the phagocytic activity10 while efforts to establish primary cell cultures from the mantle of the clam P. malabarica were also performed.11 Regarding the toxicity exerted by nanoparticles in a variety of taxa, details were also described12 of how nanoparticles may interact with organisms through different ways such as adsorption to the surface (cell, organ or body), cellular internalization, or dissolution of ions from the NPs. The STEM-in-SEM technique was applied by the authors in a previous paper after in vivo exposure of Ruditapes philippinarum to high and low relevant concentrations of Au NPs and to ionic gold (Au3+) ranging from ppm to ppb levels.13 This technique successfully allowed the ultrastructural localization of AuNPs in the target tissues and cells when delivered to artificial SW media.
In the present work, STEM-in-SEM has been carefully optimized and used to study the uptake and subcellular distribution of citrate stabilized gold nanoparticles in gill samples from Ruditapes philippinarum upon in vitro exposure of gill explants (ex vivo) to the nanoparticles. The development of in vitro models for assessing the toxicity of NPs, via direct exposure of isolated cells or with organ explants (ex vivo), allows experimentation on organism cells or tissue under more controlled conditions than in vivo and can contribute to develop new models as test systems for NP toxicity in future. Location studies were performed together with bioaccumulation analytical measurements in the same experiments under ecotoxicologically relevant conditions, such as sea water media and low (sublethal) concentrations. We show how gold nanoparticles accumulate in the gills, as well as their subcellular location with nano-scale resolution. In addition, this paper presents the optimization of the STEM-in-SEM methodology for achieving optimum resolution under the SEM low voltage operating conditions.
Experimental section
AuNP suspensions: preparation and characterization
AuNP suspensions with a concentration of 60 mg L−1 (as Au) were prepared following a procedure based on the synthesis method of Frens.14 Specifically, 0.006 g of HAuCl4·3H2O (Aldrich, 99.9%) was dissolved in 50 mL of MilliQ® water in a 100 mL round bottomed flask and heated to boiling under reflux conditions. Then, 0.01 g of sodium citrate (Sigma-Aldrich, 99%) dissolved in 1 mL of MilliQ® water was added, and the solution was allowed to react until the red colour remained in the final suspension. From this starting solution, another sample was prepared by dilution to 750 μg L−1 in standard sea water (SW) media.For basic TEM characterization, colloidal solutions of 60 mg L−1 of Au in MilliQ® water and 750 μg L−1 in SW were used, while for UV-Visible spectroscopy measurements, the representative samples with 5 mg L−1 of Au in either MilliQ® or SW were tested to ensure sufficient signal and to allow a comparison. For in vitro testing, the as prepared 60 mg L−1 in MilliQ® water as well as the 750 μg L−1 in SW solution were used.
Primary particle size and morphology were characterized using a TEM microscope (Philips CM200) operating at 200 kV. For sample preparation, 5 μL of a particular AuNP suspension was pipetted onto a carbon-coated copper TEM grid and left to dry in air. A Perkin Elmer Lambda 12 spectrometer was used for UV-Vis spectra acquisition.
In vitro exposure experiments
Adult clams (Ruditapes philippinarum) of the same age with a shell length (maximum axis) between 4.4 and 3.2 cm were supplied by a commercial clam aquaculture facility (Amalthea S. L., Chiclana, Spain). The clams were dissected over ice and the gill explants were immersed into colloidal solutions of AuNPs at concentrations of 60 mg L−1 in MilliQ® water and 750 μg L−1 in SW. A control series was run parallel by immersing gills in pure MilliQ® and standard SW without AuNPs. After immersing the gill explants for 1 and 6 hours, they were removed from the solution and washed at least three times with MilliQ® water or SW. Portions of the gill explants were then processed for gold accumulation analysis and for STEM-in-SEM imaging and analysis as described below.Analysis of gold accumulation in tissue samples
Gold accumulation was determined in the gill tissues after in vitro exposure to AuNP suspensions of 750 μg L−1 and after control exposures (both in seawater media). After washing as described above, the tissues were first washed with an AEDT solution 0.1 mM in SW and then with SW solution alone to remove Au traces that were adsorbed on the surface of the gills. The gills were then digested with 2 mL of “aqua regia” at 95 °C for 60 min by employing a digestion system (DigiPrep MS, SCP Science, France). The digested samples were filled to 10 mL. All of the reagents were of Suprapur quality (Merck). The results are expressed as μg g−1 wet weight.The STEM-in-SEM methodology and the imaging of gold NPs in tissue samples
After the in vitro exposure experiment (described in the section above), the gill tissues were cut into portions of 3–4 mm2 and then fixed in cold 0.1 M sodium cacodylate trihydrate buffer solution (pH = 7.4) containing 2.5% of glutaraldehyde for 2.5 h at 4 °C. Then, the samples were washed three times in sodium trihydrate cacodylate buffer solution (pH = 7.4) for 5 min each and stored at 4 °C.The samples were post-fixed in 1% osmium tetroxide for 1 h at 4 °C and rinsed in a buffer solution (3 times) containing 7.5% sucrose for 20 min. The samples were then dehydrated at 4 °C in acetone (30, 0 and 70% acetone baths for 15 min each). Afterwards, the samples were rinsed in a 70% acetone bath containing 2% uranyl acetate for 4 h for mild pre-staining and dehydrated once in 90% acetone (30 min) and twice in 100% acetone (15 min each). Embedding in Spurr's resin was performed at the same temperature (4 °C) with acetone–resin mixtures of 3![[thin space (1/6-em)]](https://www.rsc.org/images/entities/char_2009.gif) :
:![[thin space (1/6-em)]](https://www.rsc.org/images/entities/char_2009.gif) 1 for 1 h, 1
1 for 1 h, 1![[thin space (1/6-em)]](https://www.rsc.org/images/entities/char_2009.gif) :
:![[thin space (1/6-em)]](https://www.rsc.org/images/entities/char_2009.gif) 1 for the second hour, and 1
1 for the second hour, and 1![[thin space (1/6-em)]](https://www.rsc.org/images/entities/char_2009.gif) :
:![[thin space (1/6-em)]](https://www.rsc.org/images/entities/char_2009.gif) 3 for the third hour, followed by embedding in pure resin for 12 h. The samples were polymerized at 70 °C for a period of 7 h. Finally, semi-thin sections (range: 100–400 nm) were cut with an ultramicrotome (Leica EM UC7) using a diamond knife and placed on a carbon-coated copper TEM grid.
3 for the third hour, followed by embedding in pure resin for 12 h. The samples were polymerized at 70 °C for a period of 7 h. Finally, semi-thin sections (range: 100–400 nm) were cut with an ultramicrotome (Leica EM UC7) using a diamond knife and placed on a carbon-coated copper TEM grid.
Studies by FE-SEM (field emission gun SEM microscope) were performed using a Hitachi S4800 microscope also coupled to an Energy Dispersive X-ray (EDX) detector (Bruker, XFlash 4010) and equipped with a transmission mode detector. Details of these measurements are thoroughly reported in the Results and discussion section.
Results and discussion
AuNP characterization
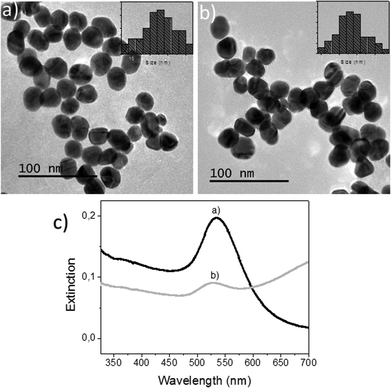
First, colloidal solutions of AuNPs in both MilliQ® water and SW were characterized. The representative TEM images are shown in Fig. 1a and b. Nearly spherical particles with average diameters of 22.5 ± 4.6 nm and 23.5 ± 4.0 nm were obtained for samples containing 60 mg L−1 of Au in MilliQ® water and 750 μg L−1 of Au in SW. Although the Au concentration used in the MilliQ® water was much higher than in SW, the agglomeration in both cases was comparatively similar because of the greater ionic strength of the SW media which favours agglomeration. Nevertheless, the TEM study showed that for Au concentrations close to 750 μg L−1 in SW, NP assemblies could still dissociate easily13 and only limited coalescence was observed (Fig. 1b). Particles were therefore available for uptake during the tissue exposure experiments as shown in the following sections.The characterization by UV-VIS absorption spectroscopy could not be performed at very low concentrations due to a lack of signal. For this study, nanoparticle suspensions were prepared with mass-normalized concentrations of 5 mg L−1 (as Au) in either MilliQ® water or SW. As shown in Fig. 1c, the signals due to the localized surface plasmon resonance (SPR) of Au were clearly observed. The SPR signal of Au in SW had an expected intensity loss that is attributable to higher inter-particle interactions13 at these concentrations. A concentration of 60 ppm in MilliQ® water, although it is not ecotoxicologically relevant, was used in this work to optimize some of the parameters in the STEM-in-SEM methodology. As shown by TEM in this section, these suspensions showed limited coalescence and therefore were available for uptake during the tissue exposure experiments.
A more detailed analysis of the physico-chemical evolution of citrate-stabilized AuNPs in SW media is available in ref. 13, where attempts to approach concentration values predicted15,16 in the environment were also performed.
The STEM-in-SEM methodology for imaging of gold NPs in tissue samples
The first main objective in this work was to explore the use of a SEM-FEG microscope operated in the transmission mode at 20–30 kV for imaging AuNPs in tissue samples after our in vitro exposure experiments. The microscope configuration for STEM in a FE-SEM (see Fig. 2) includes a dedicated sample holder for conventional copper TEM grids and a dedicated bright field STEM detector (BF-STEM). This detector is located below the dedicated sample holder, which also includes a fixed STEM aperture. The upper detector, a through-the-lens (TTL) detector, permits one to record the conventional secondary electron SEM images. In addition, the EDX detector is also available for chemical analysis.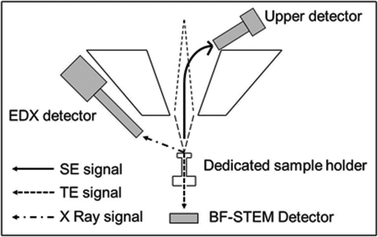 | ||
| Fig. 2 Microscope configuration for STEM analysis used in our FE-SEM Hitachi S4800 microscope. SE: secondary electrons; TE: transmitted electrons. | ||
Despite the lower resolution compared to conventional TEM at typical voltages of 80–100 kV, the STEM-in-SEM offers contrast enhancement over TEM due to lower (20–30 kV) electron energy in the SEM.17 The increased electron scattering cross-section provides better insight into the morphology of low Z (atomic number) materials, such as polymers or carbon nanotubes.17,18 Less damage in soft condensed matter is also expected. In addition, the use of a STEM detector in a standard SEM has the advantage of avoiding chromatic aberration. As there is no projection lens, no image deterioration occurs due to chromatic aberrations, even in the case of inelastic interactions at low voltages.5
In the particular case of imaging gold NPs of ca. 23 nm in diameter in tissue bioaccumulation experiments, several specific features have been pursued with this methodology. Measurements were optimized with the goal of working with thicker slices (ca. 200–300 nm) to stabilize the samples under the electron beam (also improved by the use of a lower voltage compared to TEM). The work with thick samples likely also avoids the NP displacement during cutting and increases the possibility of finding NPs while working with low NP doses (e.g., environmentally-relevant concentrations). In addition, the good contrast for low Z elements may allow for reducing (or even eliminating) heavy metal staining, which is of great interest when analysing the location of NPs. In all the cases, EDX analysis was undertaken to confirm the chemical nature of the high contrast features.
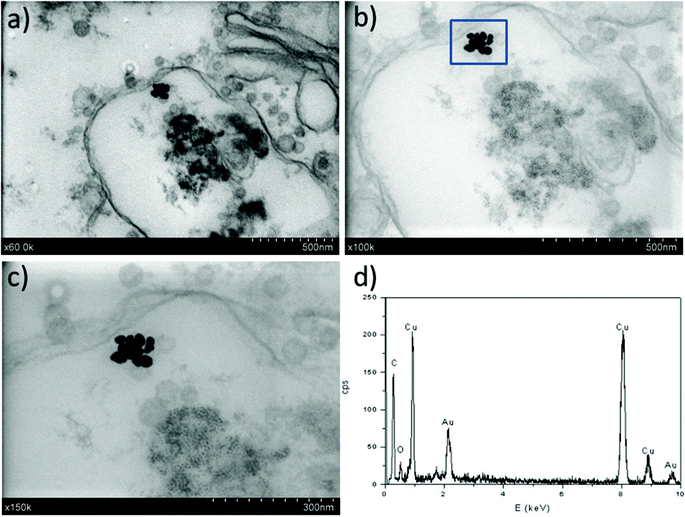
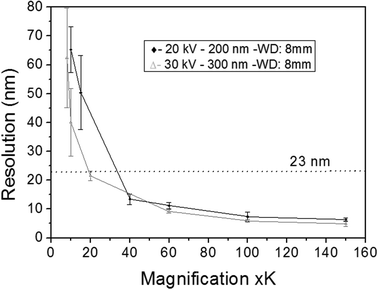
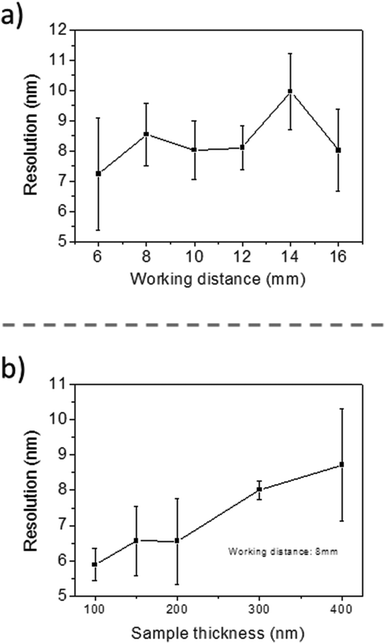
The first results are presented in Fig. 3 for slices obtained after in vitro exposures for 1 hour into AuNP colloidal solutions containing 60 mg L−1 of gold in MilliQ® water. The localization of high Z nanoparticles in low Z tissue matrices was clearly shown using the STEM-in-SEM coupled to EDX analysis (Fig. 3a–d). As mentioned above, the exposure conditions were not relevant for ecotoxicological studies because the concentration of AuNPs was too high, and they were not supplied in sea water media. The experimental conditions were however chosen to ensure the presence of AuNPs in the gill tissue with the purpose of using these slices to optimize some parameters of the methodological approach before going to more dilute solutions in the SW media. By using actual FE-SEM microscopes, probe sizes fall into values smaller than 10 nm. To determine the actual resolution, a sputtered gold is commonly used, measuring the smallest gap between gold islands that are visible on a micrograph.19 However, this method is not totally a representative of all specimens of interest. In addition, Demers et al.20,21 studied the broadening of a scanning electron probe inside a micrometre thick film using Monte Carlo simulations. They found that the lateral resolution was noise limited for film thicknesses <0.2 μm and by the probe broadening for film thicknesses >1 μm; the intermediate thicknesses represent a transition regime. Considering this background, we have estimated the resolution using our FE-SEM microscope directly from the images of tissue slices by fast Fourier transform (FFT) algorithms19 on specific images. We have used the SMART macro running inside the “SCION Image” program under windows.19 Using different sets of images, such as those shown in Fig. 3, the microscopic resolution for these particular samples has been determined under different measuring conditions. Fig. 4 shows the magnification dependence of the estimated resolution. It can be clearly observed that the resolution improves with the increase of magnification. A prominent feature of working at magnifications over 100k× is that resolutions below 10 nm can be obtained for slices of 200–300 nm. Another interesting fact that can be seen from Fig. 4 is that the operating voltages of either 20 or 30 kV are adequate to achieve resolutions below 10 nm. Furthermore, optimization of the observation conditions was then performed by taking into account the working distance dependence (Fig. 5a) for 300 nm slices, as well as the sample thickness dependence (Fig. 5b) for an optimum working distance of 8 mm at the reference magnification of 100k×. Under these optimized conditions, the tissue slices used to acquire all the images originated from the in vitro experiment. As shown in Fig. 5a and b, the conditions for improved resolutions feasibly gave values below 10 nm, which is adequate for imaging relatively small objects, such as the AuNPs with an average diameter of 23 nm.
The in vitro experiments: gold accumulation in gill explants
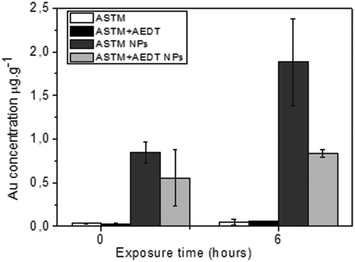
In vitro exposure of gill explants into AuNP colloidal solutions containing 750 μg L−1 of gold in standard SW for 1 and 6 hours was the following step in our study. Assays of bivalve tissue exposures to AuNPs (750 μg L−1) were carried out, together with control experiments. Analyses of tissue samples by ICP-MS are shown in Fig. 6. It was evidenced that the exposure time had an effect on accumulation, which was detected in all NP treatments, even in those cases where AEDT-mediated washing was used. Trace amounts of gold for the control experiments are within the experimental errors and are considered as zero values. Gold concentrations found after one hour of exposure were significantly less than those observed after six hours of exposure, showing that gold accumulation increases with the exposure time.The uptake found in these accumulation analyses, as well as location by electron microscopy in the section below, demonstrate cell viability for the exposure time in our in vitro experiments. In particular, histopathological alterations in the gills after exposure to Au NPs, compared to control experiments, have been concluded by optical microscopy from semi-thin sections after toluidine blue staining (ESI, Fig. S1†). These alterations are discussed below with regard to ultrastructural characterization using the STEM-in-SEM methodology.
Subcellular localization of AuNPs
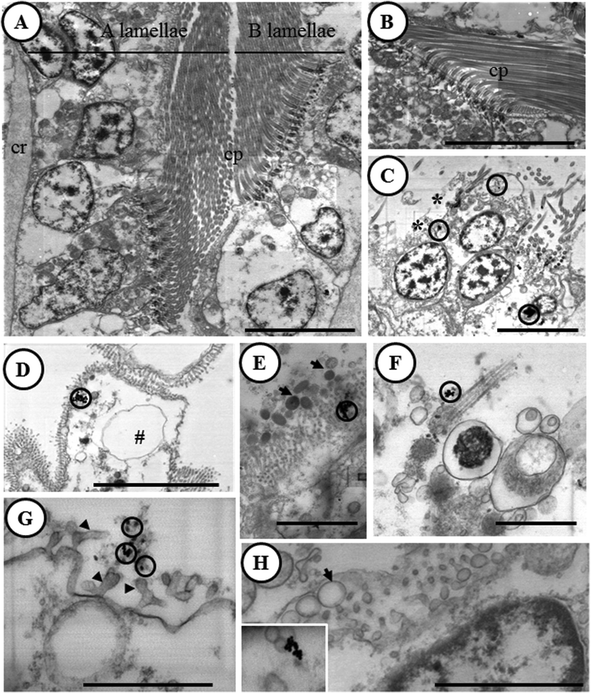
The feasibility of the optimized STEM-in-SEM methodology for ultrastructural characterization at the bio-nano interface is corroborated below. The main results are summarized in Fig. 7. Unlike in control gill samples (Fig. 7A and B), electron-dense particles were observed in the gill samples exposed to AuNPs (Fig. 7C–H). These electron-dense particles were located in secretory granules placed in the apex of ciliary cells (Fig. 7C and D), outside the gill epithelium attached to microvilli and cilia, or associated with excreted secretory granules and cell debris (Fig. 7E–G). For all of these electron-dense particles, the presence of Au was corroborated by X-ray microanalysis (ESI, Fig. S2†), in contrast to control samples in which Au was not found. As we discussed in the previous section, analysis of tissue samples by ICP-MS can be performed in order to obtain the representative quantitative data of bioaccumulation. The joint approach between the results obtained by ICP-MS analysis and those corresponding to X-ray microanalysis coupled to STEM-in-SEM is ideal for a most pertinent chemical element analysis of the sample. The detection limit in EDX analysis reaches values as low as 0.1 wt% under optimum conditions.22 This should be borne in mind because as the Au concentrations found in this study by ICP-MS are below the detection limit, the technique does not meet the requirement of representativeness in quantification capability. However, this cannot rule out the possibility to analyze and to differentiate the chemical composition of distinct particles by using EDX analysis. In fact, Fe and Ti containing particles (likely from natural bivalve's feeding) were also detected as shown in ESI (Fig. S3 and S4†).In a previous study with the marine bivalve Scrobicularia plana, 40 nm AuNPs were detected close to the basal site of microvilli, suggesting the ability of AuNPs to penetrate this epithelium.23 Although accumulation pathways between in vivo and in vitro experiments cannot be compared directly, the improved STEM-in-SEM methodology that is shown here allowed for the precise location of the accumulation of AuNPs in distinct cell organelles. Interestingly, the AuNPs attachment to microvilli (between other organelles) is a point of similarity between the bivalve in vivo experiment and our in vitro assay. The improved STEM-in-SEM technique has also been demonstrated to be highly useful to assess histopathological effects. Histopathological alterations in the gills of clams have been reported to be very sensitive after exposure to a variety of xenobiotics and to the presence of different kinds of parasites since they play a crucial role in respiration, food collection and absorption/digestion.24–28 In the present work, a well-known series of histopathological lesions in the gill tissues have been observed in gill explants after short exposures (6 h) to the AuNP solution. These alterations included cell and tissue level alterations. Specifically, epithelial cells (both ciliary and cuboidal cells) were highly vacuolated (Fig. 7C–H), with a hydropic cytoplasm, thickened basal lamina, and a loss of cilia and microvilli in the apex of both cell types. By considering the general picture of histopathological alterations, it can be concluded that this may cause an impairment of several physiological functions, such as respiration and feeding, which could affect the health status of the gill samples as a result of short-term exposure to AuNPs.
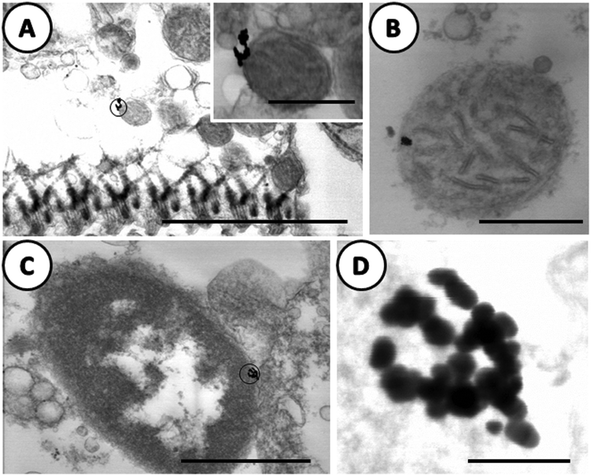
In Fig. 8, images have been selected at higher magnifications. Electron-dense particles in the gills of clams exposed to AuNPs were clearly visible in the apex of epithelial cells attached to the outer membrane of the mitochondria (Fig. 8A) and to the nuclear envelop of the same cell type (Fig. 8C). In Fig. 8B, the electron-dense particles appeared to be inside the mitochondria; the interpretation is not clear as this image was obtained from an area with excreted secretory granules and cell debris around the mitochondria. What is important to emphasize is the high resolution achieved both at the tissue and NPs features. Another important result is that in the case of gold NPs, which are highly resistant to solubilization or oxidation, the electron-dense particles, clearly visible in Fig. 8D, maintain the original shape and size of the dosed AuNPs even after internalization.
Conclusions
Well characterized AuNP suspensions have been prepared by the citrate-reduction method and used for in vitro exposure experiments of tissue samples to determine the location of accumulated NPs as well as to evaluate the tissue damage. The imaging of relatively thick specimens (∼200–300 nm slices) by STEM-in-SEM is presented here as a powerful electron microscopy technique that makes the localization of high Z contrast engineered NPs in low Z contrast tissue matrices relatively easy.In accordance with the worldwide use of marine bivalve molluscs as pollutant indicators in ecological monitoring programs, application of the technique to ecotoxicity research has been demonstrated in vitro using gill explants of the bivalve Ruditapes philippinarum. The optimized STEM-in-SEM methodology showed great feasibility for ultrastructural characterization at the bio-nano interface achieving resolutions well below 10 nm at magnifications over 100k× for experimental sample thickness between 300 and 200 nm. AuNPs that accumulated in the gill tissues after in vitro exposure in sea water media were localized not only in secretory granules and cell debris but also attached to organelles such as the mitochondria and, most interestingly, to the microvilli.
It can be concluded that the improved STEM-in-SEM technique presented herein provides a simple and useful tool to be applied in ecotoxicological research to assess the subcellular location of nanomaterials and their possible toxic effects. Its extensive use is encouraged due to its time efficiency and sample thickness versatility.
Acknowledgements
The authors gratefully acknowledge financial support from the Junta de Andalucía and EU FEDER (project PE2009-FQM-4554, PE2011-RNM-7812 and TEP-217) and the EU FP7 AL-NANOFUNC project (CT-REGPOT2011-1-285895). We also acknowledge the support of the publication fee by the CSIC Open Access Publication Support Initiative through its Unit of Information Resources for Research (URICI).Notes and references
- B. Marquis, S. Love, K. Braun and C. Haynes, Analyst, 2012, 134(3), 425–439 RSC.
- A. L. Koh, C. M. Shachaf, S. Elchuri, G. Nolan and R. Sinclair, Ultramicroscopy, 2008, 109(1), 111–121 CrossRef CAS PubMed.
- C. Villinger, H. Gregorious, C. Kranz, K. Höhn, C. Münzberg, G. von Wichert, B. Mizaikoff, G. Wanner and P. Walther, Histochem. Cell Biol., 2012, 138, 549–556 CrossRef CAS PubMed.
- B. Patel and M. Watanabe, Microsc. Microanal., 2012, 20, 124–132 CrossRef PubMed.
- A. Bogner, P. H. Jouneau, G. Thollet, D. Basset and C. Gauthier, Micron, 2007, 38, 390–401 CrossRef CAS PubMed.
- T. Gomes, J. P. Pinheiro, I. Cancio, C. G. Pereira, C. Cardoso and M. Bebianno, Environ. Sci. Technol., 2011, 45(21), 9356–9362 CrossRef CAS PubMed.
- L. Canesi, C. Ciacci, R. Fabbri, A. Marcomini, G. Pojana and G. Gallo, Mar. Environ. Res., 2012, 76, 16–21 CrossRef CAS PubMed.
- A. Lapresta-Fernández, A. Fernández and J. Blasco, Trends Anal. Chem., 2012, 32, 40–59 CrossRef PubMed.
- S. Tedesco, H. Doyle, J. Blasco, G. Redmond and D. Scheehan, Comp. Biochem. Physiol., C: Comp. Pharmacol. Toxicol., 2010, 151, 167–174 CrossRef PubMed.
- I. Marisa, M. G. Marin, F. Caicci, E. Franceschinis, A. Martucci and V. Matozzo, Mar. Environ. Res., 2015, 103, 11–27 CrossRef CAS PubMed.
- S. Dessai, In Vitro Cell. Dev. Bio. Anim., 2012, 48, 473–477 CrossRef PubMed.
- T. J. Baker, C. R. Tyler and T. S. Galloway, Environ. Pollut., 2014, 186, 257–271 CrossRef CAS PubMed.
- C. A. García-Negrete, J. Blasco, M. Volland, T. C. Rojas, M. Hampel, A. Lapresta-Fernández, M. C. Jiménez De Haro, M. Soto and A. Fernández, Environ. Pollut., 2013, 174, 134–141 CrossRef PubMed.
- G. Frens, Nature Phys. Sci., 1972, 241, 20–22 CrossRef.
- A. B. A. Boxall, Q. Chaudhry, C. Sinclair, A. Jones, R. Aitken, B. Jefferson and C. Watts, Current and Future Predicted Environmental Exposure to Engineered Nanoparticles, Report to Defra, 2008 Search PubMed.
- K. Tiede, M. Hassellov, E. Breitbarth, Q. Chaudhry and A. B. A. Boxall, J. Chromatogr., A, 2009, 1216, 503–509 CrossRef CAS PubMed.
- O. Guise, C. Strom and N. Preschilla, Microsc. Microanal., 2008, 14(Suppl 2), 678–679 CrossRef.
- C. Probst, R. Gauvin and R. A. L. Drew, Micron, 2007, 38, 402–408 CrossRef CAS PubMed.
- D. C. Joy, J. Microsc., 2002, 208, 24–34 CrossRef CAS.
- H. Demers, N. Poirier-Demers, D. Drouin and N. de Jonge, Microsc. Microanal., 2010, 16(06), 795–804 CrossRef CAS PubMed.
- H. Demers, R. Ramachandra, D. Drouin and N. de Jonge, Microsc. Microanal., 2012, 18, 582–590 CrossRef CAS PubMed.
- Scanning Electron Microscopy and X-ray Microanalysis, ed. J. I. Goldstein, D. E. Newbury, P. Echlin, D. C. Joy, A. D. Romig, C. E. Lyman, C. Fiori and E. Lifshin, Plenum Press, New York, 1992 Search PubMed.
- Y. Joubert, J. F. Pan, P. E. Buffet, P. Pilet, D. Gilliland, E. Valsami-Jones, C. Mouneyrac and C. Amiard-Triquet, Gold Bull., 2013, 46, 47–56 CrossRef CAS PubMed.
- C. Acevedo, Mar. Biol., 1989, 100, 339–341 CrossRef.
- F. Rodriguez and J. I. Navas, Aquaculture, 1995, 132, 145–152 CrossRef.
- C. Acevedo and L. Corral, Dis. Aquat. Organ., 1997, 31, 73–78 CrossRef.
- N. S. El-Shenawy, T. I. S. Moawad, M. E. Mohallal, I. M. Abdel-Nabi and I. A. Taha, Ocean Sci. J., 2009, 44(1), 27–34 CrossRef CAS.
- P. M. Costa, S. Carreira, M. H. Costa and S. Caeiro, Aquat. Toxicol., 2013, 126, 442–454 CrossRef CAS PubMed.
Footnote |
| † Electronic supplementary information (ESI) available: Micrographs of semithin sections of the gills as well as the typical identification of electron-dense contrasts by EDX analysis. See DOI: 10.1039/c4an01643b |
| This journal is © The Royal Society of Chemistry 2015 |

