In vitro HER2 protein-induced affinity dissociation of carbon nanotube-wrapped anti-HER2 aptamers for HER2 protein detection†
Javed H.
Niazi
*a,
Sandeep K.
Verma
a,
Sarfaraj
Niazi
b and
Anjum
Qureshi
a
aSabanci University Nanotechnology Research and Application Center, Orta Mah, 34956 Istanbul, Turkey. E-mail: javed@sabanciuniv.edu; Fax: +90 216 483 9885; Tel: +90 216 483 9879
bDepartment of Pharmaceutical Chemistry, JSS College of Pharmacy, SS Nagara 570015, Mysore, Karnataka, India
First published on 16th October 2014
Abstract
A new in vitro assay was developed to detect human epidermal growth factor receptor 2 (HER2) protein, based on affinity dissociation of carbon nanotube (CNT)-wrapped anti-HER2 ssDNA aptamers. First, we selected an anti-HER2 ssDNA aptamer (H2) using an in vitro serial evolution of ligands by an exponential enrichment (SELEX) process. Then the fluorescently labelled H2 ssDNAs were tightly packed on CNTs that had previously been coupled with magnetic microbeads (MBs), forming MB–CNT–H2 hybrids. The loading capacity of these MB–CNTs heterostructures (2.8 × 10⁸) was determined to be 0.025 to 3.125 μM of H2. HER2 protein-induced H2 dissociation occurred from MB–CNT–H2 hybrids, which was specifically induced by the target HER2 protein, with a dissociation constant (Kd) of 270 nM. The stoichiometric affinity dissociation ratio with respect to H2-to-HER2 protein was shown to be approximately 1![[thin space (1/6-em)]](https://www.rsc.org/images/entities/char_2009.gif) :
:![[thin space (1/6-em)]](https://www.rsc.org/images/entities/char_2009.gif) 1. Our results demonstrated that the developed assay can be an effective approach in detecting native forms of disease biomarkers in free solutions or in biological samples, for accurate diagnosis.
1. Our results demonstrated that the developed assay can be an effective approach in detecting native forms of disease biomarkers in free solutions or in biological samples, for accurate diagnosis.
1. Introduction
Nanomaterials are now used in a wide spectrum of applications in the biomedical field. They have been effectively utilized to deliver biologically active cargo to the sites of interest for purposes of cancer diagnosis and therapy.1–3 Various nanostructured materials such as carbon nanotubes (CNTs),4 polymeric nanoconjugates,5,6 and nanoparticles7,8 have been explored, especially in cancer therapy.9 The unique physicochemical properties of CNTs have been exploited as popular tools in cancer diagnosis and therapy.10 They are considered one of the most promising nanomaterials, with the capability of both detecting cancerous cells and delivering small therapeutic molecules.10 In addition, CNTs can effectively shuttle various bio-molecules into cells, including drugs,3,11 peptides,12 proteins,13 plasmid DNA,14 small interfering RNA,15 and aptamers,16via endocytosis.17 Therefore, it is imperative to develop new methods utilizing the unique physicochemical properties of CNTs in biomedical applications, including the detection of cancer biomarkers at the early stages with high specificity and selectivity.Tumor-targeted therapies require ligands that can bind to cancer cells where aptamers can represent an alternative therapeutic modality. These molecules are small, single-stranded DNA or RNA in nature.18 Aptamers have great prospects in therapeutic applications, especially in cancer treatment. For example, AS1411, a nucleolin-specific truncated version of an aptamer called GRO29A, is currently in advanced clinical trials.19 Other therapeutic aptamers that have been tested for antiviral, anticoagulation, anti-inflammatory and antiangiogenic properties are already in clinical trials.20 Macugen is the first clinically approved aptamer made of ssRNA molecules that effectively inhibits macular degeneration.21 With the aim of creating a more effective tool for cancer diagnosis, we considered human epidermal growth factor receptor 2 (HER2) as a target cancer marker protein.
HER2, also known as ErbB2, Neu, CD340 or P185 is a transmembrane tyrosine kinase receptor and a member of the epidermal growth factor receptor (EGFR or ErbB) family. Overexpression of ∼20–30% HER2 is shown to be associated with aggressive breast cancer cases.22 The overexpression of HER2 levels is also linked to other cancers, including ovarian, lung, gastric, and oral.22,23 Therefore, it is imperative to monitor HER2 levels to enable early cancer diagnosis. Existing methods for detecting HER2 are based on expensive biopsies followed by conducting immunohistochemistry (IHC) and fluorescence in situ hybridization (FISH) techniques for detecting HER2 protein levels.24,25 Synthetic tyrosine kinase inhibitors such as erlotinib and gefitinib as well as monoclonal antibodies, such as cetuximab and trastuzumab, have been developed to inhibit pathological signaling or to recruit the immune system against cancer cells.26,27
Targeting HER2 with low molecular weight kinase inhibitors has established this family of receptors as an effective target for novel drugs. Thus, therapeutic use of anti-HER2 aptamers is a promising alternative to monoclonal antibodies and kinase inhibitors for clinical applications, mainly because of their relatively low production cost as well as low batch-to-batch variability.27 Anti-HER2 aptamers have been increasingly developed that have high affinity and specificity to HER2, and these have been shown to inhibit proliferation of cultured cancer cells.28–32 Nevertheless, there is still a need for developing new aptamer variants against cancer biomarkers that can potentially serve as inhibitory agents for cancer diseases. Determination of increased HER2 protein levels in human serum is an alternative approach of utilizing such aptamers in combination with CNT structures so as to enable the treatment of cancer in its early stages and the effective prevention of traumatic events.
In this paper, we first hypothesize an in vitro delivery system which utilizes CNTs that carry anti-HER2 aptamers and release specifically when the target HER2 protein is supplied in the synthetic medium. This hypothesis was experimentally tested by first selecting a specific anti-HER2 aptamer using the SELEX process. The selected anti-HER2 aptamer was packed around CNTs by physical wrappings that had in turn been previously coupled with MBs. These heterogeneous structures were employed to demonstrate the specific dissociation of anti-HER2 aptamers, which was induced by their strong affinity toward HER2 protein. This feature is most desirable for a ligand molecule to qualify for potential targeted drug-delivery application under in vivo conditions.
2. Experimental
2.1 In vitro selection of ssDNA aptamers that bind HER2
![[thin space (1/6-em)]](https://www.rsc.org/images/entities/char_2009.gif) :
:![[thin space (1/6-em)]](https://www.rsc.org/images/entities/char_2009.gif) 10 diluted human serum (male; blood type, AB+; PANTM Biotech GmbH) in 1× binding buffer (100 mM NaCl, 20 mM Tris–HCl pH 7.6, 2 mM MgCl2, 5 mM KCl, 1 mM CaCl2, 0.02% Tween 20) allowing removal of undesirable oligos, and this mixture containing random, free ssDNA pool (pool 3) was finally utilized for the SELEX process.
10 diluted human serum (male; blood type, AB+; PANTM Biotech GmbH) in 1× binding buffer (100 mM NaCl, 20 mM Tris–HCl pH 7.6, 2 mM MgCl2, 5 mM KCl, 1 mM CaCl2, 0.02% Tween 20) allowing removal of undesirable oligos, and this mixture containing random, free ssDNA pool (pool 3) was finally utilized for the SELEX process.
The HER2 protein-bound sequences were eluted, purified and amplified by symmetric/asymmetric PCR using the forward primer, 5′-fluorescein-GGGCCGTTCGAACACGAGCATG-3′ (F1) and the reverse primer, 5′-GGACAGTACTCAGGTCATCCTAGG-3′ (R1). Amplified PCR product (dsDNA) carrying the aptamer sequence was labelled fluorescently during the PCR reaction, and was extracted after resolving on 2% agarose gel followed by purification using a gel extraction kit (QIAquick, Qiagen). Purified dsDNA was further resolved by denaturation polyacrylamide gel electrophoresis (PAGE, 12%), using 7 M urea containing 20% formamide, and isolation of the target fluorescent ssDNAs by gel excision followed by extraction using a PAGE gel extraction kit (Qiaex II). Obtained ssDNAs were measured using a Nanodrop spectrophotometer (Thermo Scientific) and applied as the isolated ssDNA fraction in the next selection round, as the starting pool. The above process was repeated for at least 12 cycles of selection, each comprising a series of steps as illustrated in Fig. S1.† An optimized PCR program was used to amplify the HER2-bound ssDNAs as follows: initial 15 min denaturation at 95 °C, 35–40 cycles of 30 s denaturation at 94 °C, 30 s annealing at 53 °C and 30 s amplification at 72 °C, respectively, with a final extension step at 72 °C for 10 min. The final pool of selected aptamers was cloned using a TOPO-TA cloning kit (Invitrogen) and sequenced. The secondary structure prediction of the aptamer sequences was evaluated using m-fold web server (utilizes free energy minimizing algorithm) available at http://www.bioinfo.rpi.edu/applications/mfold.34 As a result, 7 positive clones designated as H1–H7 were obtained, from which one of the aptamers, H2, was selected for further studies. All experimental methods related to the cloning and screening of positive clones are described in the ESI section.†
2.2 In vitro assay for affinity displacement/dissociation of anti-HER2 aptamers
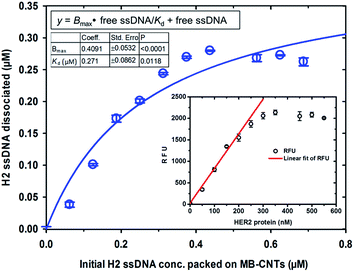
| y = Bmax × free ssDNA/Kd + free ssDNA | (1) |
3. Results and discussion
3.1 In vitro selection of anti-HER2 aptamers
Anti-HER2 aptamers were selected in vitro through directed selection by combinatorial screening of random library of ∼1015 ssDNA using the SELEX technique. As a result, seven aptamer candidates were evolved that bound to HER2 protein in a complex human serum medium. The sequences of the seven selected aptamers (H1–H7) are listed in Table S1.† The binding preference of an aptamer is important for its application as a targeting ligand. An ideal tumor-targeting aptamer should bind to the target molecule with minimal binding to other proteins. Here, we found that the H2 sequence evolved multiple times within the window of <50–60 nucleotides from the SELEX process compared with the other aptamer candidates, indicating its strong preference towards binding to HER2 protein. Since albumin is the most abundant protein in blood, we spiked HER2 protein in 1![[thin space (1/6-em)]](https://www.rsc.org/images/entities/char_2009.gif) :
:![[thin space (1/6-em)]](https://www.rsc.org/images/entities/char_2009.gif) 10 diluted human serum as a background component for in vitro selection and binding studies. The anti-HER2 aptamer (H2) chosen in this study also had a most stable confirmation due to its double strandedness, because of its more negative ΔG value, after H1, from among the seven aptamer candidates.34 The calculated ΔG with the following H2 sequence—5′-GGGCCGTCGAACACGAGCATG
10 diluted human serum as a background component for in vitro selection and binding studies. The anti-HER2 aptamer (H2) chosen in this study also had a most stable confirmation due to its double strandedness, because of its more negative ΔG value, after H1, from among the seven aptamer candidates.34 The calculated ΔG with the following H2 sequence—5′-GGGCCGTCGAACACGAGCATG![[G with combining low line]](https://www.rsc.org/images/entities/char_0047_0332.gif)
![[T with combining low line]](https://www.rsc.org/images/entities/char_0054_0332.gif)
![[G with combining low line]](https://www.rsc.org/images/entities/char_0047_0332.gif)
![[C with combining low line]](https://www.rsc.org/images/entities/char_0043_0332.gif)
![[G with combining low line]](https://www.rsc.org/images/entities/char_0047_0332.gif)
![[T with combining low line]](https://www.rsc.org/images/entities/char_0054_0332.gif)
![[G with combining low line]](https://www.rsc.org/images/entities/char_0047_0332.gif)
![[G with combining low line]](https://www.rsc.org/images/entities/char_0047_0332.gif)
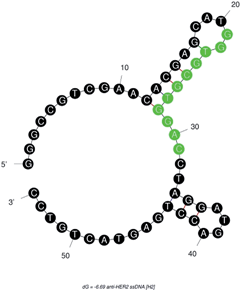
![[A with combining low line]](https://www.rsc.org/images/entities/char_0041_0332.gif) CCTAGGATGACCTGAGTACTGTCC-3′ (M.W. = 16.72 kDa)—was −6.69 kcal mole−1. This result indicated that the single strandedness of the aptamer was able to spontaneously transform into its most stable double stranded structure (Fig. 1). The predicted secondary structure of H2 showed two stem-loops and the random sequence was found to be located in its major stem-loop structure, which was predicted to be the binding site for HER2 protein (Fig. 1).
CCTAGGATGACCTGAGTACTGTCC-3′ (M.W. = 16.72 kDa)—was −6.69 kcal mole−1. This result indicated that the single strandedness of the aptamer was able to spontaneously transform into its most stable double stranded structure (Fig. 1). The predicted secondary structure of H2 showed two stem-loops and the random sequence was found to be located in its major stem-loop structure, which was predicted to be the binding site for HER2 protein (Fig. 1).
3.2 In vitro affinity dissociation of anti-HER2 aptamers
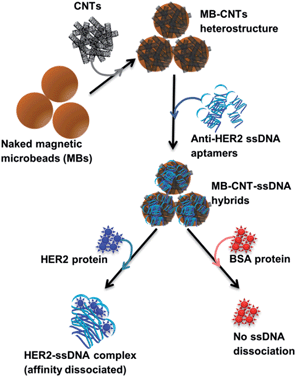
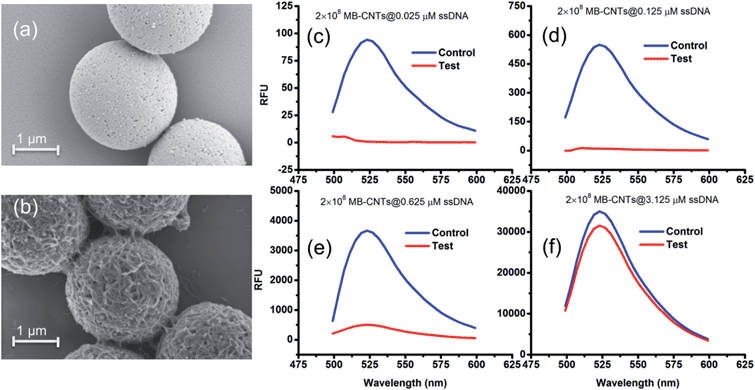
A new assay scheme was designed for testing in vitro HER2-induced displacement or delivery of the anti-HER2 aptamer (H2), in order to determine its stoichiometric binding or release with respect to the H2-to-HER2 protein ratio. Interaction of DNA and CNTs facilitates formation of supramolecular complexes37 and such interactions have been shown to adhere tightly, and to form a uniform and stable film that has been exploited for useful applications.38 Here, CNTs were employed as cargos (matrix) for carrying H2 ssDNAs that were coated on MBs so as to form heterostructures for testing HER2 target protein-induced displacement (affinity dissociation) in the medium (Scheme 1).A heterogenous matrix made of CNTs decorated on MBs was confirmed by SEM examination. Fig. 2a and b shows SEM images of MBs before and after uniform layer coating with CNTs. A small increase in the size of dynabeads was observed after coating with CNTs, as seen in Fig. 2b. The H2 ssDNAs were then allowed to tightly pack by physical wrapping on CNTs as described in the Experimental section. Binding of fluorescein-labelled H2 on MB–CNTs was examined by measuring the fluorescence intensity at 523 nm that showed diminishing fluorescence in the reaction supernatant as a result of strong H2–CNT interactions compared with the control. The diminishing of fluorescence can be attributed to strong physical wrapping of ssDNAs on CNTs present on MBs. Further, wrapping of ssDNAs on CNT structures was confirmed by FTIR spectra (Fig. S2†). The extent of H2 adsorption or loading capacity with 2.8 × 108 MB–CNTs was determined to be in the range 0.025–3.125 μM H2 until reaching a saturation point (Fig. 2c–f).
3.3 Stability of MB–CNT–H2 hybrid structures
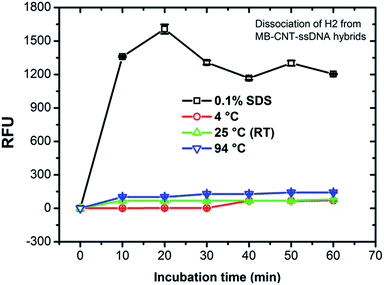
MB–CNT–H2 hybrid structures were subjected to stability tests by thermal and chemical denaturation. The released fluorescence intensities at 523 nm were measured for dissociation of CNT-wrapped ssDNAs at varying temperatures from 4 to 94 °C for 1 h. Fluorescence emission profiles of H2 released from MB–CNT–ssDNA hybrids against varying temperatures with time showed that no significant unwrapping of ssDNAs occured from CNT–ssDNAs hybrid structures at temperatures 4–94 °C (ESI,†Fig. 3). However, a partial dissociation of ssDNAs from hybrid structures did occur but only with 0.1% SDS, probably due to surfactant-induced unfolding or unwrapping of ssDNAs. It is clear from the above results that the ssDNAs were tightly wrapped on MB–CNTs, which required a strong surfactive agent such as SDS to dissociate them from CNTs.3.4 In vitro HER2 protein-induced affinity release of H2 from MB–CNT–H2 (cargos)
Competitive stoichiometric dissociation of H2 ssDNAs was initially postulated to occur by the influence of HER2 protein in the reaction mixture as schematically illustrated in Scheme 1. This hypothesis was tested by allowing interaction of HER2 protein with MB–CNT–ssDNA hybrid structures (cargos). Dissociation because of the strong binding affinity of H2 toward HER2 protein was therefore determined using a series of MB–CNT–ssDNA hybrid structures (1–5 × 10⁷) loaded with 0.05–0.3 μM H2 ssDNAs. These hybrid structures were incubated with a constant 300 nM pure and carrier-free form of HER2 protein. HER2 protein-induced dissociation of H2 was evidenced from MB–CNT–ssDNA hybrids, which was dose-dependent and accompanied by an increase in fluorescence intensity (Fig. 4). The reaction supernatant contained the H2 ssDNA–HER2 protein complex; this exhibited a fluorescence property because of the fluorescein dye at its 5′-end that did not quench, as opposed to that seen with QD-conjugated H2 in dot-blot assays. As the number of MB–CNT–ssDNA conjugates increased, H2 binding with HER2 increased as well, until reaching a saturation point (Fig. 4).The H2 ssDNA corresponding to the RFU values were fitted using non-linear regression analysis, and the dissociation constant (Kd) according to one-site binding was calculated to be 270 nM with 300 nM HER2 protein present in the reaction mixture. This result indicated that an approximate 1![[thin space (1/6-em)]](https://www.rsc.org/images/entities/char_2009.gif) :
:![[thin space (1/6-em)]](https://www.rsc.org/images/entities/char_2009.gif) 1 stoichiometric molecular binding occurred with ssDNA-to-HER2 protein. Similar 1
1 stoichiometric molecular binding occurred with ssDNA-to-HER2 protein. Similar 1![[thin space (1/6-em)]](https://www.rsc.org/images/entities/char_2009.gif) :
:![[thin space (1/6-em)]](https://www.rsc.org/images/entities/char_2009.gif) 1 stoichiometric binding with EGF and EGFR was reported by another research group.39 Further, a dynamic detection range of 50–250 nM was established using the measured RFU values corresponding to HER2 protein that exhibited a limit of detection of 38 nM (47.5 ng/10 μL sample volume) of HER2 protein (Fig. 4). This range is comparable to previously reported studies.40
1 stoichiometric binding with EGF and EGFR was reported by another research group.39 Further, a dynamic detection range of 50–250 nM was established using the measured RFU values corresponding to HER2 protein that exhibited a limit of detection of 38 nM (47.5 ng/10 μL sample volume) of HER2 protein (Fig. 4). This range is comparable to previously reported studies.40
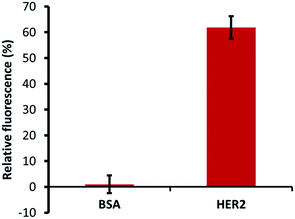
The specific ability of H2 binding with HER2 protein was confirmed by specificity tests using a constant number of MB–CNT–ssDNAs incubated against each protein (HER2/BSA) at equimolar concentrations that showed no non-specific displacement of H2 occurred against BSA protein (Fig. 5). The methods employed in this study therefore hold an advantage of H2 ssDNA binding with HER2 protein in its native and free forms, which is most desirable in clinical diagnosis, thus making the developed assay a simple and rapid tool for specific and accurate biomarker detection.
4. Conclusions
The present study provides a unique strategy to target HER2 protein for the detection of protein biomarkers in the context of cancer diagnosis or therapy using anti-HER2 aptamers. HER2 is overexpressed in many tumors, providing binding sites that can be directly accessible to aptamers from circulating blood. The high affinity and specificity of aptamers with HER2 protein from tumor cells are useful targets for the sensitive and accurate diagnosis of various types of cancers. In this study, H2 anti-HER2 aptamer was selected in vitro and employed on the basis of its ability to effectively bind to HER2 protein in the complex human serum environment. This method did not require any additional chemical reagents, enabling detection of HER2 protein in its native forms in human serum and thus making it a highly preferred method in clinical diagnosis.Use of CNTs for targeted delivery is a significant development in the field of therapeutic nanomedicine or cancer diagnosis for targeting cells that abundantly express HER2 protein. The strategy of target-induced affinity dissociation is a promising alternative to existing technologies for cancer diagnosis or therapy. Therefore, a unique in vitro method was developed aimed at testing MB–CNTs as cargos of H2 ssDNAs. These cargos were loaded with calculated amounts of fluorescently labelled anti-HER2 aptamer (H2) and successfully tested for its ability for programmable release, which was influenced by the presence of abundant HER2 protein in the medium. This strategy can potentially be explored in in vivo models for anti-HER2 aptamers as inhibitory drug-delivery systems. Our study demonstrated that the aptamer-mediated cancer diagnosis could be explored further as anti-HER2 therapy or detection of HER2 levels in serum.
Acknowledgements
This work was supported by the Scientific and Technological Research Council of Turkey (TUBITAK; grant no. 110E287) for JHN. We thank Ashish Pandey, Irena Roci, and Lisa Elif Archibald for their assistance with SEM analysis, aptamer selection, and binding assays, respectively.Notes and references
- Y. Fukumori and H. Ichikawa, Adv. Powder Technol., 2006, 17, 1–28 CrossRef CAS PubMed.
- J. K. Vasir and V. Labhasetwar, Adv. Drug Delivery Rev., 2007, 59, 718–728 CrossRef CAS PubMed.
- A. H. Faraji and P. Wipf, Bioorg. Med. Chem., 2009, 17, 2950–2962 CrossRef CAS PubMed.
- M. Prato, K. Kostarelos and A. Bianco, Acc. Chem. Res., 2007, 41, 60–68 CrossRef PubMed.
- S. R. Mane, V. Rao, N. K. Chaterjee, H. Dinda, S. Nag, A. Kishore, J. Das Sarma and R. Shunmugam, Macromolecules, 2012, 45, 8037–8042 CrossRef CAS.
- H. Zhou, W. Yu, X. Guo, X. Liu, N. Li, Y. Zhang and X. Ma, Biomacromolecules, 2010, 11, 3480–3486 CrossRef CAS PubMed.
- A. G. Tkachenko, H. Xie, D. Coleman, W. Glomm, J. Ryan, M. F. Anderson, S. Franzen and D. L. Feldheim, J. Am. Chem. Soc., 2003, 125, 4700–4701 CrossRef CAS PubMed.
- J. Song, J. Zhou and H. Duan, J. Am. Chem. Soc., 2012, 134, 13458–13469 CrossRef CAS PubMed.
- C. Wang, C. Wu, X. Zhou, T. Han, X. Xin, J. Wu, J. Zhang and S. Guo, Sci. Rep., 2013, 3, 2852 Search PubMed.
- S.-R. Ji, C. Liu, B. Zhang, F. Yang, J. Xu, J. Long, C. Jin, D.-L. Fu, Q.-X. Ni and X.-J. Yu, Biochim. Biophys. Acta, Rev. Cancer, 2010, 1806, 29–35 CrossRef CAS PubMed.
- R. P. Feazell, N. Nakayama-Ratchford, H. Dai and S. J. Lippard, J. Am. Chem. Soc., 2007, 129, 8438–8439 CrossRef CAS PubMed.
- D. Pantarotto, J.-P. Briand, M. Prato and A. Bianco, Chem. Commun., 2004, 16–17 RSC.
- N. W. S. Kam and H. Dai, J. Am. Chem. Soc., 2005, 127, 6021–6026 CrossRef CAS PubMed.
- Y. Liu, D. C. Wu, W. D. Zhang, X. Jiang, C. B. He, T. S. Chung, S. H. Goh and K. W. Leong, Angew. Chem., 2005, 117, 4860–4863 CrossRef.
- N. W. S. Kam, Z. Liu and H. Dai, J. Am. Chem. Soc., 2005, 127, 12492–12493 CrossRef CAS PubMed.
- S. M. Taghdisi, P. Lavaee, M. Ramezani and K. Abnous, Eur. J. Pharm. Biopharm., 2011, 77, 200–206 CrossRef CAS PubMed.
- N. W. S. Kam, Z. Liu and H. Dai, Angew. Chem., 2006, 118, 591–595 CrossRef.
- R. Stoltenburg, C. Reinemann and B. Strehlitz, Biomol. Eng., 2007, 24, 381–403 CrossRef CAS PubMed.
- E. M. Reyes-Reyes, Y. Teng and P. J. Bates, Cancer Res., 2010, 70, 8617–8629 CrossRef CAS PubMed.
- K.-T. Guo, G. Ziemer, A. Paul and H. P. Wendel, Int. J. Mol. Sci., 2008, 9, 668–678 CrossRef CAS PubMed.
- E. W. Ng, D. T. Shima, P. Calias, E. T. Cunningham Jr, D. R. Guyer and A. P. Adamis, Nat. Rev. Drug Discovery, 2006, 5, 123–132 CrossRef CAS PubMed.
- D. J. Slamon, W. Godolphin, L. A. Jones, J. A. Holt, S. G. Wong, D. E. Keith, W. J. Levin, S. G. Stuart, J. Udove and A. Ullrich, Science, 1989, 244, 707–712 CAS.
- M.-C. Hung, A. Matin, Y. Zhang, X. Xing, F. Sorgi, L. Huang and D. Yu, Gene, 1995, 159, 65–71 CrossRef CAS.
- M. Milburn, M. Rosman, W. C. Mylander, W. Liang, J. Hooke and A. Kovatich, Ann. Surg. Oncol., 2011, 18, S176 Search PubMed.
- M. Arnedos, A. Nerurkar, P. Osin, R. A'Hern, I. E. Smith and M. Dowsett, Ann. Oncol., 2009, 20, 1948–1952 CrossRef CAS PubMed.
- F. Ciardiello and G. Tortora, N. Engl. J. Med., 2008, 358, 1160–1174 CrossRef CAS PubMed.
- G. Mahlknecht, R. Maron, M. Mancini, B. Schechter, M. Sela and Y. Yarden, Proc. Natl. Acad. Sci. U. S. A., 2013, 110, 8170–8175 CrossRef CAS PubMed.
- G. C. Shao, J. Wang, Z. H. Li, L. Saraf, W. J. Wang and Y. H. Lin, Sens. Actuators, B, 2011, 159, 44–50 CrossRef CAS PubMed.
- K. Dastjerdi, G. H. Tabar, H. Dehghani and A. Haghparast, Biotechnol. Appl. Biochem., 2011, 58, 226–230 CrossRef CAS PubMed.
- C. L. Esposito, D. Passaro, I. Longobardo, G. Condorelli, P. Marotta, A. Affuso, V. de Franciscis and L. Cerchia, PloS One, 2011, 6, e24071 CAS.
- M. Y. Kim and S. Jeong, Nucleic Acid Ther., 2011, 21, 173–178 CrossRef CAS PubMed.
- B. C. Chi-hong, G. A. Chernis, V. Q. Hoang and R. Landgraf, Proc. Natl. Acad. Sci. U. S. A., 2003, 100, 9226–9231 CrossRef PubMed.
- R. Stoltenburg, C. Reinemann and B. Strehlitz, Anal. Bioanal. Chem., 2005, 383, 83–91 CrossRef CAS PubMed.
- M. Zuker, Nucleic Acids Res., 2003, 31, 3406–3415 CrossRef CAS PubMed.
- H. Ünal and J. H. Niazi, J. Mater. Chem. B, 2013, 1, 1894–1902 RSC.
- M. Müller, J. E. Weigand, O. Weichenrieder and B. Suess, Nucleic Acids Res., 2006, 34, 2607–2617 CrossRef PubMed.
- M. Zheng, A. Jagota, E. D. Semke, B. A. Diner, R. S. Mclean, S. R. Lustig, R. E. Richardson and N. G. Tassi, Nat. Mater., 2003, 2, 338–342 CrossRef CAS PubMed.
- C. G. Hu, Y. Y. Zhang, G. Bao, Y. L. Zhang, M. L. Liu and Z. L. Wang, J. Phys. Chem. B, 2005, 109, 20072–20076 CrossRef CAS PubMed.
- P. J. Brennan, T. Kumogai, A. Berezov, R. Murali and M. I. Greene, Oncogene, 2000, 19, 6093–6101 CrossRef CAS PubMed.
- J. T. Gohring, P. S. Dale and X. D. Fan, Sens. Actuators, B, 2010, 146, 226–230 CrossRef CAS PubMed.
Footnote |
| † Electronic supplementary information (ESI) available: Fig. S1 illustrating the SELEX process, FTIR spectra of MB-CNTs and MB-CNTs-ssDNAs (Fig. S2), and list of aptamer variants (sequences) evolved to bind against HER2 protein after the SELEX process. See DOI: 10.1039/c4an01665c |
| This journal is © The Royal Society of Chemistry 2015 |

