A netlike rolling circle nucleic acid amplification technique†
Xiaoli
Zhu
a,
Chang
Feng
a,
Bin
Zhang
a,
Hui
Tong
a,
Tao
Gao
b and
Genxi
Li
*ab
aLaboratory of Biosensing Technology, School of Life Sciences, Shanghai University, Shanghai 200444, P R China
bState Key Laboratory of Pharmaceutical Biotechnology, Department of Biochemistry, Nanjing University, Nanjing 210093, P R China. E-mail: genxili@nju.edu.cn
First published on 4th November 2014
Abstract
A nucleic acid amplification technique termed as netlike rolling circle amplification is proposed by introducing a nicking enzyme into the existing hyperbranched rolling circle amplification system. Surprisingly dense and uniform network morphology is observed; and cubic amplification is achieved for the sensitive detection of a sequence from HIV.
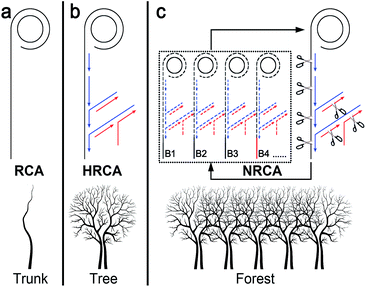
Rolling circle amplification (RCA) is one of the most commonly used isothermal amplification technologies.1 It utilizes circular single-stranded DNA probes as everlasting templates for DNA polymerization to generate multiple single-stranded linear copies of the original DNA in a continuous head-to-tail series. The first generation of RCA also known as linear RCA (LRCA) results in linear growth of the products with up to several thousand fold amplification (Scheme 1a). Subsequently, several modified RCA techniques have been developed to improve the amplification efficiency.1a,2 The most representative one is the hyperbranched rolling circle amplification (HRCA), also referred to as ramification amplification RCA.1a,2b–d,g In addition to the linear extension around the circular probes, strand displacement and ramified extension proceed simultaneously in HRCA by adopting a second reverse primer (Scheme 1b). As a result, quadratic (also known as exponential) amplification is achieved with the amplification increasing a million fold, which may rival PCR.
With demand for the detection of ultra-trace level nucleic acids like microRNA, pathogenic DNA, and mutation in cancer cells, growing, higher amplification is greatly and even urgently required. Here, by introducing a nicking enzyme into the HRCA system, we have developed a novel netlike rolling circle amplification (NRCA) technique (Scheme 1c). Under the catalysis of a nicking enzyme, the tree structure of HRCA are scissored into branches (short ssDNA segments), which subsequently work as seeds (probes) for the growth of other HRCA trees. The process is similar to the method of plant breeding using cuttage. Thus, a cascade of primer extension, strand displacement, and nicking reactions is integrated in a tube to achieve cubic amplification (Scheme 1c). In contrast to the linear amplification of LRCA and the quadratic amplification of HRCA, the cubic amplification of NRCA shows ultrahigh efficiency without sacrificing the time, labor, and cost required. The overlap of the NRCA product may finally result in a netlike or forest structure, while in the case of LRCA and HRCA, the corresponding structure is just like a trunk and a tree, respectively. The network of NRCA has been verified with atomic force microscopic imaging. As far as we know, this is the first report of dense and uniform network morphology from isothermal nucleic acid amplification. Sensitive detection of HIV-1 DNA and even single-nucleotide polymorphism (SNP) has also been achieved by adopting this NRCA technique.
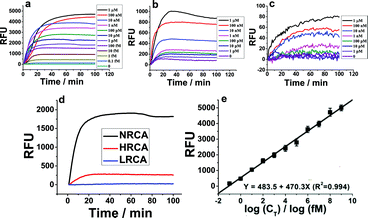
The experimental details including the sequences of the adopted oligonucleotides and the optimization of the experimental conditions are shown in the ESI (Table S1, Fig. S1 and S2†). Since amplification efficiency is the most important evaluation index of a nucleic acid amplification technique, comparison of the amplification efficiency of NRCA with LRCA and HRCA is first conducted. In the case of a relatively high concentration of the primer DNA (primer 1, 10 nM–200 nM), agarose gel electrophoretic results of the products of RCAs (NRCA and HRCA) clearly show that NRCA has higher amplification efficiency (Fig. S3, ESI†). While the concentration is further increased to 1 μM, no remarkable difference is observed maybe owing to the saturation of both amplified products. Electrophoresis is visible but not sensitive enough. So, we have also conducted real-time monitoring of the fluorescent signals of NRCA as well as HRCA and LRCA by using a real-time PCR detection system. As shown in Fig. 1a–c, the fluorescent signals increase along with the increasing concentration of the primer 1 in all three cases. However, the magnitudes of growth differ apparently with a gradient NRCA > HRCA > LRCA. Because the comparison of amplification efficiency under a low concentration is more meaningful for practical applications, we pick the curves of 1 pM of primer 1 to show the differences (Fig. 1d). The stable fluorescent signals of NRCA, HRCA and LRCA for the amplification of 1 pM of primer 1 reach 1848, 137, and a negligible quantity, respectively, showing a greatly different amplification efficiency. Certainly, the result of LRCA may not reflect the real amplification efficiency, since the products of LRCA are linear single-stranded DNA and the non-specific fluorescent dye SYBR Green I intercalates mostly with double-stranded DNA. Nevertheless, the huge gap between NRCA and HRCA still makes sense.
In addition to the high amplification efficiency of NRCA, we also find that the fluorescent signals of NRCA have a log-linear correlation with the concentration of primer 1 over a very large range from 0.1 fM to 1 μM (Fig. 1e). The correlation equation is Y = 483.5 + 470.3X (R2 = 0.994). Therefore, the NRCA technique proposed in this work may be employed for the sensitive analysis of genetic fragments.
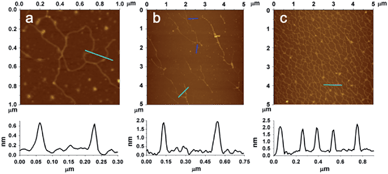
Atomic force microscope (AFM) is a powerful tool for the visualization of bio-macromolecules with nanometer resolution. It has been successfully adopted for the observation of the products of LRCA.3 Unfortunately, the visualization of some other derivatives of RCA including HRCA has not been achieved. In this work, we have employed AFM to successfully characterize the morphology of the products of our NRCA together with LRCA and HRCA for comparison. As expected, the AFM images show that the products of LRCA, HRCA and NRCA present corresponding linear, hyperbranched, and netlike appearances, respectively (Fig. 2). This is the first time that the morphology of RCA products, other than those with linear appearance, have been directly observed. It also worth noting that the network of NRCA is very dense, suggesting the massive amplification with ultrahigh efficiency. In addition, the network of NRCA is also observed to be surprisingly uniform, so it may also have the potential to be applied as self-assembled scaffolds in the field of DNA materials science.3,4 By measuring the height of the DNA (the underside of Fig. 2), we have also found that the height of the products of HRCA and NRCA is about 2 nm, characteristic of dsDNA.5 As for LRCA, the height is about 0.7 nm, suggesting the production of ssDNA.4d So, these results further confirm the principle of our NRCA technique proposed in this study.
While in use, the RCA technique is usually combined with a padlock probe, i.e., a linear DNA probe that becomes circularized upon recognition of a target nucleic acid sequence.6 The target-binding region of the padlock probe is equally split into two segments placed in opposite orientation at the 5′- and 3′-ends. When hybridized head-to-tail with the target DNA, the ends are positioned adjacent to each other and are sealed by DNA ligase, resulting in a circular probe with two ends connected. Any non-circularized probe as well as the target DNA is removed by exonuclease (Exo) treatment, while the circularized probe may participate in the RCA system subsequently.7 It is also reported that the step of Exo treatment can be skipped, since the non-circularized probe cannot serve as the template for continuous extension.8 Here, the padlock probe is combined with our NRCA system to detect a 21-mer ssDNA from the HIV-1 U5 long terminal repeat (LTR) sequence. The schematic illustration of the well-designed padlock probe is shown in Scheme 2. Strategies either with or without Exo treatment are conducted, which are also illustrated in Scheme 2.
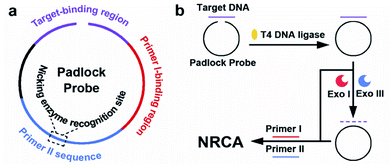 | ||
| Scheme 2 Schematic illustration of (a) the functional regions of the padlock probe, (b) the principle of the padlock probe-based NRCA for the detection of the target. | ||
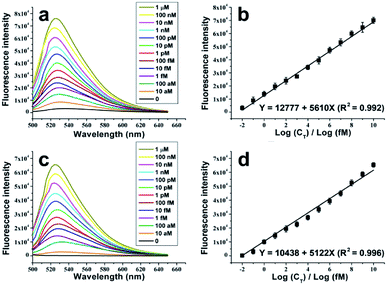
Fluorescence spectrum analysis, which is more sensitive than real-time PCR in the acquisition of fluorescent signals, is adopted as the detection tool. As is shown in Fig. 3a and c, with or without Exo treatment, the fluorescence intensities of the dye-intercalated NRCA products increase remarkably with the increase of the concentrations of the target DNA. In both cases, the relationship between the fluorescence intensities and the logarithm of the concentrations of the target DNA can be linearly fitted (Fig. 3b and d). The fitting equations are shown as follows:
| Y = 12777 + 5610X (R2 = 0.992) (no Exo treatment) |
| Y = 10438 + 5122X (R2 = 0.996) (Exo treatment) |
The detection limits reach 5.4 aM (ca. 65 molecules, S/N = 3, no Exo treatment) and 9.3 aM (ca. 112 molecules, S/N = 3, Exo treatment), respectively. The small variation with and without Exo treatment may be ascribed to the fact that Exo treatment reduces the circular probe-independent polymerization (e.g., polymerization using linear probe as the template), and consequently results in the slight depression of the fluorescent signals and the sensitivity. The detection ranges both expand from 10 aM to 1 μM, a range across twelve orders of magnitude. Therefore, successful detection of the target DNA with outstanding performance is achieved.
Non-specific amplification is one major problem of the currently used amplification techniques. It is very interesting that the specific amplification of our NRCA technique is much better than that of HRCA. While in the detection of HIV-1 DNA, a clear discrimination of even SNP is achieved.
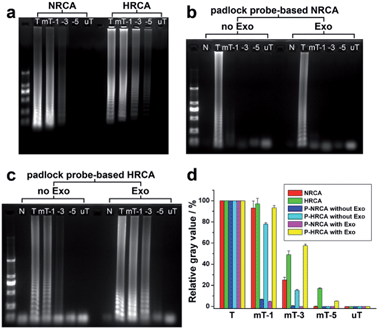
Fig. 4a shows the comparison of NRCA with HRCA by using primer 1 as well as its mutant variants. Taking a 5-bases mutation of the primer 1 (mP-5) for instance, no ladder-like band is observed for NRCA whereas shallow bands still exist in the case of HRCA. We have also studied the differences in detail through the image analysis of the gray value of the bands using Photoshop and ImageJ software. For NRCA, the gray values of 1-base, 3-bases, and 5-bases mutations of primer 1 (mP-1, mP-3, and mP-5) decrease by 7%, 75%, and 100%, respectively, in comparison with that of primer 1 (the gray value of the background has been subtracted) (red columns in Fig. 4d). As for HRCA, the decline is 3%, 51%, and 83%, respectively (green columns in Fig. 4d). The enhanced specificity of NRCA may be owing to the superimposition of the specificity of both the polymerase and the nicking enzyme.
As for the detection of the target HIV-1 DNA using padlock probe, the specificity of the padlock probe-based NRCA (P-NRCA) system is further improved. As seen in Fig. S4 (ESI†) the target-dependent circularization of the padlock probe (i.e., the ligase-based ligation reaction) has certain specificity. No circular probe can be formed when a 5-base mutation of the target DNA (mT-5) or a totally unmatched variant (uT) instead of the target DNA is adopted (Fig. S5, ESI†). However, the specificity is not enough for SNP discrimination, since a little amount of circular probe still forms in the case of 1-base or 3-base mutations of the target DNA (Fig. S5, ESI†). While the circularization of the padlock probe is combined with our NRCA, it is expected that the specificity of each part can be integrated to provide better performance. As is shown in Fig. 4b, regardless of the Exo treatment, a clear ladder-like band is observed only in the case of the target DNA, suggesting outstanding specificity for SNP discrimination. The gray value of the 1-base mutation of the target decreases by 93% and 96% for the absence and presence of Exo, respectively (Fig. 4d). When compared, if the circularization of the padlock probe is combined with HRCA, the improvement of the specificity is limited. The 3-bases mutation of the target DNA still cannot be well discriminated (Fig. 4c). Detection of single-nucleotide polymorphism has been widely reported.9 Nevertheless, the performances differ a lot, mainly in the discrimination of the signals of the target and the 1-base mutation. In our results, the signal intensity of the target is over 14 times stronger than that of the 1-base mutation (Fig. 4), suggesting a high performance over many reports.10
Finally, we would like to discuss the comparison of the NRCA technique with some existing amplification methods. (1) In contrast to the linear amplification of LRCA and the quadratic amplification of HRCA, the cubic amplification of our NRCA shows much higher amplification efficiency without sacrificing the usability. (2) Unlike some other cascade amplification strategies which need a step-by-step procedure,11 the three amplification reactions of NRCA (i.e., primer extension, strand displacement, and nicking reactions) proceed simultaneously in a tube. Thus, it also has advantages of time- and labor-saving. (3) It is noted that the group of Komiyama once developed a primer generation-rolling circle amplification (PG-RCA) technique.2a In their scheme, a nicking enzyme is also introduced. Nevertheless, nicking enzyme is used only as the basis of LRCA, so only primer extension and nicking reactions, without strand displacement, are integrated, thus quadratic amplification instead of cubic amplification can be achieved. So, the sensitivity of the PG-RCA technique is only comparable to HRCA. Comparing our NRCA with PG-RCA proposed by Komiyama et al., besides the gap between cubic amplification and quadratic amplification, NRCA also has the advantage of the production of dsDNA, which may facilitate the sensitive real-time fluorescent detection. (4) Besides the efforts on the development of various RCA techniques to improve amplification efficiency, the improvement of specificity is also of great importance. Our results have shown that NRCA may provide better specificity than HRCA. Moreover, when combined with the padlock probe for the practical detection of target DNA, the specificity of the whole P-NRCA system is further improved. Detection of SNP can be achieved with 25-fold difference in the amplification products between the target and the 1-base mutant variant. To our knowledge, few existing strategies for gene assays may reach such high amplification efficiency while achieving outstanding specificity at the same time.
The RCA technology has been widely used in the amplified detection of miRNA,8b gene sequences,11b DNA methylation,12 and the targets of nucleic acid aptamers.13 Various detection methods including fluorescence spectrometry, UV-vis spectrometry, and electrochemistry have also been adopted. Benefiting from the high performance and easy-operation of NRCA, rational design will no doubt further contribute to wide application of this novel RCA technique. On the other hand, it is noted that there are still some problems to be solved. For example, the mechanism of the effect of the buffer solutions is still unknown; whether other nicking enzymes can be adopted should be explored further; it is also unknown why the specificity of P-NRCA can be improved so much. So, a lot of work still lies ahead to make the mechanism clear and to expand the application.
Conclusions
In summary, we have proposed an NRCA technique in this work. Simply upon addition of a nicking enzyme into a well-established HRCA system, amplification of nucleic acid with super-high efficiency and outstanding specificity is achieved. It is the first time that RCA is upgraded from linear amplification (LRCA in 1995) and quadratic amplification (HRCA in 1998) to cubic amplification. In comparison with LRCA, HRCA, and some other existing DNA amplification strategies, the NRCA technique shows some obvious advantages. It has also been successfully applied for the detection of HIV-1 DNA with a detection limit lowered to 5.4 aM and a detection range extended from 10 aM to 1 μM. Moreover, dense and uniform network morphology of RCA products is observed for the first time, which validates the “netlike” and also does favour to the understanding of RCA technology.Acknowledgements
This work is supported by the National Science Fund for Distinguished Young Scholars (Grant no. 20925520), the National Natural Science Foundation of China (Grant nos 61001035, 21235003), the Innovation Program of Shanghai Municipal Education Commission (no. 12YZ004), and the Natural Science Foundation of Shanghai (14ZR1416500). Thanks to the Experimental Centre of Life Sciences of Shanghai University for providing AFM and real-time PCR apparatus.Notes and references
- (a) P. M. Lizardi, X. Huang, Z. Zhu, P. Bray-Ward, D. C. Thomas and D. C. Ward, Nat. Genet., 1998, 19, 225–232 CrossRef CAS PubMed; (b) A. Fire and S. Q. Xu, Proc. Natl. Acad. Sci. U. S. A., 1995, 92, 4641–4645 CrossRef CAS; (c) D. Liu, S. L. Daubendiek, M. A. Zillman, K. Ryanand and E. T. Kool, J. Am. Chem. Soc., 1996, 118, 1587–1594 CrossRef CAS PubMed; (d) W. Zhao, M. M. Ali, M. A. Brook and Y. Li, Angew. Chem., Int. Ed., 2008, 47, 6330–6337 CrossRef CAS PubMed.
- (a) T. Murakami, J. Sumaoka and M. Komiyama, Nucleic Acids Res., 2009, 37, e19 CrossRef PubMed; (b) D. Y. Zhang, M. Brandwein, T. Hsuih and H. B. Li, Mol. Diagn., 2001, 6, 141–150 CrossRef CAS PubMed; (c) D. Y. Zhang, M. Brandwein, T. Hsuih and H. B. Li, Gene, 1998, 211, 277–285 CrossRef CAS; (d) D. C. Thomas, G. A. Nardone and S. K. Randall, Arch. Pathol. Lab. Med., 1999, 123, 1170–1176 CAS; (e) F. B. Dean, J. R. Nelson, T. L. Giesler and R. S. Lasken, Genome Res., 2001, 11, 1095–1099 CrossRef CAS PubMed; (f) X. Qi, S. Bakht, K. M. Devos, M. D. Gale and A. Osbourn, Nucleic Acids Res., 2001, 29, E116 CrossRef CAS PubMed; (g) Y. Geng, J. Wu, L. Shao, F. Yan and H. Ju, Biosens. Bioelectron., 2014, 61, 593–597 CrossRef CAS PubMed; (h) W. Cheng, F. Yan, L. Ding, H. Ju and Y. Yin, Anal. Chem., 2010, 82, 3337–3342 CrossRef CAS PubMed; (i) H. Ji, F. Yan, J. Lei and H. Ju, Anal. Chem., 2012, 84, 7166–7171 CrossRef CAS PubMed.
- S. Beyer, P. Nickels and F. C. Simmel, Nano Lett., 2005, 5, 719–722 CrossRef CAS PubMed.
- (a) D. Han, S. Pal, Y. Liu and H. Yan, Nat. Nanotechnol., 2010, 5, 712–717 CrossRef CAS PubMed; (b) O. I. Wilner, R. Orbach, A. Henning, C. Teller, O. Yehezkeli, M. Mertig, D. Harries and I. Willner, Nat. Commun., 2011, 2, 540 CrossRef PubMed; (c) P. W. Rothemund, Nature, 2006, 440, 297–302 CrossRef CAS PubMed; (d) Y. Ma, H. Zheng, C. Wang, Q. Yan, J. Chao, C. Fan and S. J. Xiao, J. Am. Chem. Soc., 2013, 135, 2959–2962 CrossRef CAS PubMed; (e) G. D. Hamblin, K. M. M. Carneiro, J. F. Fakhoury, K. E. Bujold and H. F. Sleiman, J. Am. Chem. Soc., 2012, 134, 2888–2891 CrossRef CAS PubMed; (f) W. Zhao, M. M. Ali, M. A. Brook and Y. Li, Angew. Chem., Int. Ed., 2008, 47, 6330–6337 CrossRef CAS PubMed.
- (a) J. Mou, D. M. Czajkowsky, Y. Zhang and Z. Shao, FEBS Lett., 1995, 371, 279–282 CrossRef CAS; (b) H. G. Hansma, I. Revenko, K. Kim and D. E. Laney, Nucleic Acids Res., 1996, 24, 713–720 CrossRef CAS PubMed.
- M. Nilsson, H. Malmgren, M. Samiotaki, M. Kwiatkowski, B. P. Chowdhary and U. Landegren, Science, 1994, 265, 2085–2088 CAS.
- S. Kaocharoen, B. Wang, K. M. Tsui, L. Trilles, F. Kong and W. Meyer, Electrophoresis, 2008, 29, 3183–3191 CAS.
- (a) Y. Cheng, X. Zhang, Z. Li, X. Jiao, Y. Wang and Y. Zhang, Angew. Chem., Int. Ed., 2009, 48, 3268–3272 CrossRef CAS PubMed; (b) E. M. Harcourt and E. T. Kool, Nucleic Acids Res., 2012, 40, e65 CrossRef CAS PubMed.
- E. V. Bichenkova, Z. Lang, X. Yu, C. Roqert and K. T. Douqlas, Biochim. Biophys. Acta, 2011, 1809, 1–23 CrossRef CAS PubMed.
- (a) X. Wang, M. Zou, H. Huang, Y. Ren, L. Li, X. Yang and N. Li, Biosens. Bioelectron., 2013, 41, 569–575 CrossRef CAS PubMed; (b) M. L. Ermini, S. Mariani, S. Scarano and M. Minunni, Biosens. Bioelectron., 2014, 61, 28–37 CrossRef CAS PubMed; (c) J. Park, J. Lee, C. Ban and W. J. Kim, Biosens. Bioelectron., 2012, 43, 419–424 CrossRef PubMed.
- (a) N. Tomita, Y. Mori, H. Kanda and T. Notomi, Nat. Protoc., 2008, 3, 877–882 CrossRef CAS PubMed; (b) W. Xu, X. Xie, D. Li, Z. Yang, T. Li and X. Liu, Small, 2012, 8, 1846–1850 CrossRef CAS PubMed; (c) E. J. Cho, L. Yang, M. Levy and A. D. Ellington, J. Am. Chem. Soc., 2005, 127, 2022–2023 CrossRef CAS PubMed; (d) B. C. Yin, Y. Q. Liu and B. C. Ye, Anal. Chem., 2013, 85, 11487–11493 CrossRef CAS PubMed; (e) D. A. Selck, M. A. Karymov, B. Sun and R. F. Ismagilov, Anal. Chem., 2013, 85, 11129–11136 CrossRef CAS PubMed; (f) F. Dahl, J. Baner, M. Gullberg, M. Mendel-Hartviq, U. Landegren and M. Nilsson, Proc. Natl. Acad. Sci. U. S. A., 2004, 101, 4548–4553 CrossRef CAS PubMed.
- Y. p. Zeng, J. Hu, Y. Long and C. y. Zhang, Anal. Chem., 2013, 85, 6143–6150 CrossRef CAS PubMed.
- L. Wang, K. Tram, M. M. Ali, B. J. Salena, J. Li and Y. Li, Chem.–Eur. J., 2014, 20, 2420–2424 CrossRef CAS PubMed.
Footnote |
| † Electronic supplementary information (ESI) available. See DOI: 10.1039/c4an01711k |
| This journal is © The Royal Society of Chemistry 2015 |

