Repeatability and reproducibility of desorption electrospray ionization-mass spectrometry (DESI-MS) for the imaging analysis of human cancer tissue: a gateway for clinical applications†
Nima
Abbassi-Ghadi‡
a,
Emrys A.
Jones‡
a,
Kirill A.
Veselkov
a,
Juzheng
Huang
a,
Sacheen
Kumar
a,
Nicole
Strittmatter
a,
Ottmar
Golf
a,
Hiromi
Kudo
b,
Robert D.
Goldin
b,
George B.
Hanna
a and
Zoltan
Takats
*a
aDepartment of Surgery and Cancer, Imperial College London, 10th Floor QEQM Wing, St Mary's Hospital, London, W2 1NY, UK. E-mail: z.takats@imperial.ac.uk; Tel: +44 (0)207 5942760
bCentre for Pathology, Imperial College London, 4th Floor Clarence Wing, St Mary's Hospital, London, W2 1NY, UK
First published on 13th October 2014
Abstract
In this study, we aim to demonstrate the repeatability and reproducibility of DESI-MS for the imaging analysis of human cancer tissue using a set of optimal geometric and electrospray solvent parameters. Oesophageal cancer tissue was retrieved from four quadrants of a freshly removed tumor specimen, snap frozen, cryo-sectioned and mounted on glass slides for DESI-MS image acquisition. Prior to assessing precision, optimal geometric and electrospray solvent parameters were determined to maximize the number of detected lipid species and associated Total Ion Count (TIC). The same settings were utilized for all subsequent experiments. Repeatability measurements were performed using the same instrument, by the same operator on a total of 16 tissue sections (four from each quadrant of the tumor). Reproducibility measurements were determined in a different laboratory, on a separate DESI-MS platform and by an independent operator on 4 sections of one quadrant and compared to the corresponding measurements made for the repeatability experiments. The mean ± SD CV of lipid ion intensities was found to be 22 ± 7% and 18 ± 8% as measures of repeatability and reproducibility, respectively. In conclusion, DESI-MS has acceptable levels of reproducibility for the analysis of lipids in human cancer tissue and is suitable for the purposes of clinical research and diagnostics.
Introduction
Mass spectrometry imaging (MSI) can be used for spatially resolved analysis of ionised metabolites from biological tissue sections. The chemical information is often represented in the form of false colour images, that help the analyst to obtain metabolic profiles from histologically distinct areas, rather than extracting non-specific metabolites from blocks of heterogeneous tissue as is performed in analytical protocols involving tissue homogenization. Matrix assisted laser desorption ionization mass spectrometry (MALDI-MS), secondary ion mass spectrometry (SIMS) and desorption electrospray ionization mass spectrometry (DESI-MS) are common MSI techniques that have been used to investigate a range of diseases including cancer, neurological disorders and atherosclerosis.1–10DESI-MS is particularly suited at for the detection of lipids in biological tissue,9–11 which are defined as hydrophobic or amphiphilic low molecular weight molecules that originate mostly from biological membranes.12 Alterations in lipid metabolism in the cancer disease state has attracted significant scientific interest and has bolstered the new discipline of lipidomics, which is defined as the emerging field of systems-level analysis of lipids and factors that interact with lipids.13
In case of DESI-MS analysis, a pneumatically assisted electrospray comprising high-velocity charged liquid micro-droplets, molecular clusters and gaseous ions is directed at a surface. On the impact of micro-droplets, the surface is wetted and the solvent extracts analyte molecules into the liquid film temporarily present on the surface. The impact of incoming droplets results in the formation of secondary droplets departing from the surface. Given that the surface is electrically non-conductive, the secondary droplets will still carry net electric charge. Since the droplets already contain species dissolved from the surface, these species may undergo an electrospray-like ionization mechanism. The effective formation of gaseous ions usually takes place in the atmospheric interface of the mass spectrometer (MS).14 Due to their high abundance, limited solubility in aqueous solvent systems and the virtually zero desorption enthalpy (i.e. from the surface of electrically charged droplets) of ionization, lipids species are the dominant bio-molecular compound class detected by DESI-MS (and any other electrospray-like ionization methods). The ionization involves minimal fragmentation of the molecules, which improves the specificity of lipid identification in complex biological mixtures. Identification performance can be further enhanced by the application of high resolution/tandem mass spectrometry.
There have been questions regarding the analytical performance characteristics of DESI-MS including ion suppression effects (i.e. the degree that analytes suppress the ionization of other analytes present in the same sample) and overall yields (i.e. the fraction of the original material that is converted into gas-phase ions at the detector of the MS).14 Furthermore, fluctuations in the solvent composition/voltage, gas flow rate, solvent flow rate and geometric set-up can also cause variation within the obtained mass spectral datasets.15–19 Bias introduced by these factors may compromise the precision of the technique and as a consequence may hinder the translation of the technique to the level of routine clinical applications. The U.S. Food and Drug Agency (FDA) states that the co-efficient of variance (CV) of reproducibility should not exceed 20% for analytical techniques.20
In this study, we aim to demonstrate that by using a set of optimized geometric and electrospray parameters DESI-MS is capable of yielding highly repeatable spectral profiles of human cancer tissue on the same instrument and reproducible measurements performed by an independent operator using a different instrumental setup in a different laboratory.
Experimental section
Samples
Specimen retrieval and analysis was performed under an approved and institutional review board protocol, with informed written consent obtained by a licensed clinician. Tumor tissue obtained from a patient with oesophageal adenocarcinoma was chosen as the measurand for comparative analysis. In order to reduce biological variability affecting our measurements, we chose a macro/microscopically homogenous tumor with uniform histological characteristics. Samples were taken from each quadrant of the tumour after surgical resection of the oesophagus. The four tissue samples were stored at −80 °C prior to cryo-sectioning at 15 μm thickness using a Bright 5030 Cryotome (Bright Instruments, Cambridgeshire, UK) set at −20 °C, and thaw mounted onto SuperFrost® Plus Glass slides (Thermo Fisher Scientific Inc., USA). The slides were stored in closed containers at −80 °C and were allowed to thaw under nitrogen flow at room temperature for a standardized five minutes prior to DESI-MS analysis.Instrumentation
DESI-MS analysis was performed using an Exactive Fourier-transform Orbitrap mass spectrometer (Thermo Fisher Scientific Inc., Bremen, Germany) controlled by XCalibur 2.1 software and operated in negative ion mode. Data was acquired at a nominal mass resolution of 100![[thin space (1/6-em)]](https://www.rsc.org/images/entities/char_2009.gif) 000 FWHM (mass accuracy of <4 ppm); injection time was set to 1000 ms; mass to charge (m/z) range was 150–1000; capillary temperature was set to 250 °C; capillary voltage was 50 V; tube lens voltage was −150 V; and skimmer voltage was −40 V. The MS parameters were kept constant for the purpose of DESI-MS sprayer optimization. A 1/16” Swagelok T element-based DESI-MS sprayer (for the details of the set-up see ESI 1†) was used in conjunction with a home built 3D XYZ integrated linear stage, which acts as a sample holder and positioning device for the sprayer relative to the MS capillary inlet and sample (for set-up see ESI 2†).
000 FWHM (mass accuracy of <4 ppm); injection time was set to 1000 ms; mass to charge (m/z) range was 150–1000; capillary temperature was set to 250 °C; capillary voltage was 50 V; tube lens voltage was −150 V; and skimmer voltage was −40 V. The MS parameters were kept constant for the purpose of DESI-MS sprayer optimization. A 1/16” Swagelok T element-based DESI-MS sprayer (for the details of the set-up see ESI 1†) was used in conjunction with a home built 3D XYZ integrated linear stage, which acts as a sample holder and positioning device for the sprayer relative to the MS capillary inlet and sample (for set-up see ESI 2†).
Process of optimization
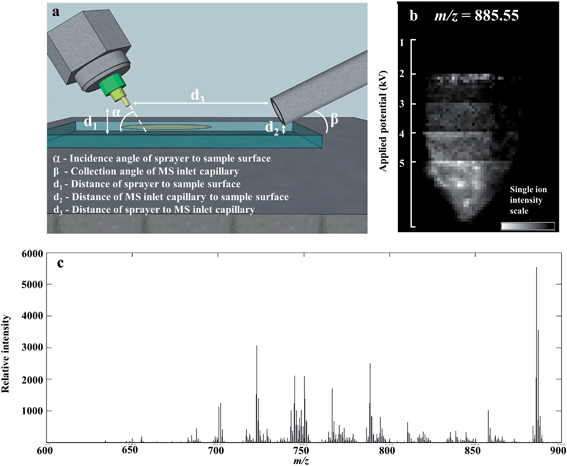
We optimized the parameters of the DESI-MS set-up for the purpose of lipidomic profiling by determining optimal settings for maximum ion yield of lipid species. Geometric parameters of the DESI-MS sprayer and electrospray solvent parameters were adjusted in a systematic fashion to determine the optimum settings. Geometric parameters included the height of sprayer tip relative to the sample surface, distance of sprayer tip from the MS inlet capillary and the angle of the sprayer tip to the sample surface (Fig. 1a). Electrospray solvent parameters included the ratio of MeOH and H2O in the solvent, solvent flow rate, nebulizing gas flow rate, and electric potential applied to generate the electrospray.Distances were manually adjusted on the DESI-MS sprayer mount using built-in micrometre screw gauges providing accuracy down to 50 μm. The angle of the sprayer was manually adjusted with a rotational manipulator with an accuracy of 1 degree. Solvent flow rates were adjusted with a Sunchrom Micro Syringe pump carrying a 200 μl syringe. Gas pressure was set using a BOC Series 8500 nitrogen regulator, with an accuracy of 0.5 bar.
Multiple settings of each variable were tested on separate single tissue sections (example, Fig. 1b). The tissue sections used for the optimization experiments were all from the same sample from the first quadrant of the tumor, thereby minimizing biological variability influencing the results. When adjusting the settings of one variable, all other variables were kept at pre-determined values as follows: 2 mm distance from sprayer tip to sample surface, 14 mm from sprayer tip to MS capillary inlet, 80° incidence angle of sprayer to surface, 95![[thin space (1/6-em)]](https://www.rsc.org/images/entities/char_2009.gif) :
:![[thin space (1/6-em)]](https://www.rsc.org/images/entities/char_2009.gif) 5 v/v MeOH–H2O solvent concentration, 1.5 μl min−1 solvent flow rate, 4 bar gas inlet pressure and a spray voltage of 4.5 kV. The MS inlet capillary had a collection angle of 10° and set at 500 μm from the sample surface and was not adjusted for optimization. The lateral resolution of the data acquisition (pixel size) was also kept constant at 75 μm. Due to the inter-dependence of the solvent flow rate and gas inlet pressure for generating the nebulized solvent; these variables were tested together through multiple combinations of their settings.
5 v/v MeOH–H2O solvent concentration, 1.5 μl min−1 solvent flow rate, 4 bar gas inlet pressure and a spray voltage of 4.5 kV. The MS inlet capillary had a collection angle of 10° and set at 500 μm from the sample surface and was not adjusted for optimization. The lateral resolution of the data acquisition (pixel size) was also kept constant at 75 μm. Due to the inter-dependence of the solvent flow rate and gas inlet pressure for generating the nebulized solvent; these variables were tested together through multiple combinations of their settings.
Determination of precision
The precision of an instrument is defined as the closeness of agreement between independent test results obtained under stipulated conditions.21 Quantitative measures of precision depend critically on these conditions. Repeatability and reproducibility conditions are particular sets of extreme stipulated conditions. Repeatability is the precision obtained under the same conditions when independent test results are obtained with the same method, on identical test items, in the same laboratory, by the same operator, using the same equipment, and within short intervals of time. Repeatability leads to an estimate of the minimum value of precision. Reproducibility is the precision obtained under changing conditions when independent test results are obtained with the same method, on identical test items, but in different laboratories, with different operators, using different (or recalibrated) equipment.A total of 16 tissue sections including four from each quadrant of the tumor were subjected to DESI-MS image acquisition in a random order, performed consecutively in a single time frame, in the same laboratory and by the same operator for measures of repeatability. All geometric and electrospray parameters were kept constant as per the optimized values.
A total of 4 tissue sections from a single quadrant of the tumor were subjected to DESI-MS image acquisition in a random order, performed consecutively, in a different laboratory, with a different operator, using a different sprayer and MS (LTQ Orbitrap Discovery, Thermo Fisher Scientific Inc., Bremen, Germany) and compared to the initial data set of the same quadrant, for measures of reproducibility. All geometric, electric and solvent parameters of the DESI-MS source were kept constant as per the previously determined optimized values. Stored samples of the tissue sections were analysed in the same time frame as the repeatability experiments to avoid any bias introduced through storage.
Data analysis methods
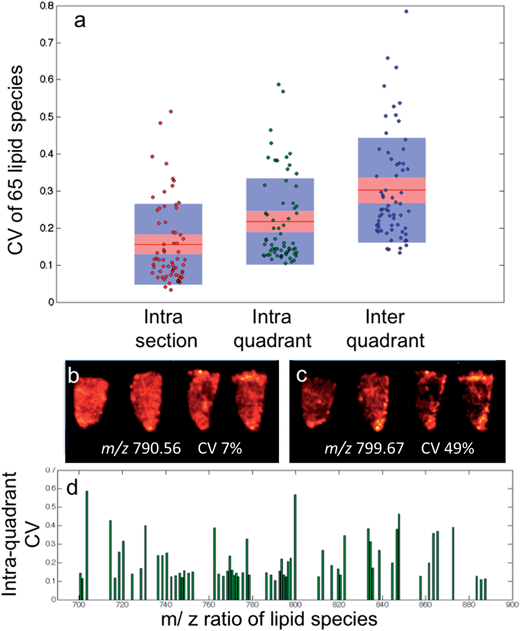
Following DESI-MS image acquisition, an imzML converter (Justus-Liebig-Universität, Giessen, Germany) was used to combine the series of raw files for each imaging dataset. The subsequent imzML files were then read into a MATLAB (MathWorks) environment using an in-house written function, incorporating a mass range selection of m/z 600 to 900 to limit spectral feature identification to lipids.For the CV calculations, 10 spectra were randomly selected from either a single sample (intra-section), or samples from the same quadrant (intra-quadrant) or samples from the whole dataset (inter-quadrant) and averaged to create a single data vector. For each data vector, the 65 pre-determined peak regions were integrated and the mean of their CVs were calculated. This process was repeated 50 times for each sampling group. The mean and standard of deviation of the 50 mean CVs of each sample group were calculated.
In order to compare the lipid profiles of the 16 tissue sections, the average of 10 full spectra (m/z 600–900), repeated 25 times were randomly collected from each of the 16 imaging datasets, pre-processed (vide supra), log transformed, and analysed by principal component analysis (PCA). Further comparisons were made by hierarchical cluster analysis (HCA). In this case, four regions of interest were manually selected from each of the 16 ion images and their corresponding spectral data were averaged, giving a total of 64 data vectors. Pairwise distances were calculated with the ‘correlation’ metric within the pdist MATLAB function. The hierarchical tree was encoded using the ‘average’ metric for the linkage function.
The correlation pairwise distance metric calculates the distances based on one minus the correlation between points, whilst the average metric for computing distance between clusters uses the un-weighted average distance. These metrics were selected as they gave the highest score from all available combinations for a cophenetic correlation calculation (obtained using the cophenet function). This is a measure of correlation between the distances obtained from the tree and those used to construct the tree; a higher correlation score indicates a more faithful representation of the original distances.
Results and discussion
Optimization of experimental parameters
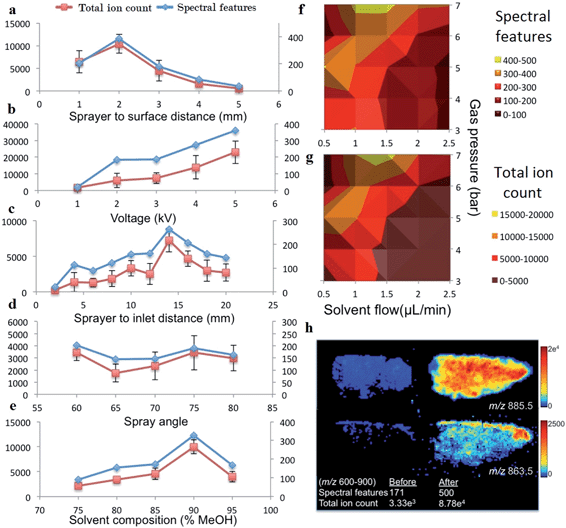
The number of spectral features in the m/z range of 600–900 and their associated TIC values obtained for various settings of geometric and electrospray parameters are demonstrated in Fig. 2. Previous studies investigating the droplet dynamics of DESI-MS support our findings regarding the optimum values for different parameters.14–18,23–29The optimal settings determined for our DESI-MS ion source were a sprayer to surface distance of 2 mm, sprayer to MS capillary inlet of 14 mm, solvent flow rate of 1.5μl min−1, gas flow rate of 7 bars, 90![[thin space (1/6-em)]](https://www.rsc.org/images/entities/char_2009.gif) :
:![[thin space (1/6-em)]](https://www.rsc.org/images/entities/char_2009.gif) 10 v/v MeOH–H2O solvent concentration and a spray potential of 5 kV. An incidence angle of 75 degrees was selected due to the minimal variation observed in the studied range of values. We compared the outcome of two adjacent sections using the new versus our preliminary set of experimental values and demonstrated a 192% increase in the number of detected spectral features and increase in TIC by one order of magnitude in the 600–900 m/z range (Fig. 2h).
10 v/v MeOH–H2O solvent concentration and a spray potential of 5 kV. An incidence angle of 75 degrees was selected due to the minimal variation observed in the studied range of values. We compared the outcome of two adjacent sections using the new versus our preliminary set of experimental values and demonstrated a 192% increase in the number of detected spectral features and increase in TIC by one order of magnitude in the 600–900 m/z range (Fig. 2h).
Repeatability
Normalization is justified to ensure that pixels are not excluded from a group based on systematically lower ion intensities across all peaks within the spectrum. While fluctuation of overall intensity can be corrected by normalization, it does not correct for missing peaks or other pattern-level fluctuations in the spectra. Therefore, the pixels with different feature sets will be separately classified by multivariate statistical analysis methods.
The aim of normalization is to account for variation in ion intensities that is complicit within the acquisition and not a naturally occurring biological fluctuation over the surface of the sample. By far the most commonly used method – in the field of imaging mass spectrometry – is to normalize to the sum of all spectral intensities, otherwise known as the TIC. However, the performance of this approach can be compromised by the unexpected intensity change of a single high intensity peak.31 Normalization to the base peak (unit vector normalization) is suitable when the base peak is the same in each spectrum and it shows uniform intensity across the entire tissue section (or histologically homogeneous segment).32 However, even in cases where the tissue section is assumed to be homogenous, this approach is still likely to fail due to undetermined biological variation.
Although the spectra collected within the current study are expected to be highly uniform due to the choice of tissue, the general purpose of tissue imaging experiments is still to identify regions with different chemical profiles. Consequently, it would be desirable to have a normalization technique that not only corrects for variance in the spectral intensity but also facilitates the confident discovery of changes within lipid spectral patterns. For this reason we opt to use median fold change within our workflow. From a computational point of view, the fold changes of non-differentially expressed lipid species between pixels should be approximately one. If this were not the case, the robust estimate of this systematic bias would be shown by the median of fold changes of peak intensities of a given pixel with respect to the median profile across all pixels.33
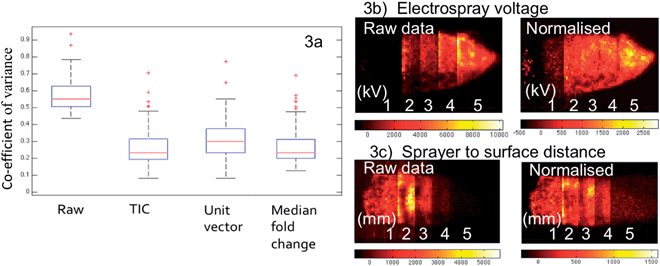
As seen in Fig. 3a, although the tissue samples are thought to be homogenous and all analysis parameters were kept the same, the CV for the selected lipid species when all sixteen samples are compared has a median value of 55% within the raw data, with some outliers in excess of 90%. This is accounted for by day-to-day variation in the analysis as no single tissue section has a median CV greater than 25%. All three of the normalization techniques discussed resulted in a considerable improvement; however the outliers still remained, suggesting the presence of a biological effect (heterogeneous distribution) as opposed to experimental.
Fig. 3b and c illustrate the ability of normalization to correct for fluctuations in analysis conditions. The image on the left shows the first principal component score image of the raw data of tissue sections analysed under five varying conditions, electrospray voltage in Fig. 3b and distance between sprayer tip and the tissue in Fig. 3c. The optimum setting is clearly demonstrated by the raw data in both cases, with the other values having a lower contribution to the PC proportionally to their distance from the optimum. When median fold normalization is carried out, the PC1 scores demonstrate that the datasets acquired under different conditions now group much closer together, although one would expect that these differences associated with significant changes in experimental conditions cannot be eliminated by sole normalization. However it is shown in Fig. 3c, the normalization can correct for a ±1 mm change from the 2 mm optimum of the sprayer to tissue distance, far greater than any human error (precision of human hands and eye). Similar observations were made for all of the conditions studied.
The intra-quadrant mean ± SD CV of 22 ± 7% is the best representation of the repeatability of the instrument, as measurements are performed on different samples and have less contribution from biological heterogeneity as found at the inter-quadrant level. The repeatability of the instrument is such that if two regions of interest were compared from different samples, it would mean a fold change of only 1.3 would be required to determine a significant difference with a 95% confidence.
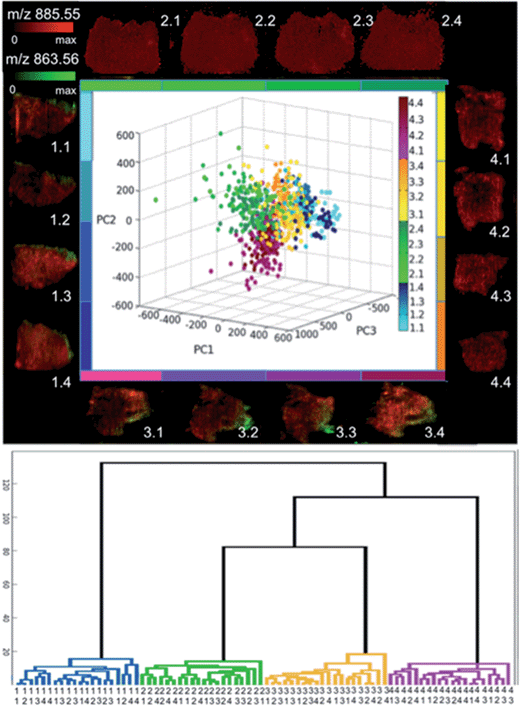
Consequently, the lipid profiles were compared by PCA, with the resulting score plot colour coded by individual tissue section with each quadrant having its own colour group (Fig. 5a). Loading plots are included in ESI S4.† The data points in Fig. 5a from each individual tissue section scatter within a single large group in the 3 dimensional PCA space (first three components); with few outlying data points. Within the main cluster, it is evident that the data groups from the different quadrants of the tumor show high levels of overlap. This is expected as these sections are from spatially remote regions of the biological mass, whereas the samples from the same quadrant are serial sections (original distance of corresponding voxels is less than 50 μm). The fact that there is no apparent sub-grouping within the individual quadrants suggests that spectra from the same tissue analysed at different times cannot be differentiated based on their lipid fingerprint. This is supported by the HCA in Fig. 5b where mean spectra were created from four tumour specific areas from each section. Here again we see that each quadrant clusters together, however, at the following level the sub-regions of each tissue section do not cluster.
Reproducibility
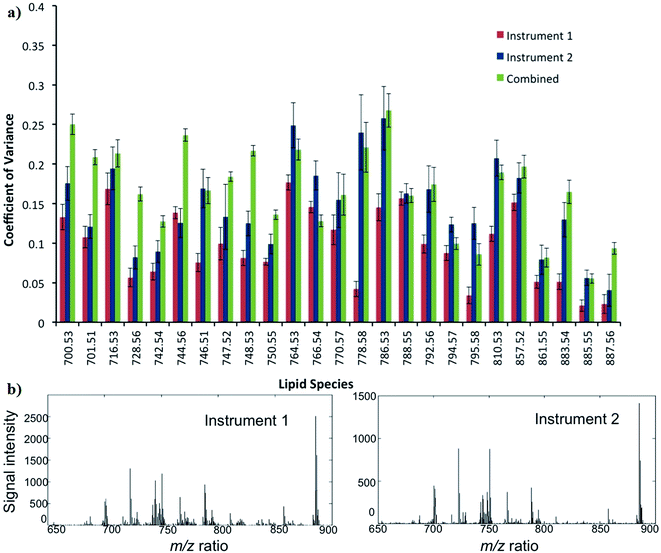
The reproducibility of DESI-MS for the analysis of ion intensities of 25 selected lipid species is demonstrated in Fig. 6. The mean CV ± SD for the 25 lipid species from instrument 1 (Exactive FTMS) and 2 (LTQ Orbitrap XL) were 10 ± 5 and 16 ± 7%, respectively. When data from the DESI-MS platforms are combined, the reproducibility or mean CV ± SD is 18 ± 8%. In general, the CVs of lipids for instrument 2 are greater than instrument 1, which can be attributed to a less stable DESI-MS ion source and an inferior MS sensitivity. The CV for reproducibility is less than that for repeatability as only sections from the fourth quadrant of the tumour were chosen for the purpose of analysis: to reduce the influence of biological heterogeneity confounding the results (ESI S3†).In comparison, a study by Dill et al. investigated the reproducibility of DESI-MS in five serial sections of rat brain.34 The methodology, however, was more in keeping with repeatability rather than reproducibility, which was assessed by two methods: first by calculating the ratio between the absolute intensity of two main peaks and then performing an analysis of the full spectrum based on normalized vectors. The best values for the ratio and normalized vector analysis were a relative standard deviation (RSD) of 4.7–8% and 0.8%, respectively.34
A study of human plasma lipid extracts with LC-MS demonstrated a CV of less than 15%.35 A further study of lipid extracts form rat heart/skeletal muscle mitochondria using HPLC-MS showed an inter-day CV of ≤11% for different groups of glycerophospholipids.36 However, these studies did not adhere to the strict stipulated conditions for measuring reproducibility as per the definition,21 and therefore meaningful comparisons cannot be made with our data. In our study, the results of reproducibility meet the requirements by the FDA, which states that the CV should not exceed 20% as per chromatographic methods.20
Conclusion
This is the first study to report measurements of precision for the imaging analysis of human cancer tissue using DESI-MS. The optimal parameters for the DESI-MS ion source were in coarse agreement with the results of previous studies and they were consistent with the droplet pick-up ionization mechanism of DESI-MS. Median fold change provided the optimal method for normalization of data. Repeatability and reproducibility for measurements of lipid intensities in tissue sections were 22% and 18%, respectively.The reproducibility of DESI-MS is appropriate for accurate lipidomic profiling studies of human tissue for meaningful inter-sample comparison of various disease states such as cancer. Due to the inherent difficulties associated with introducing internal standards into intact human tissue, the technique is limited to a semi-quantitative capacity which means that is better suited to lipid ratio identification of specific tissue types, commonly referred to as the “fingerprint”, which can be used with increased confidence for the purpose of automated histology with MSI.
The evolving field of lipidomics will benefit from technologies that have an acceptable level of precision for profiling and targeted studies of lipids in human disease. Well established chromatographic techniques such as LC-MS have remained the gold standard due to their quantitative capacity, range of lipid detection and ease of automation. However these techniques generally build on lipid extraction-type sample preparation, which lack histological specificity, encompassing all of the various cellular components rather than specific cells of interest. DESI-MS not only has the added advantage of spatially and histologically resolved data acquisition, it also has acceptable levels of reproducibility for the purposes of lipidomic profiling.
Funding sources
The research was supported by the National Institute for Health Research (NIHR) Biomedical Research Centre based at Imperial College Healthcare National Health Service (NHS) Trust and Imperial College London. This work was also supported by the European Research Council under the Starting Grant scheme (contract no. 210356).Abbreviations
| DESI-MS | desorption electrospray mass spectrometry |
| MSI | Mass spectrometry imaging; total ion count |
| MALDI | Matrix assisted laser desorption ionization |
| SIMS | secondary ion mass spectrometry |
| MS | mass spectrometer |
| RSD | relative standard deviation |
| CV | co-efficient of variance |
| ppm | parts per million |
| PCA | principal component analysis |
| HCA | hierarchical cluster analysis |
| SM | Sphingomyelin |
| PA | Phosphatidic acid |
| PS | Phosphatidylserine |
| HPLC-MS | high performance liquid chromatography mass spectrometry |
| LC-MS | liquid chromatography mass spectrometry |
References
- S. M. Rahman, A. L. Gonzalez, M. Li, E. H. Seeley, L. J. Zimmerman, X. J. Zhang, M. L. Manier, S. J. Olson, R. N. Shah, A. N. Miller, J. B. Putnam, Y. E. Miller, W. A. Franklin, W. J. Blot, D. P. Carbone, Y. Shyr, R. M. Caprioli and P. P. Massion, Cancer Res., 2011, 71, 3009–3017 CrossRef CAS PubMed.
- M. Shi, J. Jin, Y. Wang, R. P. Beyer, E. Kitsou, R. L. Albin, M. Gearing, C. Pan and J. J. Zhang, J. Neuropathol. Exp. Neurol., 2008, 67, 117–124 CrossRef CAS PubMed.
- J. Pierson, J. L. Norris, H. R. Aerni, P. Svenningsson, R. M. Caprioli and P. E. Andren, J. Proteome Res., 2004, 3, 289–295 CrossRef CAS.
- N. Zaima, T. Sasaki, H. Tanaka, X. W. Cheng, K. Onoue, T. Hayasaka, N. Goto-Inoue, H. Enomoto, N. Unno, M. Kuzuya and M. Setou, Atherosclerosis, 2011, 217, 427–432 CrossRef CAS PubMed.
- P. Fragu, J. Klijanienko, D. Gandia, S. Halpern and J. P. Armand, Cancer Res., 1992, 52, 974–977 CAS.
- E. S. Lee, H. K. Shon, T. G. Lee, S. H. Kim and D. W. Moon, Atherosclerosis, 2013, 226, 378–384 CrossRef CAS PubMed.
- A. N. Lazar, C. Bich, M. Panchal, N. Desbenoit, V. W. Petit, D. Touboul, L. Dauphinot, C. Marquer, O. Laprevote, A. Brunelle and C. Duyckaerts, Acta. Neuropathol., 2013, 125, 133–144 CrossRef CAS PubMed.
- N. E. Manicke, M. Nefliu, C. Wu, J. W. Woods, V. Reiser, R. C. Hendrickson and R. G. Cooks, Anal. Chem., 2009, 81, 8702–8707 CrossRef CAS PubMed.
- S. Gerbig, O. Golf, J. Balog, J. Denes, Z. Baranyai, A. Zarand, E. Raso, J. Timar and Z. Takats, Anal. Bioanal. Chem., 2012, 403, 2315–2325 CrossRef CAS PubMed.
- L. S. Eberlin, I. Norton, A. L. Dill, A. J. Golby, K. L. Ligon, S. Santagata, R. G. Cooks and N. Y. Agar, Cancer Res., 2012, 72, 645–654 CrossRef CAS PubMed.
- T. A. Masterson, A. L. Dill, L. S. Eberlin, M. Mattarozzi, L. Cheng, S. D. Beck, F. Bianchi and R. G. Cooks, J. Am. Soc. Mass Spectrom., 2011, 22, 1326–1333 CrossRef CAS PubMed.
- E. Fahy, S. Subramaniam, H. A. Brown, C. K. Glass, A. H. Merrill Jr, R. C. Murphy, C. R. Raetz, D. W. Russell, Y. Seyama, W. Shaw, T. Shimizu, F. Spencer, G. van Meer, M. S. van Nieuwenhze, S. H. White, J. L. Witstum and E. A. Dennis, J. Lipid Res., 2005, 46, 839–861 CrossRef CAS PubMed.
- M. R. Wenk, Nat. Rev. Drug Discovery, 2005, 4, 594–610 CrossRef CAS PubMed.
- Z. Takats, J. M. Wiseman and R. G. Cooks, J. Mass Spectrom., 2005, 40, 1261–1275 CrossRef CAS PubMed.
- K. A. Douglass, S. Jain, W. R. Brandt and A. R. Venter, J. Am. Soc. Mass Spectrom., 2012, 23, 1896–1902 CrossRef CAS PubMed.
- F. M. Green, P. Stokes, C. Hopley, M. P. Seah, I. S. Gilmore and G. O'Connor, Anal. Chem., 2009, 81, 2286–2293 CrossRef CAS PubMed.
- A. Venter, P. E. Sojka and R. G. Cooks, Anal. Chem., 2006, 78, 8549–8555 CrossRef CAS PubMed.
- A. Badu-Tawiah, C. Bland, D. I. Campbell and R. G. Cooks, J. Am. Soc. Mass Spectrom., 2010, 21, 572–579 CrossRef CAS PubMed.
- A. Bodzon-Kulakowska, A. Drabik, J. Ner, J. H. Kotlinska and P. Suder, Rapid Commun. Mass Spectrom., 2014, 28, 1–9 CrossRef CAS PubMed.
- U.S. Department of Health and Human Services Food and Drug Administration, Guidance for industry: bioanalytical method validation, September 2013, http://www.fda.gov/downloads/Drugs/GuidanceComplianceRegulatoryInformation/Guidances/UCM368107.pdf Search PubMed.
- Analytical methods committee, AMC technical brief: Terminology – the key to understanding analytical science. Part 1: Accuracy, precision and uncertainty, 2013, Royal Society of Chemistry Web site, http://www.rsc.org/lap/rsccom/amc/amc_index.htm, accessed Nov 28, 2013 Search PubMed.
- M. Senko, S. Beu and F. McLafferty, J. Am. Soc. Mass Spectrom., 1995, 6, 52–56 CrossRef CAS.
- A. B. Costa and R. G. Graham, Chem. Phys. Lett., 2008, 464, 1–8 CrossRef CAS PubMed.
- A. Venter and R. G. Cooks, Anal. Chem., 2007, 79, 6398–6403 CrossRef CAS PubMed.
- H. Chen, N. N. Talaty, Z. Takáts and R. G. Cooks, Anal. Chem., 2005, 77, 6915–6927 CrossRef CAS PubMed.
- Z. Takats, S. C. Nanita, R. G. Cooks, G. Schlosser and K. Vekey, Anal. Chem., 2003, 75, 1514 CrossRef CAS.
- R. Haddad, R. Sparrapan and M. N. Eberlin, Rapid Commun. Mass Spectrom., 2006, 20, 2901–2905 CrossRef CAS PubMed.
- H. Y. Liu and A. Montaser, Anal. Chem., 1994, 66, 3233 CrossRef CAS.
- A. Gomez and K. Q. Tang, Phys. Fluids, 1994, 6, 404 CrossRef CAS PubMed.
- S.-O. Deinenger, D. S. Cornett, R. Paape, M. Becker, C. Pineau, S. Rauser, A. Walch and E. Wolski, Anal. Bioanal. Chem., 2011, 401, 167–181 CrossRef PubMed.
- D. A. Cairns, D. Thompson, D. N. Perkins, A. J. Stanley, P. J. Selby and R. E. Banks, Proteomics, 2008, 8, 21–27 CrossRef CAS PubMed.
- G. T. Rasmussen and T. L. Isenhour, J. Chem. Inf. Comput. Sci., 1979, 19, 179–186 CrossRef CAS.
- K. A. Veselkov, L. K. Vingara, P. Masson, S. L. Robinette, E. Want, J. V. Li, R. H. Barton, C. Boursier-Neyret, B. Walther, T. M. Ebbels, I. Pelczer, E. Holmes, J. C. Lindon and J. K. Nicholson, Anal. Chem., 2011, 83, 5864–5872 CrossRef CAS PubMed.
- A. L. Dill, L. S. Eberlin, A. B. Costa, D. R. Ifa and R. G. Cooks, Anal. Bioanal. Chem., 2011, 401, 1949–1961 CrossRef CAS PubMed.
- L. A. Heiskanen, M. Suoniemi, H. X. Ta, K. Tarasov and K. Ekroos, Anal. Chem., 2013, 85, 8757–8763 CrossRef CAS PubMed.
- J. Kim and C. L. Hoppel, J. Chromatogr. B: Anal. Technol. Biomed. Life Sci., 2013, 912, 105–114 CrossRef CAS PubMed.
Footnotes |
| † Electronic supplementary information (ESI) available: Supplementary files 1: DESI sprayer construction, supplementary files 2: home-built 3D XYZ integrated DESI-MS stage, supplementary files 3: mean CVs of 65 lipid peaks, supplementary files 4: loading plots. See DOI: 10.1039/c4ay01770f |
| ‡ NA and EJ are joint first authors and they contributed equally. The manuscript was written through contributions of all authors. All authors have given approval to the final version of the manuscript. |
| This journal is © The Royal Society of Chemistry 2015 |

