 Open Access Article
Creative Commons Attribution 3.0 Unported Licence
Complete structure and cation orientation in the perovskite photovoltaic methylammonium lead iodide between 100 and 352 K†
Mark T.
Weller
*a,
Oliver J.
Weber
a,
Paul F.
Henry
b,
Antonietta M.
Di Pumpo
ac and
Thomas C.
Hansen
c
aDepartment of Chemistry and Centre for Sustainable Technologies, University of Bath, Claverton Down, Bath, BA2 7AY, UK. E-mail: m.t.weller@bath.ac.uk
bEuropean Spallation Source ESS AB, P.O Box 176, SE-221 00 Lund, Sweden
cInstitut Laue Langevin, 71 Avenue des Martyrs, 38000 Grenoble, France
First published on 23rd January 2015
Abstract
The methylammonium cation in [CH3NH3]PbI3 demonstrates increasing positional disorder on heating from 100 K to 352 K. In the tetragonal phase, stable between 165 K and 327 K, the cation is disordered over four sites directed toward the faces of the distorted cubic [PbI3]− framework and migrates towards the cavity centre with increasing temperature.
The hybrid perovskite phase methylammonium lead iodide (MAPbI3) has attracted increasing amounts of scientific attention since its identification as a highly efficient and low cost photovoltaic material.1 Device efficiencies have rapidly risen to 17.9%,2 while significant questions still remain regarding the device physics, especially the dynamic response under working conditions,3 and also the fundamental structural properties of the material as a bulk solid and dynamically in operando. Full structural definition of the phases of MAPbI3 has been hindered by the inherent complexity of the hybrid perovskite, with disorder in both organic and inorganic components observed in the higher temperature phases,4 and the inherent limitations of X-ray diffraction techniques; these include an inability to distinguish the near isoelectronic atoms carbon and nitrogen, and difficulty in locating the light atom positions in the presence of the heavy atoms, Pb and I.
In previous studies the highest temperature phase, T > 327 K, has been part-refined (heavy atoms) in the cubic Pm![[3 with combining macron]](https://www.rsc.org/images/entities/char_0033_0304.gif) m space group from powder X-ray diffraction (PXD) data5 and in the tetragonal P4mm space group from single crystal X-ray diffraction data (SXD) at 400 K.6 The tetragonal phase, adopted between 165 and 327 K, has been refined in the space group I4cm at 293 K from SXD6 and I4/mcm symmetry from PXD data.5 Neither of these models identified hydrogen atom position and the orientation of the methylammonium cation remained unclear. Note that Swainson et al.7 could not definitively extract the [CH3ND3]+ cation position in the tetragonal phase of CH3ND3PbBr3 but the data suggested C–N orientation towards or along 〈001〉 or 〈110〉. The orthorhombic phase, found below 165 K, had been originally modelled in the space group Pna21; however this was reclassified into Pnma as a result of the powder neutron diffraction (PND) data obtained from CH3ND3PbBr3 at 11 K.7 The C–N bond was found to lie normal to the b-axis, with the C → N vector alternating in neighbouring unit cells along this axis direction. The tetragonal to cubic phase transition has been investigated using both PXD5 and SXD.414N and 2H NMR data8 have shown that the rate of reorientation of the MA cation in the cubic phase approaches that of a freely rotating MA ion on the picosecond timescale, while for the tetragonal phase this rotation is increasingly arrested, with MA cations distributed over eight disordered states. In the orthorhombic (Pnma) phase, the cations are fixed with rotation of the C–N axis restricted. Quarti et al.9 investigated polar and apolar structural models for MA cation orientation, finding a range of stable structures accessible within 0.1 eV per unit cell. The possibility of domains with different orientations existing within the same crystal was also described.
m space group from powder X-ray diffraction (PXD) data5 and in the tetragonal P4mm space group from single crystal X-ray diffraction data (SXD) at 400 K.6 The tetragonal phase, adopted between 165 and 327 K, has been refined in the space group I4cm at 293 K from SXD6 and I4/mcm symmetry from PXD data.5 Neither of these models identified hydrogen atom position and the orientation of the methylammonium cation remained unclear. Note that Swainson et al.7 could not definitively extract the [CH3ND3]+ cation position in the tetragonal phase of CH3ND3PbBr3 but the data suggested C–N orientation towards or along 〈001〉 or 〈110〉. The orthorhombic phase, found below 165 K, had been originally modelled in the space group Pna21; however this was reclassified into Pnma as a result of the powder neutron diffraction (PND) data obtained from CH3ND3PbBr3 at 11 K.7 The C–N bond was found to lie normal to the b-axis, with the C → N vector alternating in neighbouring unit cells along this axis direction. The tetragonal to cubic phase transition has been investigated using both PXD5 and SXD.414N and 2H NMR data8 have shown that the rate of reorientation of the MA cation in the cubic phase approaches that of a freely rotating MA ion on the picosecond timescale, while for the tetragonal phase this rotation is increasingly arrested, with MA cations distributed over eight disordered states. In the orthorhombic (Pnma) phase, the cations are fixed with rotation of the C–N axis restricted. Quarti et al.9 investigated polar and apolar structural models for MA cation orientation, finding a range of stable structures accessible within 0.1 eV per unit cell. The possibility of domains with different orientations existing within the same crystal was also described.
In this work we have investigated the full structure of [CH3NH3]PbI3 using neutron powder diffraction (NPD) on a fully hydrogenous sample. This has provided key information on light atom positions in this heavy metal compound and distinguished carbon and nitrogen, due to their contrasting scattering lengths. Investigation of hydrogenous samples also has the advantage of avoiding isotope effects, which can markedly change phase behaviour in ammonium and alkylammonium compounds10 while also providing a strong contrast between carbon, nitrogen, and hydrogen due to the latter's negative scattering length. The ability to extract good structural information from hydrogenous materials using high flux, medium resolution neutron diffraction instruments with large area detectors has previously been reported.11
A sample of MAPbI3 was synthesised and its structure investigated as summarised in the Experimental Section.‡
Orthorhombic structure, 100 K. The structure at 100 K was solved in Pnma previously described for CH3ND3PbBr3 at 11 K7 – see ESI† Section S1.1 for details of the structure refinement process, crystallographic model and derived bond lengths and angles. In this phase the MA+ cations are fully ordered, Fig. 1, with the –NH3 groups aligned and directed into the distorted square face of the parent perovskite unit cell. The PbI6 octahedra are slightly distorted even though this is not necessary for the descent from cubic perovskite structure to Pnma, which is achievable through simple titling of the octahedra; the Pb–I–Pb angles are Pb–I1–Pb = 161.94(16)° (along b-axis) and Pb–I2–Pb = 150.75(12)° (along a and c axis); the average Pb–I–Pb bond angle is 154.5°. These tilts allow the three of the four iodide ions in one square face to move towards the –NH3 end of the methylammonium cation and away from the –CH3 end in the next unit cell, thereby satisfying the coordination preferences of both polar and non-polar ends of the molecules, Fig. 1. The centroid of the methylammonium cation lies near the centre of the cage giving reasonable strong hydrogen bonded NH⋯I distances at 2.613(7) and 2.808(9) (×2) Å (cf. 2.598 Å in NH4I).12 The refined anisotropic ADPs of the hydrogen atoms indicate that both ends of the methylammonium cation are undergoing large librations at 100 K in agreement with NMR data.8
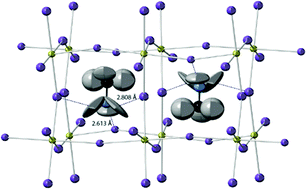 | ||
| Fig. 1 The unit cell of MAPbI3 at 100 K viewed close to a-axis the showing ADPs as 90% probability ellipsoids; lead yellow, iodine purple, carbon black, nitrogen blue and hydrogen grey. | ||
Tetragonal structure, 180 K. The structure at 180 K was investigated using various models as summarized in ESI† Section S1.2. A model in I4/mcm was employed in the final structure description in which the MA cation adopts four possible orientations, along 〈100〉 and equivalent directions, in the unit cell pointing closely towards the centre of the distorted perovskite cube face (Fig. 2). The [PbI3]− framework is considerably less distorted than in the orthorhombic phase with Pb–I2–Pb × 2 = 157.92(15)° and Pb–I3–Pb = 180° (average Pb–I–Pb bond angle 165.3°) and interactions between the –NH3 group and the framework iodide are much weaker at 3.18(1) Å and 3.15(2) Å.
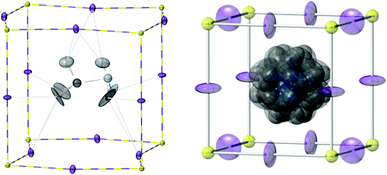 | ||
| Fig. 2 Left: one orientation of the MA+ cation in the tetragonal phase of MAPbI3 at 180 K; the cation is four-fold orientationally disordered around the c-axis which is vertical in this diagram. Right: orientational disorder modelled in the cubic phase at 352 K. Atom key as in Fig. 1 and ADP ellipsoids at 50% probability. | ||
Cubic structure 352 K. See ESI† Section S1.3 for full details of the structure model development. Above 327 K in the cubic phase all Pb–I–Pb angles become, necessarily, 180° and the methylammonium cation becomes orientationally disordered at the unit cell centre primarily along the three unit cell directions with weak NH⋯I interactions at 3.12(2) Å and 3.52(2) Å (Fig. 2).
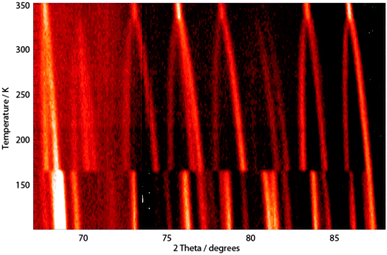
Variable temperature data, 100–352 K. Fig. 3 shows part of the mid-angle diffraction data collected while heating over the temperature range 100–352 K. These data clearly show the phase changes occurring at 165 and 327 K and the expansion of the respective unit cells in each of the temperature ranges for which the orthorhombic, tetragonal and cubic phase is stable. Data collected in each temperature range were binned into 2.5 K blocks for structure analysis using SEQGSAS,13 to obtain a structural model for MAPbI3 at each 2.5 K temperature point. Extracted information included lattice parameter information as well as the full coordinate and isotropic ADP information equivalent to that obtained for each phase at 100, 180 and 352 K – though esds on these values are higher due to much shorter counting times at each temperature point. However, these data clearly demonstrate the behaviour of the MA+ cation with increasing temperature, as well as the overall response of the lead iodide framework and cell parameters. Our analysis here is restricted to a brief discussion of the key tetragonal phase that is stable at room temperature – further detailed analysis will be reported in due course.
Fig. 4 shows the variation of the reduced unit cell parameter ratio of the tetragonal phase between its formation at 165 K and its transformation to the cubic phase at 327 K. Fig. 5 shows the evolution derived Pb–I2–Pb bond angle and the x-coordinate of the nitrogen atom of the MA+ cation over the same temperature range. Fig. S4.3 (ESI†) shows the variation in the nitrogen atom Uiso. These plots demonstrate that with increasing temperature the [PbI3]− framework becomes less distorted and the MA+ group undergoes larger atomic displacements and migrates slowly towards the centre of the perovskite cube with the carbon and nitrogen atoms gradually adopting positions equidistant, at x ~ 0.46 and 0.54 respectively, from the cavity centre with x = 0.5. These behaviours all herald the formation of the cubic structure at 327 K.
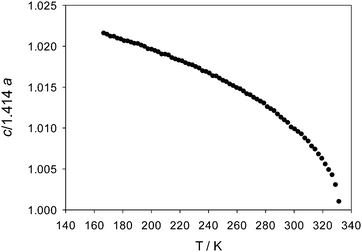 | ||
| Fig. 4 Variation of the reduced lattice parameter ratio, c/√2a, over the range of stability of the tetragonal phase showing its approach to unity and formation of the cubic phase at 327 K. | ||
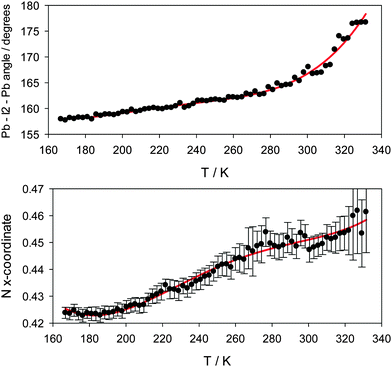 | ||
| Fig. 5 Top – variation in the Pb–I2–Pb angle as a function of temperature in the tetragonal phase. Bottom – methylammonium nitrogen atom x-coordinate over the same temperature range. | ||
At all temperatures the methylammonium cation in MAPbI3 is oriented towards an open face of the (distorted) cube formed by the linked PbI6 octahedra. At low temperatures the orientation of the MA cationic is fixed as a result of hydrogen bonding between the NH3 groups and the framework iodide atoms. This acts as the driving force for the observed deformation of the [PbI3]− framework producing three iodide sites closer to the –NH3 end of the cation and three further away from the methyl groups with the MA cation adopting a staggered formation. As the temperature is increased the thermal motion of the cation increases and the NH⋯I interactions weaken. At the transition to tetragonal phase, at 165 K, the MA cations become rotational disordered in the ab plane and disordered over four similar orientations as found for the orthorhombic phase and directed towards the distorted cube faces, 〈100〉, 〈010〉, 〈−100〉 and 〈0−10〉. The MA cation is displaced slightly off centre of the unit cell with very weak hydrogen bonding interactions between N–H and I. The –NH3 and CH3 groups undergo free, or very unhindered, rotation around the C–N bond. Further heating towards room temperature results in increasingly free motion of the MA cation and a slow migration towards a central position in the perovskite A-site cavity. This is accompanied by a decrease in the reduced c/a ratio towards unity and straightening of the Pb–I–Pb bonds before the transition to the cubic phase at 327 K. In the cubic phase the MA+ cation seems to remain directed toward the cube faces orientationally disordered over six positions – though a high level of positional and thermal disorder exists in this phase.
The observed high level of orientational motion of the MA+ cation at room temperature seems to be related to the excellent photovoltaic performance of this material but also the anomalous hysteresis effect that have been reported from experiment.15 Walsh et al.16 have proposed that the internal electrical fields associated with microscopic polarisation domains contribute to hysteretic anomalies due to variations in electron–hole recombination process. The formation of these domains is likely to be related, in turn, to the local orientation patterns of the MA cations and further modelling work is ongoing using the full structural models discovered and reported in this work.
The ILL is thanked for the provision of ILL Director's Discretionary time. We would like to acknowledge the ILL for a PhD support for A.M. Di P. O.J.W. would like to thank EPSRC (EP/G03768X/1) for PhD studentship funding via the EPSRC Doctoral Training Centre in Sustainable Chemical Technologies.
Notes and references
- M. M. Lee, J. Teuscher, T. Miyasaka, T. N. Murakami and H. J. Snaith, Science, 2012, 338, 643–647 CrossRef CAS PubMed; H.-S. Kim, C.-R. Lee, J.-H. Im, K.-B. Lee, T. Moehl, A. Marchioro, S.-J. Moon, R. Humphry-Baker, J.-H. Yum, J. E. Moser, M. Grätzel and N.-G. Park, Sci. Rep., 2012, 2, 591 Search PubMed.
- M. A. Green, K. Emery, Y. Hishikawa, W. Warta and E. D. Dunlop, Prog. Photovoltaics, 2014, 22, 701–710 Search PubMed.
- R. Gottesman, E. Haltzi, L. Gouda, S. Tirosh, Y. Bouhadana, A. Zaban, E. Mosconi and F. De Angelis, J. Phys. Chem. Lett., 2014, 5, 2662–2669 CrossRef CAS.
- Y. Kawamura, H. Mashiyama and K. Hasebe, J. Phys. Soc. Jpn., 2002, 71, 1694–1697 CrossRef CAS.
- T. Baikie, Y. Fang, J. M. Kadro, M. Schreyer, F. Wei, S. G. Mhaisalkar, M. Graetzel and T. J. White, J. Mater. Chem. A, 2013, 1, 5628–5641 CAS.
- C. C. Stoumpos, C. D. Malliakas and M. G. Kanatzidis, Inorg. Chem., 2013, 52, 9019–9038 CrossRef CAS PubMed; Y. Dang, et al. , CrystEngComm, 2015, 17, 665–670 RSC.
- I. P. Swainson, R. P. Hammond, C. Soullière, O. Knop and W. Massa, J. Solid State Chem., 2003, 176, 97–104 CrossRef CAS.
- R. E. Wasylishen, O. Knop and J. B. Macdonald, Solid State Commun., 1985, 56, 581–582 CrossRef CAS.
- C. Quarti, F. Mosconi and F. De Angelis, Chem. Mater., 2014, 26, 6557–6569 CrossRef CAS.
- Y. Kume, Y. Miyazaki, T. Matsuo, H. Suga, W. I. F. David and R. M. Ibberson, Europhys. Lett., 1991, 16, 265–270 CrossRef CAS.
- M. T. Weller, P. F. Henry, V. P. Ting and C. C. Wilson, Chem. Commun., 2009, 2973–2989 RSC; C. C. Wilson, P. F. Henry, M. Schmidtmann, V. P. Ting, E. R. Williams and M. T. Weller, Crystallogr. Rev., 2014, 20, 162–206 CrossRef CAS; P. F. Henry, M. T. Weller and C. C. Wilson, J. Appl. Crystallogr., 2009, 42(6), 1176–1188 Search PubMed.
- R. S. Seymour and A. W. Pryor, Acta Crystallogr., Sect. B: Struct. Crystallogr. Cryst. Chem., 1970, 26, 1487–1491 CrossRef CAS.
- A. C. Larson and R. B. Von Dreele, “General Structure Analysis System (GSAS)”, Los Alamos National Laboratory Report LAUR, 2000, 86-748 CrossRef CAS; B. H. Toby, EXPGUI, a graphical user interface for GSAS, J. Appl. Crystallogr., 2001, 34, 210–213 CrossRef CAS.
- A. Poglitsch and D. Weber, J. Chem. Phys., 1987, 87, 6373–6378 CrossRef CAS PubMed.
- H. J. Snaith, A. Abate, J. M. Ball, G. E. Eperon, T. Leijtens, N. K. Noel, S. D. Stranks, J. T.-W. Wang, K. Wojciechowski and W. Zhang, J. Phys. Chem. Lett., 2014, 5, 1511 CrossRef CAS.
- J. M. Frost, K. T. Butler and A. Walsh, APL Mater., 2014, 2, 081506 CrossRef PubMed.
Footnotes |
| † Electronic supplementary information (ESI) available: Full details of the structure refinements, crystallographic coordinates, profile fits and bond length and distances. See DOI: 10.1039/c4cc09944c |
| ‡ Experimental Section. Synthesis: methylammonium lead iodide was prepared according to the method of Poglitsch and Weber.14 2.5 g of lead acetate (Sigma) was dissolved in 10 mL hydroiodic acid (aq., 57 wt%, Sigma) in a 50 mL round bottom flask and heated to 100 °C in an oil bath. Separately, 0.597 g of CH3NH2 (aq., 40%, Sigma) was added drop-wise to a further 2 mL of hydroiodic acid kept at 0 °C in an ice bath under stirring. The methylammonium iodide solution was then added to the lead acetate solution and cooled over two hours to 46 °C, affording a black precipitate that was filtered and dried for 12 h at 100 °C. Average yield 3.1 g, 75.2%. The synthesis was repeated until 8 g of product had been obtained. Neutron powder diffraction. Data were collected using the D20 instrument at the ILL Grenoble operating in high take-off angle, higher resolution mode. 8 g of finely ground MAPbI3 was placed in a 7 mm diameter vanadium can and cooled in a cryofurnace to 180 K. Data were collected for 90 minutes before further cooling the sample to 100 K. A second 90 min data collection was performed at this temperature before the sample was heated at 0.5 K min−1 to 350 K over 8.5 h. During this temperature ramp diffraction data were collected continuously and binned into five minute blocks corresponding to 2.5 K data resolution. A final data collection over 90 min was performed at 350 K. Raw diffraction data were corrected against detector efficiency and analysed using the GSAS/EXPGUI program suite;13 structure refinements for the long data collections at 100, 180 and 350 K were undertaken as described in the ESI;† SEQGSAS was used to analyse data collected during the heating ramp in sections corresponding to the three regions of phase stability, orthorhombic, 100–165 K; tetragonal 165–327 K and cubic above 327 K. Further details of the crystal structure investigation(s) for the 100 K, 180 K and 350 K data sets may be obtained from the Fachinformationszentrum Karlsruhe, 76344 Eggenstein-Leopoldshafen (Germany), on quoting the depository number CSD 428898 (100 K), 428899 (180 K) and 428900 (352 K) respectively. |
| This journal is © The Royal Society of Chemistry 2015 |

