Design strategies for lab-on-a-molecule probes and orthogonal sensing
Kun
Chen†
a,
Qinghai
Shu†
b and
Michael
Schmittel
*a
aCenter of Micro and Nanochemistry and Engineering, Organische Chemie I, Universität Siegen, Adolf-Reichwein-Str. 2, D-57068 Siegen, Germany. E-mail: schmittel@chemie.uni-siegen.de; Fax: +49 271 740 3270
bSchool of Material Science and Engineering, Beijing Institute of Technology, Beijing 100081, P. R. China
First published on 30th October 2014
Abstract
This review highlights the currently exploited working concepts of lab-on-a-molecule probes, with a particular focus on what is required for multianalyte detection and quantification in competitive assays. Both, chemosensor and chemodosimeter approaches are considered. The multifaceted design strategies and the orthogonal protocols are evaluated in order to identify and categorise the successful conceptions and to single out unknown territory and challenges for future work.
1 Introduction
In the Computer Age, the rapid availability of precise and reliable information is of paramount significance to make correct decisions. Consequently, the systematic development and cost-effective fabrication of sensory devices have become vibrant fields of science and technology as analytical data on (bio)medical and environmental samples as well as their accountable utilisation in appropriate fields are increasingly required. Specifically, molecular sensing in the chemical and biochemical world will provide us with qualitative and quantitative information about the occurrence and amount of molecules and ions in all their facets. The array of analytes encompasses simple gases (hydrogen, oxygen and inert gases),1 explosives,2 and constituents in the environment,3 in food,4 in biological systems and medical applications.5In recent years, the high-density spatial integration of analytical protocols has led to breathtaking developments in the field of lab-on-chip systems.6 Although most of the published work, if taken literally, does rather qualify for chip-in-a-lab systems (a small chip in a large laboratory) there is equally research elaborated being concerned with autonomous lab-on-chip systems. For example, a glass-substrate based lab-on-microchip (Fig. 1, left) was introduced by Schäfer et al.7 using electrochemiluminescence (ECL), while Wu, Baird and coworkers8 reported on lab-on-chip systems patterned at subcellular dimensions to target transmembrane processes.
 | ||
| Fig. 1 (left) Full and zoom-in view of a multipurpose test chip device erected on a glass substrate. The enlargement shows the test area for the electrochemiluminescence assay with its via (golden) to the outside world and the a-Si:H pin diodes (silver) on top of the cover plate.7 Adapted with permission from ref. 7. Copyright 2007 Springer. (right) Fluorescence micrograph of micrometer-size patterned lipid bilayers containing specific ligands used to cluster mast-cell receptors.6a Adapted with permission from ref. 6a. Copyright 2006 Nature Publishing group. | ||
An emerging and fascinating idea to increase spatial density of sensory information is to utilise probes that are designed to detect and quantify several analytes in competitive assays. They are denoted as lab-on-a-molecule9 probes. The underlying idea strongly contrasts the well-known conception of probes driven by a single input signal (the analyte), which have seen a roughly 150 year history starting off with simple colourimetric tests10 developing into the state-of-art environmental and medical probes as used today.
This review analyses the current design strategies for multianalyte lab-on-a-molecule probes with the aim to categorise all successful approaches as well as to identify challenges for future work.
2 Conceptual limitations of probes
According to the IUPAC, a chemical sensor is a device that transforms chemical information, ranging from the concentration of a specific sample component to total composition analysis, into an analytically useful signal. Chemical sensors contain two basic functional units: a receptor part and a transducer part.11 Within the category of molecular chemical sensors, for which the word molecular probe is frequently used, most authors will nowadays differentiate between chemosensors and chemodosimeters. A chemosensor is a molecular probe, in which the interaction with the analyte is fully dynamic, reversible and thus labile. Restrictively, there is no clear definition on the acceptable rates in the equilibration used for sensing. In contrast, a chemodosimeter operates under kinetic control in an irreversible fashion.The IUPAC definition remains quite vague with regard to what is an excellent and what is a mediocre chemical sensor. Accordingly, sensors are normally designed to operate under well defined conditions for specified analytes in certain sample types. Therefore, it is not always necessary that a sensor responds specifically to a certain analyte. Under carefully controlled operating conditions, the analyte signal may be independent of other sample components, thus allowing the determination of the analyte without any major preliminary treatment of the sample.11
Given their multitude and diversity, even single-analyte chemosensors, the objective of countless research efforts, are difficult to assess in a substantiated and scientifically valid manner. One simple reason is that the quality of a chemosensors is not measured up against well defined standards. For example, selectivities of traditional single-analyte chemosensors with their single receptor are usually reported either with regard to (1) single-analyte solutions that are simply juxtaposed for comparison, or (2) restricted competition scenarios using a solution containing two analytes, or (3) in true competition with multianalyte mixtures. It is obvious that in scenario (1) we do not necessarily detect the most strongly binding analyte, but the one generating the largest signal change in the transducer unit. In two-analyte competitions, the signal changes depend on both complexation constants and signal differences. The most realistic setting, however, would require to report on the quantification of the target analyte in the presence of several other closely related analytes as would be typical for a real-world competitive assessment. One can readily imagine that with lab-on-a-molecule probes the situation becomes even much more complicated.
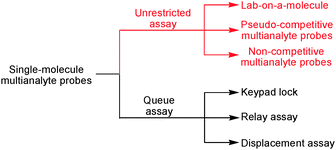
Considering atom economy and high-density integration, chemists have been developing methodologies to implement multianalyte assays in molecular-scale devices. As a result, sensor arrays were advanced in solution12 and at surfaces.13 On the other hand, various concepts relying on a single type of probe have been fostered toward multianalyte analysis, such as lab-on-a-molecule,9 displacement assay,14 relay assay,15 keypad lock16 and so on. The outstanding ability of displacement assays, relay assays and keypad locks to evaluate multiple analytes, however, does not play a major role in real-world sensing because the responses usually depend on the addition sequence (queue assay). In contrast, lab-on-a-molecule probes respond to all analytes in one solution independent of the sequence (unrestricted assay).
When the lab-on-a-molecule approach was proposed first, it was devised by de Silva9a as a molecular logic gate capitalising on Boolean logic17 with a perspective for medical diagnostics and therapy.9b,18 Such examples, which require a semi-quantitative response to a multianalyte mixture and aim at diagnosing an illness on the basis of several analyte concentrations exceeding pre-chosen thresholds, have been reviewed at regular intervals.17 Obviously, orthogonal and quantitative detection of two or more analytes by a single probe is even more challenging, as shown in this review. For this purpose, we critically evaluate recent work focusing on lab-on-a-molecule probes that operate on multianalyte mixtures in a fully quantitative and orthogonal manner.
With regard to competition and quantification issues, unrestricted detection assays may be classified in three categories: firstly, true lab-on-a-molecule probes, secondly, pseudo-competitive multianalyte probes and thirdly, non-competitive multianalyte probes. In this context, a true lab-on-a-molecule probe is able to quantitatively sense two or more analytes in a multianalyte mixture. Such task may be accomplished by probes with several receptor sites or only a single one – in the latter case, the orthogonality of the analytical assay has to arise from using different conditions, in particular different interrogation channels, multi-signaling, kinetic differences (time or temperature), combinatorial chemistry, etc. In contrast, a pseudo-competitive multianalyte probe exhibits different responses to two or more analytes, but fails in a fully competitive quantitative assay. Rather, only one analyte is competitively analysed in the presence of all other constituents. Furthermore, some other pseudo-competitive multianalyte probes allow qualitative identification in a competitive assay but fail in quantification. Finally, according to our classification, a non-competitive multianalyte probe displays different responses to two or more analytes, but no competitive assay is provided (Scheme 1).
Since the concepts of both multiplexed and multimodal sensing have been widely used,19 sometimes though with an ambiguous connotation, we start out by providing definitions for their use in the present review. Thus, probes quantifying distinct analytes in a single interrogation channel are conceived on multiplexed sensing. In some model case below, different analytes were probed in two or more channels, but their quantification was realised in one of the channels only. This type of operation, we also acknowledged as multiplexed sensing. Quite differently, multimodal sensing involves the quantification of different analytes using two or more interrogation channels.
Some probes20 display different selectivity in different solvents and at different pH. From an ideal point of view, such variations do not agree with our definition of a multianalyte assay in a single solution, so that they are not covered in this review.
3 True lab-on-a-molecule probes
The basic concept of a lab-on-a-molecule aims at implementing orthogonal sensing properties in a single probe. At first glance, the approach seems only to be a nice-to-have addendum to the traditional paradigm of “one probe for each analyte”, but it embraces far more than to simply connect two or more single-analyte receptors at a transducer scaffold. Quite evidently, the development of orthogonal sensing protocols demands to recognise the fact that different analytes may interfere both with each others' receptors and their transducer's signaling. Thus, the challenge pertains not only to set up orthogonal and highly selective binding protocols at the receptor sites, but equally to implement non-interfering signaling in the transducer unit.There are different ways to avoid interference with signaling from the transducer unit. The most common ones involve signaling at different wavelengths in UV-Vis, photoluminescence (PL) or electrochemiluminescence (ECL). Alternatively, the clean recognition of different analytes may be achieved by interrogating different channels, e.g. one analyte is quantified in the UV-Vis channel, the other in the PL channel. Some seminal assays21 along these considerations have been performed as early as 1990, but quantitative detection and/or competitive assay and/or mechanistic explanations have remained obscure.
In this chapter, only probes will be endorsed that are able to selectively and orthogonally recognise two or more targets in competitive assays. Thus, the probe should be able to detect and quantify different analytes in a solution of all analytically detectable constituents. Up to now, close to two dozens of true lab-on-a-molecule probes have been reported that will be analysed and discussed. Aside of multianalyte studies using lab-on-molecules, recently a lab-on-graphene with triple-channel sensing22 and lab-on-nanoparticles23 have also generated notable reverberations.
3.1 Lab-on-a-molecules operating on multiplexed sensing
For example, probe 1, as reported by Suzuki and coworkers,27 incorporated multiple chromogenic units linked together at a moderately selective (semiselective) binding site. The three heteroatoms (O, N, S) at the receptor site exhibit different hard-and-soft-acid–base (HSAB) characteristics suggesting distinct responses to individual transition metal ions (Scheme 2). Indeed, selective recognition of cations was possible using the different optical responses at the three donor sites (N-dye: 710 nm, O-dye: 460 nm, S-dye: 380 nm). For quantification, a library of 5 × 5 samples of Cu2+ and Fe3+ was analysed with a back propagation artificial neutral network (BP-ANN). Using the BP-ANN data, the simultaneous determination of Cu2+ and Fe3+ was possible in a mixed solution at a RMSEP (root-mean-square error of prediction) of 4.3 mM for copper and 5.0 μM for iron.
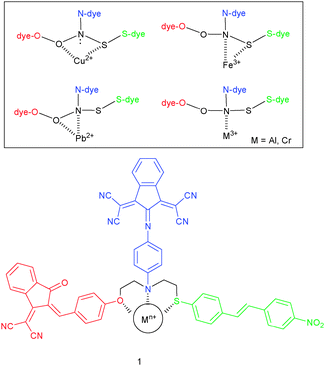 | ||
| Scheme 2 Structure of probe 1 and its different binding modes in the presence of cations.27 | ||
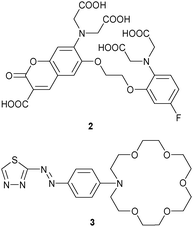
Even if two or more receptor–analyte interactions are fully orthogonal, signal interference may occur when they share a single reporter unit and thus the competitive assay will simply show the sum of the individual responses. For example, probe 2 developed by Suzuki was able to selectively recognise Ca2+ at the O,O′-bis(2-aminophenyl)ethyleneglycol-N,N,N′,N′-tetraacetic acid site and Mg2+ at the β-dicarbonyl receptor under simulated biological conditions (pH 7.20, 50 mM HEPES, 130 mM KCl, 20 mM NaCl) using UV-Vis (λmax for 2 only: 403 nm; +Ca2+: 358 nm; +Mg2+: 424 nm) and fluorescence (λem for 2 only: 480 nm; +Ca2+: 475 nm; +Mg2+: 485 nm).28 However, when Ca2+ and Mg2+ were present in a single solution, UV-Vis and fluorescence showed the sum of all individual responses. To obtain quantitative results for each cation, mixtures of Ca2+ and Mg2+ were measured at different concentrations and a simple algorithm for analysis was applied assuming independent complexation of both analytes. Finally, it should be noted that 2 was successfully loaded into PC12 cells (PC12 is a cell line derived from a pheochromocytoma of the rat adrenal medulla)29 for evaluating simultaneously the intracellular concentrations of Ca2+ and Mg2+, here, however, using their different kinetics in response to a stimulation with a mitochondria uncoupler (= carbonyl cyanide p-trifluoromethoxyphenylhydrazone).
Kaur, Singh and coworker30 reported on the azacrown-ether appended thiadiazole 3 as a dual-analyte probe for Hg2+ and Pb2+. Among a variety of cations including lanthanides, only Hg2+ prompted a red shift in the UV-Vis channel from 491 to 535–574 nm, while Pb2+ caused a blue shift from 491 to 378 nm. The different response was rationalised by adverse effects on the HOMO–LUMO gap. While Hg2+ binds to the thiazolyl moiety, the LUMO residue of the probe, thus decreasing the HOMO–LUMO gap, Pb2+ associates with the crown ether, the HOMO unit, thus enlarging the HOMO–LUMO gap. UV-Vis titrations disclosed a 1![[thin space (1/6-em)]](https://www.rsc.org/images/entities/char_2009.gif) :
:![[thin space (1/6-em)]](https://www.rsc.org/images/entities/char_2009.gif) 1 stoichiometry and comparable binding affinity for both cations, with log
1 stoichiometry and comparable binding affinity for both cations, with log![[thin space (1/6-em)]](https://www.rsc.org/images/entities/char_2009.gif) β = 5.50 for Hg2+ and 5.40 for Pb2+. Both analytes were analysed in a single solution by monitoring the absorbances at 574 nm for Hg2+ and 378 nm for Pb2+.
β = 5.50 for Hg2+ and 5.40 for Pb2+. Both analytes were analysed in a single solution by monitoring the absorbances at 574 nm for Hg2+ and 378 nm for Pb2+.
For the simultaneous detection of Fe3+ and Cu2+, the Callan group31 developed the hybrid chemosensor 4 consisting of a CdSe/ZnS quantum dot with imine-linked phenol receptors mounted onto its surface. The system is characterised by two UV absorptions, one centred at 275 nm and the other at 355 nm. When exposed to various biologically and environmentally relevant cations in THF/HEPES (80![[thin space (1/6-em)]](https://www.rsc.org/images/entities/char_2009.gif) :
:![[thin space (1/6-em)]](https://www.rsc.org/images/entities/char_2009.gif) 20, v/v, pH 7.0), only the addition of Fe3+ exhibited a substantial absorbance increase at both wavelengths, while addition of Cu2+ prompted a considerable bathochromic shift of both absorptions to 295 and 410 nm, respectively. In fact, these changes are so significant that they were readily detected by the naked eye: with Fe3+ a change from colourless to orange and with Cu2+ from colourless to green was witnessed. With both ions having similar binding constants, i.e. log
20, v/v, pH 7.0), only the addition of Fe3+ exhibited a substantial absorbance increase at both wavelengths, while addition of Cu2+ prompted a considerable bathochromic shift of both absorptions to 295 and 410 nm, respectively. In fact, these changes are so significant that they were readily detected by the naked eye: with Fe3+ a change from colourless to orange and with Cu2+ from colourless to green was witnessed. With both ions having similar binding constants, i.e. log![[thin space (1/6-em)]](https://www.rsc.org/images/entities/char_2009.gif) β = 4.86 and 4.69 for Cu2+ and Fe3+, respectively, the selectivity was determined at 325 and 410 nm, because 325 nm represents an isosbestic point for all ions, except for Fe3+. Being a true competitive multianalyte probe, 4 was capable of detecting Cu2+ by a characteristic absorbance at 410 nm in the presence of Fe3+ and of monitoring Fe3+ at 325 nm in the presence of Cu2+ (up to a concentration of 20 μM for the individual cations).
β = 4.86 and 4.69 for Cu2+ and Fe3+, respectively, the selectivity was determined at 325 and 410 nm, because 325 nm represents an isosbestic point for all ions, except for Fe3+. Being a true competitive multianalyte probe, 4 was capable of detecting Cu2+ by a characteristic absorbance at 410 nm in the presence of Fe3+ and of monitoring Fe3+ at 325 nm in the presence of Cu2+ (up to a concentration of 20 μM for the individual cations).
Using Schiff bases as well, the Kumar group advanced two probes for multianalyte detection by monitoring solely the UV-Vis absorbance at different wavelengths (Fig. 2). The chromogenic chemosensor 532 based on 1-aminoanthracene-9,10-dione showed characteristic colour changes only upon addition of Cu2+ (blue, λmax at 600 nm) and Ni2+ (green, λmax at 750 nm), whereas other metal ions did not affect its absorption spectrum (50 mM; pH 7.0; 10 mM HEPES; CH3OH/H2O, 4![[thin space (1/6-em)]](https://www.rsc.org/images/entities/char_2009.gif) :
:![[thin space (1/6-em)]](https://www.rsc.org/images/entities/char_2009.gif) 1, v/v). Individual Cu2+ and Ni2+ concentrations were determined by plotting the absorbances at λmax = 500 nm (due to 5), λmax = 600 nm (due to the 5·Cu2+ complex) and λmax = 750 nm (due to the 5·Ni2+ complex) vs. the conc. of Cu2+ and Ni2+. Competitive quantification was possible due to the similar binding constants log
1, v/v). Individual Cu2+ and Ni2+ concentrations were determined by plotting the absorbances at λmax = 500 nm (due to 5), λmax = 600 nm (due to the 5·Cu2+ complex) and λmax = 750 nm (due to the 5·Ni2+ complex) vs. the conc. of Cu2+ and Ni2+. Competitive quantification was possible due to the similar binding constants log![[thin space (1/6-em)]](https://www.rsc.org/images/entities/char_2009.gif) βML = 5.22 and 5.33 for Cu2+ and Ni2+, respectively. Below a total concentration of 25 μM, the UV-Vis assay was unperturbed when it was read out at well chosen wavelengths, i.e. 642 nm (for Cu2+) and 770 nm (for Ni2+).
βML = 5.22 and 5.33 for Cu2+ and Ni2+, respectively. Below a total concentration of 25 μM, the UV-Vis assay was unperturbed when it was read out at well chosen wavelengths, i.e. 642 nm (for Cu2+) and 770 nm (for Ni2+).
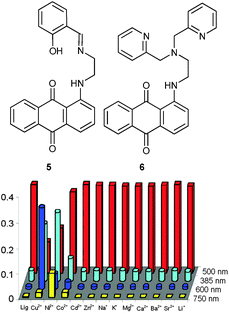 | ||
| Fig. 2 Structures of 5 and 6 (top) and the spectrophotometric response of receptor 5 to various ions (bottom).32 | ||
In a related approach, the same authors replaced the 2-hydroxybenzaldehyde by a dipicolyl amino (DPA) group to prepare the chromogenic chemosensor 6.33 At pH 4.0 (NaOAc–AcOH buffer), 6 experienced a characteristic colour change only upon addition of Co2+ (blue, λmax at 620 nm), Ni2+ (yellowish pink, λmax at 380, 460 and 510 nm) and Cu2+ (yellow, λmax at 460 nm), while other cations did not affect the absorption spectrum. The differential response of 6 to Co2+, Ni2+ and Cu2+ depended on the pH, with only pH ≤ 4 being useful. From titration data, formation of 1![[thin space (1/6-em)]](https://www.rsc.org/images/entities/char_2009.gif) :
:![[thin space (1/6-em)]](https://www.rsc.org/images/entities/char_2009.gif) 1 complexes with log
1 complexes with log![[thin space (1/6-em)]](https://www.rsc.org/images/entities/char_2009.gif) β = 6.75, 5.86 and 7.10 (against Co2+, Ni2+ and Cu2+) was ascertained. As the binding constants differ by one order of magnitude, quantification in a single solution was limited to a total concentration below 30 μM. Given this limitation, absorbance measurements at 620 nm (Co2+) and 416 nm (ratio of Ni2+/Cu2+) allowed determination of Co2+ and Ni2+ or alternatively of Co2+ and Cu2+ within ± 5% error in two-analyte mixtures.
β = 6.75, 5.86 and 7.10 (against Co2+, Ni2+ and Cu2+) was ascertained. As the binding constants differ by one order of magnitude, quantification in a single solution was limited to a total concentration below 30 μM. Given this limitation, absorbance measurements at 620 nm (Co2+) and 416 nm (ratio of Ni2+/Cu2+) allowed determination of Co2+ and Ni2+ or alternatively of Co2+ and Cu2+ within ± 5% error in two-analyte mixtures.
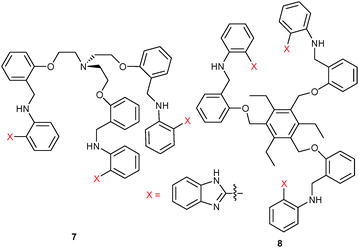
Similar to Kumar's approach, the Jang group explored two lab-on-a-molecule probes based on benzimidazole. With the tripodal receptor 734 they designed a dual-analyte chemosensor displaying rare metal-ion specific fluorescence enhancements at two different wavelengths. In MeCN, the free probe 7 exhibited a weak emission at 415 nm (λex = 361 nm), but upon addition of Cu2+ the emission at 415 nm was almost 10-fold enhanced. In contrast, addition of Fe3+ generated an emission at 475 nm with the PL at 415 nm being fully quenched. The authors assumed that the emission enhancement at 415 nm in the presence of Cu2+ was owed to binding and rigidification of the ligand, which prohibited PET quenching from the lone-pair donors to the fluorophore. Likewise, emission increase at 475 nm was due to interference with PET quenching, while the wavelength shift was attributed to ICT. Simultaneous quantification of Cu2+ and Fe3+ was possible at 415 and 475 nm over a wide range of concentrations. The competitive assay worked because Cu2+ (K = 5.9 × 10³ M−1) and Fe3+ (K = 1.3 × 10³ M−1) have similar binding constants and both form 1![[thin space (1/6-em)]](https://www.rsc.org/images/entities/char_2009.gif) :
:![[thin space (1/6-em)]](https://www.rsc.org/images/entities/char_2009.gif) 1 complexes with 7.
1 complexes with 7.
Based on a C3-substituted benzene as platform for the benzimidazole receptors, Jang and coworkers35 designed the dual-wavelength chemosensor 8 for the simultaneous analysis of Cu2+ and Fe3+ in MeCN/H2O = 7![[thin space (1/6-em)]](https://www.rsc.org/images/entities/char_2009.gif) :
:![[thin space (1/6-em)]](https://www.rsc.org/images/entities/char_2009.gif) 3, v/v (HEPES buffer, pH 7.1). Binding of Cu2+ at the receptor blocked quenching by PET leading to a ca. 1.6-fold emission enhancement at 418 nm, while binding of Fe3+ affected the CT behaviour triggering a new emission at 462 nm. With the help of UV-Vis and luminescence titrations, the 1
3, v/v (HEPES buffer, pH 7.1). Binding of Cu2+ at the receptor blocked quenching by PET leading to a ca. 1.6-fold emission enhancement at 418 nm, while binding of Fe3+ affected the CT behaviour triggering a new emission at 462 nm. With the help of UV-Vis and luminescence titrations, the 1![[thin space (1/6-em)]](https://www.rsc.org/images/entities/char_2009.gif) :
:![[thin space (1/6-em)]](https://www.rsc.org/images/entities/char_2009.gif) 1 binding constants were determined as K = 1.1 × 10³ M−1 and 1.0 × 10³ M−1 for Fe3+ and Cu2+, respectively. Detection limits for Fe3+ and Cu2+ were determined to be as low as 1.19 × 10⁻⁵ M and 1.86 × 10⁻⁵ M. Importantly, quantification of Fe3+ and Cu2+ was not disturbed in the presence of equimolar amounts of other cations at 10 μM concentrations.
1 binding constants were determined as K = 1.1 × 10³ M−1 and 1.0 × 10³ M−1 for Fe3+ and Cu2+, respectively. Detection limits for Fe3+ and Cu2+ were determined to be as low as 1.19 × 10⁻⁵ M and 1.86 × 10⁻⁵ M. Importantly, quantification of Fe3+ and Cu2+ was not disturbed in the presence of equimolar amounts of other cations at 10 μM concentrations.
The pH-inert hetarylazo dye 9 with its N, S donor sites was developed by Kaur et al.36 as a colourimetric sensor for Hg2+ and Fe3+ in MeCN while it was inert to other metal ions including lanthanides (Fig. 3). Due to the fact that the absorption of 9 at 480 nm was split into twin bands at 531 and 564 nm in the presence of Hg2+ or Fe3+, the ratio of Hg2+![[thin space (1/6-em)]](https://www.rsc.org/images/entities/char_2009.gif) :
:![[thin space (1/6-em)]](https://www.rsc.org/images/entities/char_2009.gif) Fe3+ at a total concentration of 2 × 10⁻⁵ M was quantified in a mixture with the help of a calibration library (cf. c(9) = 3 × 10⁻⁵ M). Job plot analysis indicated a 1
Fe3+ at a total concentration of 2 × 10⁻⁵ M was quantified in a mixture with the help of a calibration library (cf. c(9) = 3 × 10⁻⁵ M). Job plot analysis indicated a 1![[thin space (1/6-em)]](https://www.rsc.org/images/entities/char_2009.gif) :
:![[thin space (1/6-em)]](https://www.rsc.org/images/entities/char_2009.gif) 2 (Hg2+
2 (Hg2+![[thin space (1/6-em)]](https://www.rsc.org/images/entities/char_2009.gif) :
:![[thin space (1/6-em)]](https://www.rsc.org/images/entities/char_2009.gif) 9) and 1
9) and 1![[thin space (1/6-em)]](https://www.rsc.org/images/entities/char_2009.gif) :
:![[thin space (1/6-em)]](https://www.rsc.org/images/entities/char_2009.gif) 1 (Fe3+
1 (Fe3+![[thin space (1/6-em)]](https://www.rsc.org/images/entities/char_2009.gif) :
:![[thin space (1/6-em)]](https://www.rsc.org/images/entities/char_2009.gif) 9) binding model, with log β = 8.9 and 8.7. To illustrate its value for real-world applications, 9 was coated on ready-to-use paper strips. Dip-stick sensing of Hg2+ in aqueous solution by colour changes allowed to reach a detection limit as low as 5 × 10⁻³ M.
9) binding model, with log β = 8.9 and 8.7. To illustrate its value for real-world applications, 9 was coated on ready-to-use paper strips. Dip-stick sensing of Hg2+ in aqueous solution by colour changes allowed to reach a detection limit as low as 5 × 10⁻³ M.
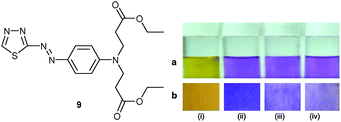 | ||
| Fig. 3 Colours observed for 9 (i) alone and in the presence of (ii) 10−1 M, (iii) 10−2 M and (iv) 5 × 10⁻³ M Hg2+ in (a) solution and (b) on coated dip sticks.36 Adapted with permission from ref. 36. Copyright 2011, Elsevier. | ||
Using excess of the probe with regard to all strongly binding analytes works best if the analytes have comparable binding constants and generate nicely separated signals. This method is limited to samples with roughly known concentrations, though.
3.2 Lab-on-a-molecules operating on multimodal sensing
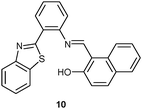
![[thin space (1/6-em)]](https://www.rsc.org/images/entities/char_2009.gif) :
:![[thin space (1/6-em)]](https://www.rsc.org/images/entities/char_2009.gif) 2, v/v, pH = 7.6). Addition of Fe3+ generated complex 10·Fe3+ (K = 2.9 × 10⁵ M−1) and triggered a 16-fold PL enhancement at 440 nm by suppressing PET and improving rigidity. In the UV-Vis channel, probe 10 selected HSO4− as a 1
2, v/v, pH = 7.6). Addition of Fe3+ generated complex 10·Fe3+ (K = 2.9 × 10⁵ M−1) and triggered a 16-fold PL enhancement at 440 nm by suppressing PET and improving rigidity. In the UV-Vis channel, probe 10 selected HSO4− as a 1![[thin space (1/6-em)]](https://www.rsc.org/images/entities/char_2009.gif) :
:![[thin space (1/6-em)]](https://www.rsc.org/images/entities/char_2009.gif) 1 adduct (K = 1.8 × 10² M−1) over all other anions due to hydrogen bonding (–OH and –C
1 adduct (K = 1.8 × 10² M−1) over all other anions due to hydrogen bonding (–OH and –C![[double bond, length as m-dash]](https://www.rsc.org/images/entities/char_e001.gif) NH group) as monitored by a shift of the absorption band from 310 to 365 nm. Quantification of HSO4− and Fe3+ was achieved using the absorbance at 365 nm and emission at 440 nm, respectively. Notably, detection of Fe3+ in the PL channel was not disturbed in the presence of HSO4− and vice versa in a mixture of [Fe3+] = [HSO4−] = 20 μM.
NH group) as monitored by a shift of the absorption band from 310 to 365 nm. Quantification of HSO4− and Fe3+ was achieved using the absorbance at 365 nm and emission at 440 nm, respectively. Notably, detection of Fe3+ in the PL channel was not disturbed in the presence of HSO4− and vice versa in a mixture of [Fe3+] = [HSO4−] = 20 μM.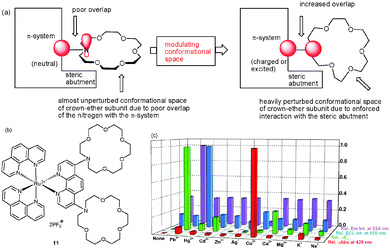 | ||
| Fig. 4 (a) Explanation for the different selectivities of probe 11 in PL and ECL, (b) structure of 11, and (c) diagram of the relative UV-Vis, PL, ECL and redox potential changes of probe 11 in the presence of various cations.38a | ||
Various metal ions, such as Pb2+, Hg2+, Cd2+, Zn2+, Ag+, Cu2+, Ca2+, Mg2+, K+, and Na+ ions, were tested using UV-Vis/NIR, PL, CV and ECL as interrogation methods. In the UV-Vis channel, only Cu2+ ions caused a notable response in the MLCT intensity of 11 and a diagnostic metal-to-metal charge-transfer (MMCT) absorption in the near-IR (NIR) region at 1083 nm. Titration of 11 with Cu2+ ions at 429 nm revealed a one-step association sequence with log βCu2+ = 10.7 ± 0.2. In both CV and PL channels, 11 showed selectivity toward Pb2+, with PL being highly characteristic due to an emission enhancement with a parallel blue shift from 672 to 624 nm. In contrast, the ECL channel exhibited a high selectivity toward Hg2+ with minor interferences by Ag+ ions. Remarkably, a characteristic ECL enhancement (I/I0 = 8.2) was found for Hg2+ ions, allowing to detect Hg2+ ions down to the ppm range in the presence of many other cations. Quantitative correlations enabled quantification of all three cations in a mixture without interference.
Another successful strategy for lab-on-a-molecule probes aims at utilising the different selectivities in ground and excited state. In 2009, the polymeric single-binding-site chemosensor 12 was investigated by the Callan group using two-channel interrogation.39 The iminophenol receptor was readily prepared from commercially available 15 kDa poly(allylamine) (PAA) with 2-hydroxy-1-naphthaldehyde. Probe 12 is able to detect and quantify Ag+ and Mn2+ by absorbance and luminescence in THF![[thin space (1/6-em)]](https://www.rsc.org/images/entities/char_2009.gif) :
:![[thin space (1/6-em)]](https://www.rsc.org/images/entities/char_2009.gif) H2O (9
H2O (9![[thin space (1/6-em)]](https://www.rsc.org/images/entities/char_2009.gif) :
:![[thin space (1/6-em)]](https://www.rsc.org/images/entities/char_2009.gif) 1, v/v) at pH 7.0 (HEPES buffer). Upon addition of Ag+, notable absorption enhancements were observed at 310 and 418 nm leading to a yellow colour, which is not seen for other cations. A linear correlation between absorbance and concentration (at μM) was established. In the PL channel, Mn2+ showed a notable emission increase at 357 nm (along with a distinct small red shift) due to locking the imine configuration. Because the system exhibits an isoemissive point at 492 nm, a ratiometric test (I385/I492) was implemented to determine Mn2+. The different selectivity in both channels was explained by assuming that the preference for Ag+ in the UV-Vis channel arises from binding to the iminophenol tautomer, while in PL the ketoenamine tautomer produced by excited state intramolecular proton transfer (ESIPT) has a higher selectivity for Mn2+. While probe 12 is based on a powerful multianalyte strategy, unfortunately, its full potential for competitive multianalyte sensing was not demonstrated.
1, v/v) at pH 7.0 (HEPES buffer). Upon addition of Ag+, notable absorption enhancements were observed at 310 and 418 nm leading to a yellow colour, which is not seen for other cations. A linear correlation between absorbance and concentration (at μM) was established. In the PL channel, Mn2+ showed a notable emission increase at 357 nm (along with a distinct small red shift) due to locking the imine configuration. Because the system exhibits an isoemissive point at 492 nm, a ratiometric test (I385/I492) was implemented to determine Mn2+. The different selectivity in both channels was explained by assuming that the preference for Ag+ in the UV-Vis channel arises from binding to the iminophenol tautomer, while in PL the ketoenamine tautomer produced by excited state intramolecular proton transfer (ESIPT) has a higher selectivity for Mn2+. While probe 12 is based on a powerful multianalyte strategy, unfortunately, its full potential for competitive multianalyte sensing was not demonstrated.
Recently, Schmittel40 established the non-luminescent bis(ferrocenyl)phenanthroline iridium(III) complex 13 as a chemosensor for cyanide and fluoride in aqueous solution via PL and ECL. Cyanide triggered a 130-fold enhancement at 580 nm in the PL channel due to a displacement of the phenanthroline ligand by CN−. Under oxidative ECL conditions, the displacement was suppressed due to oxidation of CN−, while addition of F− induced a 60-fold emission enhancement at 605 nm. The latter effect was due to preventing intramolecular electron transfer oxidation of the excited state through the ferrocenium unit by forming a strong F−⋯Fc+ ion pair (Scheme 3). A competitive assay corroborated the feasibility of quantitative detection of both anions without interference in the presence of not only each other but equally other anions (Cl−, Br−, I−, PF6−, BF4−, HSO4−, AcO− and H2PO4−).
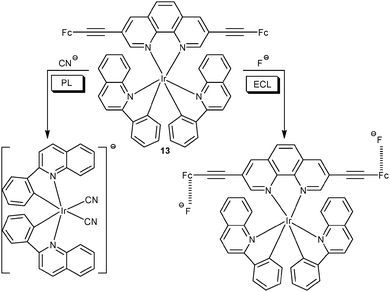 | ||
| Scheme 3 Sensing mechanism of probe 13 as a dual-channel lab-on-a-molecule for anion detection.40 | ||
Taking iridium(III) complex [(pq)2IrCl]2 (14) as dual-channel lab-on-a-molecule, the Schmittel group has recently reported on a two-anion assay in aqueous solution at physiological pH.41 Probe 14 operates as a quantitative chemodosimeter for cyanide and acetate using PL and ECL interrogation (Scheme 4). In the PL channel, cyanide exhibited a selective response due to forming a strongly luminescent dicyano iridium complex emitting at 579 nm, while in the ECL channel only acetate displayed a strong luminescence enhancement (at 609 nm, >25-fold). The change of selectivity was revealed: in the ECL channel, cyanide did not survive under the oxidative conditions due to its low oxidation potential. In addition, the anodic potential triggered oxidation of acetate, followed by loss of carbon dioxide and formation of the methyl radical. The latter combined with the iridium(IV) complex to furnish the corresponding methyl iridium compound. In summary, the overall scenario corresponds to a Kolbe electrolysis and a follow-up radical–metal combination. In both channels, competition experiments were carried out in the presence of many anions without interference.
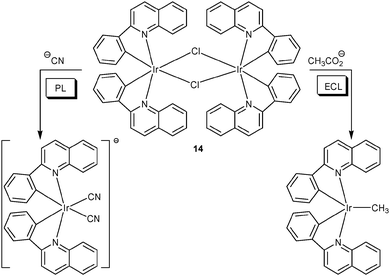 | ||
| Scheme 4 Sensing mechanism of probe 14 as a dual-channel lab-on-a-molecule for anion detection.41 | ||
Dual-channel sensing was also useful in quantifying cysteine (Cys)–homocysteine (Hcy) and tryptophan (Trp) in an aqueous mixture of all proteinogenic amino acids at physiological pH (Scheme 5). The lab-on-a-molecule chemodosimeter 1542 with its reactive aldehyde group was designed by Chen and Schmittel to respond in the UV-Vis and PL channel toward Cys/Hcy through formation of the thiazolidine (or thiazinane) subunit enhancing PL at 606 nm to 210%. In contrast, Trp was selectively detected at the same wavelength in the ECL channel by fully quenching the emission. The unique quenching is based on the fact that under oxidative conditions Trp is selectively destroyed and that the slow reaction with Cys/Hcy does not interfere with the rapid ECL assay.
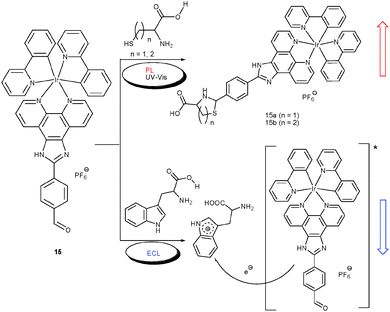 | ||
| Scheme 5 Sensing mechanisms of probe 15 as a triple-channel lab-on-a-molecule for amino acids.42 | ||
Along the same line, Sojic, Pinet and co-workers43 reported on the 3,3′-functionalised guanidinium bipyridylruthenium(II) complex 16 as a differential chemosensor for L-glutamate and dihydrogenphosphate anions in acetonitrile (Scheme 6). Among a variety of anions, L-glutamate enhanced the PL intensity (up to four-fold) with a concomitant blue shift from 712 to 675 nm due to a selective binding between both guanidinium sites, while dihydrogenphosphate induced a similar response but a 3-fold enhancement. In contrast, ECL interrogation exhibited a high selectivity toward dihydrogenphosphate only, displaying a similar 4-fold enhancement at 712 nm with a blue shift to 675 nm. L-glutamate as a competitor for the same binding site was fully oxidised at the high anodic potential required for ECL generation and thus did not show up in ECL. A competitive ECL and PL assay of a mixture of anions confirmed 16 as a lab-on-a-molecule.
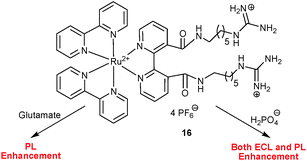 | ||
| Scheme 6 Probe 16 as a dual-channel lab-on-a-molecule for glutamate and dihydrogenphosphate.43 | ||
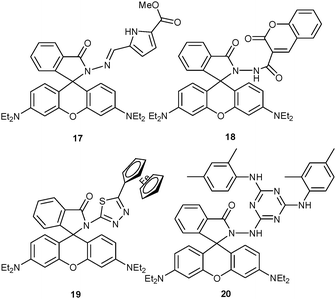
Besides iridium and ruthenium complexes, rhodamine derivatives have equally demonstrated their usefulness in multichannel lab-on-a-molecule chemosensing, preferentially due to intense spectral changes in UV-Vis and PL upon opening the spirolactam ring. In 2011, Nandhakumar, Tang and coworkers44 described the rhodamine B Schiff base 17 as a dual chemosensor for both Cu2+ and Hg2+ ions in MeOH–HEPES buffered solution (pH = 7.4, 3![[thin space (1/6-em)]](https://www.rsc.org/images/entities/char_2009.gif) :
:![[thin space (1/6-em)]](https://www.rsc.org/images/entities/char_2009.gif) 1, v/v). Cu2+ formed a 1
1, v/v). Cu2+ formed a 1![[thin space (1/6-em)]](https://www.rsc.org/images/entities/char_2009.gif) :
:![[thin space (1/6-em)]](https://www.rsc.org/images/entities/char_2009.gif) 1 complex with 17 (Ka = 2.44 × 10⁵ M−1) while triggering spirolactam opening along with a hyperchromic effect at 556 nm in the UV-Vis channel. Due to its paramagnetic nature, the strong Cu2+ complex did not show any significant emission in the PL channel. In contrast, 20 equiv. of Hg2+ induced a significant PL enhancement at 583 nm that did not interfere with other cations added in equimolar amounts to Hg2+. The PL titration disclosed a low binding affinity for 17·Hg2+ with Ka = 3.4 × 10² M−1. The quantification of both cations in a mixed sample containing Hg2+ and Cu2+ = 1
1 complex with 17 (Ka = 2.44 × 10⁵ M−1) while triggering spirolactam opening along with a hyperchromic effect at 556 nm in the UV-Vis channel. Due to its paramagnetic nature, the strong Cu2+ complex did not show any significant emission in the PL channel. In contrast, 20 equiv. of Hg2+ induced a significant PL enhancement at 583 nm that did not interfere with other cations added in equimolar amounts to Hg2+. The PL titration disclosed a low binding affinity for 17·Hg2+ with Ka = 3.4 × 10² M−1. The quantification of both cations in a mixed sample containing Hg2+ and Cu2+ = 1![[thin space (1/6-em)]](https://www.rsc.org/images/entities/char_2009.gif) :
:![[thin space (1/6-em)]](https://www.rsc.org/images/entities/char_2009.gif) 1 was investigated. Up to 12 μM, quantification of Cu2+ was not disturbed by Hg2+ in the UV-Vis channel. On the other hand, quantification of Hg2+ in the presence of Cu2+ was feasible up to 1 mM.
1 was investigated. Up to 12 μM, quantification of Cu2+ was not disturbed by Hg2+ in the UV-Vis channel. On the other hand, quantification of Hg2+ in the presence of Cu2+ was feasible up to 1 mM.
Later, the same group45 reported on a dual-analyte assay for Fe3+ and Cu2+ using the fluorochromic rhodamine B–coumarin conjugate 18 in HEPES buffered MeCN–H2O aqueous solution (1![[thin space (1/6-em)]](https://www.rsc.org/images/entities/char_2009.gif) :
:![[thin space (1/6-em)]](https://www.rsc.org/images/entities/char_2009.gif) 1, v/v, 50 mM HEPES, pH 7.0). With 18, Cu2+ formed a 1
1, v/v, 50 mM HEPES, pH 7.0). With 18, Cu2+ formed a 1![[thin space (1/6-em)]](https://www.rsc.org/images/entities/char_2009.gif) :
:![[thin space (1/6-em)]](https://www.rsc.org/images/entities/char_2009.gif) 1 complex (Ka = 2.44 × 10⁵ M−1) that was readily recognised in the absorption mode due to the appearance of a new band centred at 563 nm indicative of spirolactam opening. The characteristic colour change from colourless to pink was reversed upon addition of EDTA. Other cations, even Fe3+ that formed a 1
1 complex (Ka = 2.44 × 10⁵ M−1) that was readily recognised in the absorption mode due to the appearance of a new band centred at 563 nm indicative of spirolactam opening. The characteristic colour change from colourless to pink was reversed upon addition of EDTA. Other cations, even Fe3+ that formed a 1![[thin space (1/6-em)]](https://www.rsc.org/images/entities/char_2009.gif) :
:![[thin space (1/6-em)]](https://www.rsc.org/images/entities/char_2009.gif) 1 complex (Ka = 1.7 × 10⁴ M−1), did not interfere with the determination of Cu2+ in competitive assays, unless Fe3+ was added in huge excess (>25 equiv.). On the other hand, Fe3+ was highly selectively monitored by a significant PL enhancement at λem = 586 nm that was due to a reversible iron-induced ring-opening of the rhodamine's spirolactam. Although Cu2+ opens up the lactam even more effectively, the resultant complex is basically invisible in the assay, because its luminescence is rather low due to the paramagnetic nature of copper(II).
1 complex (Ka = 1.7 × 10⁴ M−1), did not interfere with the determination of Cu2+ in competitive assays, unless Fe3+ was added in huge excess (>25 equiv.). On the other hand, Fe3+ was highly selectively monitored by a significant PL enhancement at λem = 586 nm that was due to a reversible iron-induced ring-opening of the rhodamine's spirolactam. Although Cu2+ opens up the lactam even more effectively, the resultant complex is basically invisible in the assay, because its luminescence is rather low due to the paramagnetic nature of copper(II).
Using a related strategy, Miao, Zhao and coworkers46 established probe 19 for Hg2+ and Cu2+ based on a 5-ferrocenyl-1,3,4-thiadiazole rhodamine B conjugate. In HEPES buffered MeCN–H2O solution (8![[thin space (1/6-em)]](https://www.rsc.org/images/entities/char_2009.gif) :
:![[thin space (1/6-em)]](https://www.rsc.org/images/entities/char_2009.gif) 2, v/v, pH = 7.2) Cu2+ formed a 1
2, v/v, pH = 7.2) Cu2+ formed a 1![[thin space (1/6-em)]](https://www.rsc.org/images/entities/char_2009.gif) :
:![[thin space (1/6-em)]](https://www.rsc.org/images/entities/char_2009.gif) 1 complex with 19 (K = 1.73 × 10⁴ M−1) leading to lactam-ring opening and a new absorption band centred at 554 nm. Due to the perceptible colour changes, 19 was a naked-eye probe for Cu2+. Although Fe3+, Cr3+ and Hg2+ reduced the absorbance toward Cu2+ in competitive assays, the absorption increase was still distinctive. Yet, the quantitative assay of Cu2+ may be somewhat hampered. One of the interfering cations, i.e. Hg2+, formed an equally strong 1
1 complex with 19 (K = 1.73 × 10⁴ M−1) leading to lactam-ring opening and a new absorption band centred at 554 nm. Due to the perceptible colour changes, 19 was a naked-eye probe for Cu2+. Although Fe3+, Cr3+ and Hg2+ reduced the absorbance toward Cu2+ in competitive assays, the absorption increase was still distinctive. Yet, the quantitative assay of Cu2+ may be somewhat hampered. One of the interfering cations, i.e. Hg2+, formed an equally strong 1![[thin space (1/6-em)]](https://www.rsc.org/images/entities/char_2009.gif) :
:![[thin space (1/6-em)]](https://www.rsc.org/images/entities/char_2009.gif) 1 complex (K = 2.46 × 10⁴ M−1) that was readily detectable in PL at 585 nm by a 27-fold enhancement. Importantly, the fluorescence enhancement was not disturbed by adding 2 equiv. of other cations. Even interference from Cu2+ was low, despite the similar binding affinities of Cu2+ and Hg2+ to 19 due to the low luminescence of the ring-opened paramagnetic complex 19·Cu2+.
1 complex (K = 2.46 × 10⁴ M−1) that was readily detectable in PL at 585 nm by a 27-fold enhancement. Importantly, the fluorescence enhancement was not disturbed by adding 2 equiv. of other cations. Even interference from Cu2+ was low, despite the similar binding affinities of Cu2+ and Hg2+ to 19 due to the low luminescence of the ring-opened paramagnetic complex 19·Cu2+.
Very recently, Yan and coworkers47 adopted the same strategy to advance the reversible chemosensor 20 for Cu2+ and Hg2+ in EtOH–HEPES buffered solution (20.0 mM HEPES, 30![[thin space (1/6-em)]](https://www.rsc.org/images/entities/char_2009.gif) :
:![[thin space (1/6-em)]](https://www.rsc.org/images/entities/char_2009.gif) 70, v/v, pH 7.0). Cu2+ triggered a ring-opening at the spirolactam with a concomitant absorption at 558 nm in the UV-Vis channel but without significant PL enhancement due to its paramagnetic nature. UV-Vis titration of 20 with Cu2+ indicated formation of a strong 1
70, v/v, pH 7.0). Cu2+ triggered a ring-opening at the spirolactam with a concomitant absorption at 558 nm in the UV-Vis channel but without significant PL enhancement due to its paramagnetic nature. UV-Vis titration of 20 with Cu2+ indicated formation of a strong 1![[thin space (1/6-em)]](https://www.rsc.org/images/entities/char_2009.gif) :
:![[thin space (1/6-em)]](https://www.rsc.org/images/entities/char_2009.gif) 1 complex (Ka = 1.19 × 10⁴ M−1). In contrast, Hg2+ induced ring-opening of the spirolactam without significant change in the UV-Vis channel but distinct enhancement in the PL channel. A PL titration of 20 with Hg2+ equally disclosed a 1
1 complex (Ka = 1.19 × 10⁴ M−1). In contrast, Hg2+ induced ring-opening of the spirolactam without significant change in the UV-Vis channel but distinct enhancement in the PL channel. A PL titration of 20 with Hg2+ equally disclosed a 1![[thin space (1/6-em)]](https://www.rsc.org/images/entities/char_2009.gif) :
:![[thin space (1/6-em)]](https://www.rsc.org/images/entities/char_2009.gif) 1 stoichiometry for 20·Hg2+ (Ka = 3.4 × 10⁶ M−1). Both responses were reversed by adding EDTA to remove both metal ions. Due to its higher binding affinity, the fluorogenic response to Hg2+ (2 equiv.) was not disturbed in the presence of 10 equiv. of other cations. Similarly, the colourimetric response to Cu2+ (2 equiv.) was not compromised by 10 equiv. of other cations due to the higher extinction coefficient of 20·Cu2+.
1 stoichiometry for 20·Hg2+ (Ka = 3.4 × 10⁶ M−1). Both responses were reversed by adding EDTA to remove both metal ions. Due to its higher binding affinity, the fluorogenic response to Hg2+ (2 equiv.) was not disturbed in the presence of 10 equiv. of other cations. Similarly, the colourimetric response to Cu2+ (2 equiv.) was not compromised by 10 equiv. of other cations due to the higher extinction coefficient of 20·Cu2+.
By virtue of the dramatic spectroscopic changes that go along with the spirolactam-rhodamine ring opening and the severe quenching effect of Cu2+, probes 17–20 were able to quantify Cu2+ aside of other metal ions. In most cases, limitations of the overall analyte concentrations and the analyte ratio were crucial to achieve orthogonal quantification.
Aside of rhodamines, other emissive molecules may also be adopted for lab-on-a-molecule probes. Inspired by the chromophore in the green fluorescent protein, Long and James48 designed the highly conjugated dual-channel probe 21 to assess Hg2+ and Zn2+. The probe formed a 1![[thin space (1/6-em)]](https://www.rsc.org/images/entities/char_2009.gif) :
:![[thin space (1/6-em)]](https://www.rsc.org/images/entities/char_2009.gif) 1 complex (2.3 × 10⁴ M−1) with Hg2+ showing an intense hypochromic effect at 400 nm and a little hyperchromic effect at 550 nm in the UV-Vis channel. This response was not disturbed by other cations. On the other hand, Zn2+ induced a strong emission at 474 nm by forming a 1
1 complex (2.3 × 10⁴ M−1) with Hg2+ showing an intense hypochromic effect at 400 nm and a little hyperchromic effect at 550 nm in the UV-Vis channel. This response was not disturbed by other cations. On the other hand, Zn2+ induced a strong emission at 474 nm by forming a 1![[thin space (1/6-em)]](https://www.rsc.org/images/entities/char_2009.gif) :
:![[thin space (1/6-em)]](https://www.rsc.org/images/entities/char_2009.gif) 1 complex with 21 at Ka = 2.1 × 10³ M−1. In competition experiments, the PL enhancement was quenched by Hg2+ and Cu2+ due to spin–orbit coupling and paramagnetic effects, respectively. Using thiourea as a masking agent, the disturbance from Hg2+ and Cu2+ was eliminated and quantification of Zn2+ became feasible.
1 complex with 21 at Ka = 2.1 × 10³ M−1. In competition experiments, the PL enhancement was quenched by Hg2+ and Cu2+ due to spin–orbit coupling and paramagnetic effects, respectively. Using thiourea as a masking agent, the disturbance from Hg2+ and Cu2+ was eliminated and quantification of Zn2+ became feasible.
Very recently, Chen and Schmittel49 developed the first triple-anion probe based on the iridium(III)–imidazolium conjugate 22. F− deprotonated the phenanthroline methylene group of 22 – as indicated by H/D exchange and a 1![[thin space (1/6-em)]](https://www.rsc.org/images/entities/char_2009.gif) :
:![[thin space (1/6-em)]](https://www.rsc.org/images/entities/char_2009.gif) 2 ratio in 22·(F−)2 (log β = 9.71 ± 0.30) – leading to a new charge transfer band at 457 nm in the UV-Vis. This response was disturbed by the acidic anions H2PO4− and HSO4−. In the PL channel, H2PO4− triggered a 7-fold enhancement along with a blue shift from 660 to 607 nm, which is readily explained by replacing the original luminescence from a low-lying triplet state (of the auxiliary ligand) with an MLCT emission. Among a series of anions, the disturbing F− was masked by adding Me3SiCl. In the ECL channel, 22 exhibited a remarkable selectivity toward AcO− over all other anions by displaying an enhancement at 605 nm with a slight blue shift. With the help of single-anion calibration curves, probe 22 (10 μM) quantified F− as 10.9 μM, H2PO4− as 8.2 μM and AcO− as 0.18 mM from a mixture of three anions ([F−] = [H2PO4−] = 10 μM, [AcO−] = 0.20 mM).
2 ratio in 22·(F−)2 (log β = 9.71 ± 0.30) – leading to a new charge transfer band at 457 nm in the UV-Vis. This response was disturbed by the acidic anions H2PO4− and HSO4−. In the PL channel, H2PO4− triggered a 7-fold enhancement along with a blue shift from 660 to 607 nm, which is readily explained by replacing the original luminescence from a low-lying triplet state (of the auxiliary ligand) with an MLCT emission. Among a series of anions, the disturbing F− was masked by adding Me3SiCl. In the ECL channel, 22 exhibited a remarkable selectivity toward AcO− over all other anions by displaying an enhancement at 605 nm with a slight blue shift. With the help of single-anion calibration curves, probe 22 (10 μM) quantified F− as 10.9 μM, H2PO4− as 8.2 μM and AcO− as 0.18 mM from a mixture of three anions ([F−] = [H2PO4−] = 10 μM, [AcO−] = 0.20 mM).
4 Pseudo-competitive multianalyte probes
Often authors claim to detect and quantify more than one analyte with their probe, but do not perform an analytic assay in a solution containing all target analytes. As we have emphasised above, lab-on-a-molecule probes use orthogonal protocols to detect and quantify two or more analytes without (severe) interference. In this chapter, we will acknowledge multianalyte probes that do not rigorously match the requirements of true lab-on-a-molecules, i.e. they lack a report on the quantification or even fail in a fully competitive assay. We denote these systems as pseudo-competitive multianalyte probes.It should be noted that pseudo-competitive multianalyte probes have to exhibit clearly distinguishable spectroscopic output signals for each target analyte to fit the category. As such, their evaluation tells us a lot about currently used strategies and tricks for analyte differentiation.
4.1 Multianalyte probes operating on multiplexed sensing
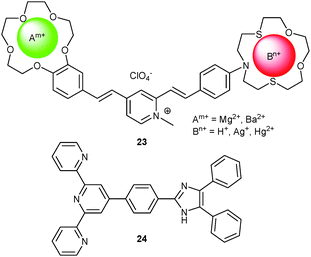
4.1.1.1 Profiting from cross-interference among interaction/binding sites. In comparison with a single-site multianalyte probe, the combination of two or more receptors on a scaffold is rather straightforward, if each receptor has its own signaling unit. Nonetheless, integrating two or more receptors usually is not the simple sum of all individual receptors because cross-interference is widespread. Fedorova and coworkers50 reported on an intelligent multitasking probe bearing two independent ditopic receptors for multianalyte analysis. The device 23 consisted of two specific functional groups, one being a benzo-15-crown-5 ether displaying selective binding toward alkaline earth metal ions such as Mg2+ and Ba2+, while the other was a phenylazathia-15-crown-5 ether showing strong affinity to the soft and heavy metal ions Hg2+ and Ag+. NMR measurements indicated that formation of the bimetallic complex was affected by negative heterotopic cooperativity due to Coulomb repulsion. Electrochemical results revealed the HOMO to be located on the crown ether motifs and the LUMO on the pyridinium fragment. Steady-state and time-resolved fluorescence disclosed that ICT processes in 23 from both crown ether residues to the N-methylpyridinium did not interfere. Binding of different cations, however, altered the ICT processes and relaxation mechanisms generating a PL at 396 nm for Mg2+ and Ba2+ and one at 490 nm for Ag+, Hg2+ and H+. The lifetimes were used to qualitatively differentiate the ions, thus providing a new strategy toward multianalyte probes.
Baitalik and coworkers51 amalgamated both cation (terpyridine) and anion (imidazole) receptors in probe 24. Among a series of cations, only Fe2+ induced an intense hyperchromic effect at 575 nm by interacting with 2 equiv. of 24. Although other cations equally triggered some changes at other wavelengths, they did not disturb the response towards Fe2+ (24![[thin space (1/6-em)]](https://www.rsc.org/images/entities/char_2009.gif) :
:![[thin space (1/6-em)]](https://www.rsc.org/images/entities/char_2009.gif) Fe2+:
Fe2+:![[thin space (1/6-em)]](https://www.rsc.org/images/entities/char_2009.gif) other cation = 1
other cation = 1![[thin space (1/6-em)]](https://www.rsc.org/images/entities/char_2009.gif) :
:![[thin space (1/6-em)]](https://www.rsc.org/images/entities/char_2009.gif) 0.5
0.5![[thin space (1/6-em)]](https://www.rsc.org/images/entities/char_2009.gif) :
:![[thin space (1/6-em)]](https://www.rsc.org/images/entities/char_2009.gif) 0.5). Among a series of anions, only F− and OH− generated a shift from 341 to 420 nm due to deprotonation at the imidazole. The quantification of F− in the presence of Fe2+ and reciprocally of Fe2+ in the presence of F− was not realised.
0.5). Among a series of anions, only F− and OH− generated a shift from 341 to 420 nm due to deprotonation at the imidazole. The quantification of F− in the presence of Fe2+ and reciprocally of Fe2+ in the presence of F− was not realised.
With cross-interference being common, one searches for ways to benefit from interferences for better differentiation of analytes. For instance, placing two or more receptors in close proximity may give rise to major interferences, by e.g. conformational hindrance, resonance interaction etc., providing additional strategic options, e.g. FRET, ESIPT etc., to read out multianalyte mixtures.
Along these considerations, a fluorescent probe with BODIPY and rhodamine units has been designed by Li and coworkers52 for the selective detection of Hg2+ and Ba2+ ions. Upon adding Hg2+ to 25 (Scheme 7), the appearance of an absorption at 558 nm attested ring opening of the rhodamine chromophore. In contrast, addition of Ba2+ induced a PL enhancement due to suppressing PET quenching from the calixarene to BODIPY. No competitive assay was demonstrated. Owed to the occurrence of FRET from BODIPY to rhodamine in the presence of both Hg2+ and Ba2+, this system may also be used as an INHIBIT and YES logic gate.
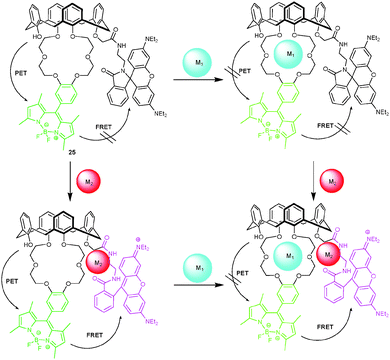 | ||
| Scheme 7 Proposed complexation scenario of the reaction of probe 25 with different ions.52 | ||
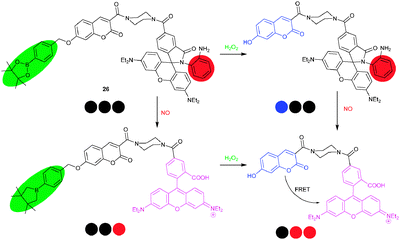
A similar system, i.e.26, was conceived for the detection of reactive oxygen species (ROS) and reactive nitrogen species (RNS), important targets due to their role in physiological processes,5 by Lin and coworkers.53 H2O2 cleaved the borate ester of 26 thus reducing PET quenching along with fluorescence recovery of the coumarin residue at 460 nm. Quite differently, NO triggered the ring-opening of the spirolactam accompanied by rhodamine emission at 580 nm. A mixture of H2O2 and NO, lastly, promoted a FRET from coumarin to rhodamine. In sum, 26 was able to sense H2O2, NO, and H2O2/NO via characteristic fluorescence signal patterns (at three λem using two λex) of blue–black–black, black–black–red and black–red–red, respectively (Scheme 8). Macrophage experiments demonstrated that probe 26 was able to respond to either or both of H2O2 and NO in a cell environment.
 | ||
| Scheme 8 Sensing mechanism of probe 26 for the detection of H2O2 and/or NO.53 | ||
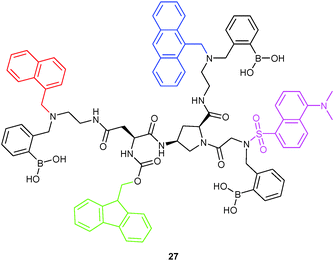
4.1.1.2 Profiting from mathematical algorithms. Combining lab-on-a-molecule and sensor array concepts, Margulies and coworkers54 developed probe 27 by mounting four dye molecules with different emissive wavelengths onto a cis-amino-L-proline scaffold. The coexistence of PET, ICT and FRET made it possible to set up unique optical signatures. By monitoring the PL intensity at different wavelengths, probe 27 was able to differentiate 13 drug molecules via a 2D recognition pattern using principal component analysis (PCA). For instance, it distinguished different ratios of D-xylose and rifampicin in human urine and unknown urine–drug samples with a 97% success rate, pointing the way toward lab-on-a-molecule diagnostics. However, quantification was not fully addressed.
4.1.2.1 Profiting from prototropic effects at the binding site. Because the wavelength of absorption or PL is quite sensitive to electron density, an analyte-induced (de)protonation next to the reporter unit is an effective strategy to generate different signals with different analytes.
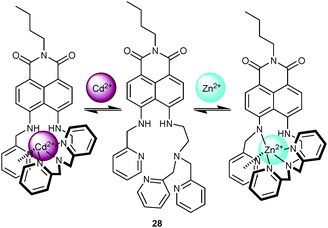
While metal cations of similar size or from the same group in the periodic table often lead to comparable spectral changes, they may entail vastly different responses if they affect deprotonation at the chemosensor. For example, Qian and coworkers55 successfully combined two ICT (internal charge transfer) processes to discriminate Cd2+ and Zn2+. By mounting both a DPA and a 2-picolyl binding motif onto a 1,8-naphthalimide reporter unit, the resultant probe 28 (Scheme 9) was able to distinguish Cd2+ by a hypochromic effect at 460 nm in the UV-Vis channel (with an isosbestic point at 420 nm) and an emission enhancement along with a blue shift from 531 to 487 nm in the PL channel. Binding of Cd2+ at both DPA and 2-picolyl group is able to suppress electron donation by the NH moiety. On the other hand, addition of Zn2+ prompted a shift from 460 to 492 nm in the UV-Vis channel and emission quenching along with a shift from 531 to 558 nm. Both the red shift and quenching of emission in 28·Zn2+ were attributed to deprotonation at one of the secondary amines. PL titrations disclosed 1![[thin space (1/6-em)]](https://www.rsc.org/images/entities/char_2009.gif) :
:![[thin space (1/6-em)]](https://www.rsc.org/images/entities/char_2009.gif) 1 complexes for both 28·Zn2+ (1.65 × 10⁵ M−1) and 28·Cd2+ (5.75 × 10⁵ M−1). Due to the stronger binding of Cd2+, its quantification was not disturbed by Zn2+, whereas the heavy quenchers Co2+ and Cu2+ erased any emission enhancement of 28·Cd2+.
1 complexes for both 28·Zn2+ (1.65 × 10⁵ M−1) and 28·Cd2+ (5.75 × 10⁵ M−1). Due to the stronger binding of Cd2+, its quantification was not disturbed by Zn2+, whereas the heavy quenchers Co2+ and Cu2+ erased any emission enhancement of 28·Cd2+.
 | ||
| Scheme 9 Structure of 28 and suggested binding mode upon addition of Zn2+ and Cd2+.55 | ||
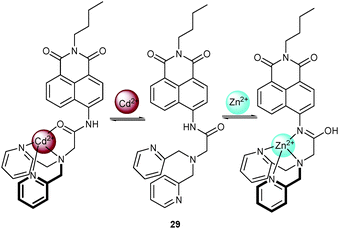
Later, Yoon, Shin, Xu and coworkers56 removed the 2-picolyl group to set up the ratiometric fluorescent probe 29 for Zn2+ and Cd2+ in aqueous solution (MeCN/0.5 M HEPES, pH = 7.4, 1![[thin space (1/6-em)]](https://www.rsc.org/images/entities/char_2009.gif) :
:![[thin space (1/6-em)]](https://www.rsc.org/images/entities/char_2009.gif) 1, v/v). In alkaline medium (pH = 6.3–12.8), the emission of 29 is effectively suppressed by PET. Among a series of cations, Cd2+ binds to the DPA unit and the amide oxygen leading to a 21-fold PL enhancement with a concomitant shift from 483 to 514 nm. In contrast, addition of Zn2+ prompted the formation of the imidic acid tautomer resulting in a 22-fold enhancement with a blue shift to 446 nm. The tautomerisation of the amide group in the presence of Zn2+ was supported by NMR data, see Scheme 10. The binding affinity of 29 to Zn2+ (Kd = 1/Ka = 5.7 nM) is stronger than that to Cd2+ (Kd = 48.5 nM), so that quantification of Zn2+ was not disturbed by Cd2+. In contrast, detection of Cd2+ was only possible in the absence of Zn2+.
1, v/v). In alkaline medium (pH = 6.3–12.8), the emission of 29 is effectively suppressed by PET. Among a series of cations, Cd2+ binds to the DPA unit and the amide oxygen leading to a 21-fold PL enhancement with a concomitant shift from 483 to 514 nm. In contrast, addition of Zn2+ prompted the formation of the imidic acid tautomer resulting in a 22-fold enhancement with a blue shift to 446 nm. The tautomerisation of the amide group in the presence of Zn2+ was supported by NMR data, see Scheme 10. The binding affinity of 29 to Zn2+ (Kd = 1/Ka = 5.7 nM) is stronger than that to Cd2+ (Kd = 48.5 nM), so that quantification of Zn2+ was not disturbed by Cd2+. In contrast, detection of Cd2+ was only possible in the absence of Zn2+.
 | ||
| Scheme 10 Structure of 29 and suggested binding modes upon addition of Zn2+ and Cd2+.56 | ||
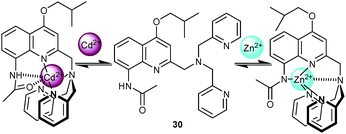
In 2009, Jiang and coworkers57 designed probe 30 as a variant of the well-known trispyridylamine chelate motif for distinguishing Cd2+ from Zn2+. Addition of Cd2+ generated a 40-fold PL enhancement (along with a red shift to 422 nm) by blocking PET from the amine to the quinoline fluorophore. In contrast, addition of Zn2+ caused a large 87 nm red shift to 476 nm along with only a slight emission enhancement (ΦZn/Φ0 = 1.7) as a result of an ICT process upon metal complexation. NMR investigations indicated that the different emission responses were a result of different binding patterns (Scheme 11). Cd2+ inhibited PET by coordination at both nitrogen and oxygen atoms of the amide, while Zn2+ prompted a deprotonation at the amide. The loose binding to the DPA nitrogens was not able to fully shut down PET. Addition of Cd2+ to 30·Zn2+ induced a blue shift and enhanced PL intensity by forming 30·Cd2+ (Kd = 0.25 ± 0.03 pM), indicating that quantification of Cd2+ was not disturbed by Zn2+. Indeed, the PL intensity of 30·Cd2+ was only quenched to 10% in the presence of 1 equiv. of Zn2+.
 | ||
| Scheme 11 Structure of 30 and suggested binding modes upon addition of Zn2+ and Cd2+.57 | ||
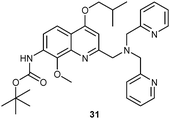
Only little later, the same group designed the related Zn2+ chemosensor 3158 and a strategy for the detection of Cd2+ by employing a ratiometric metal ion displacement. Addition of Zn2+ induced a large PL shift from 405 to 458 nm along with a 20-fold enhancement due to chelation enhanced fluorescence (CHEF). When 31·Zn2+ was exposed to Cd2+, the emission shifted from 458 to 425 nm exhibiting an isoemissive point at 445 nm. This feature allowed a ratiometric fluorescent calibration for the quantification of the stronger binding Cd2+.
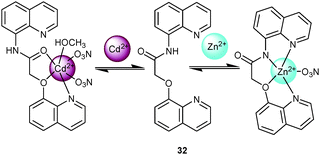
Liu and coworkers59 designed the probe 32 with 8-aminoquinoline and 8-hydroxyquinoline binding sites. Addition of Zn2+ prompted deprotonation at the amide group triggering emission enhancement at 486 nm and a decrease at 410 nm with an isoemissive point at 450 nm (Scheme 12). On the other hand, Cd2+ preferred to bind at the 8-hydroxyquinoline residue and the amide's oxygen thus inhibiting PET, which resulted in a 14-fold PL enhancement at 410 nm. The latter enhancement was quenched by AcO−, though. Among all cations, Cd2+ displayed the strongest affinity (9.8 × 10⁵ M−1) and even displaced Zn2+ from 32·Zn2+ (1.8 × 10⁴ M−1), so that the response toward Cd2+ was not disturbed by Zn2+. The crystal structure of 32·Zn2+ and 32·Cd2+ provided convincing support for the different binding modes.
 | ||
| Scheme 12 Structure of 32 and its binding modes upon addition of Zn2+ and Cd2+.59 | ||
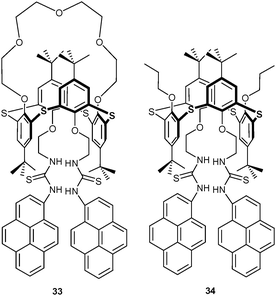
Aside of cations, anions can also be differentiated by this strategy. For instance, Kumar et al.60 reported on the thiacalix[4]arene-based pyrene probes 33 and 34 for sensing of F− and CN−. Both anions induced a similar change in the UV-Vis channel by interacting with the thiourea unit. However, their PL response was different. Cyanide (0–10 equiv.) quenched the pyrene monomer luminescence while enhancing the excimer emission. On the other hand, low amounts of F− (0–5 equiv.) induced a similar response as CN− but higher quantities (F− now used in 6–80 fold amount) enhanced both monomer and excimer emission due to a deprotonation of the thiourea group. With such a response, the authors were able to differentiate F− (I − I0) and CN− (IE/IM) using differential monitoring. While detection of F− was not disturbed by CN−, the addition of F− interfered with the response of 33 to CN− (IE/IM), preventing detection of CN− in the presence of F−. Probe 34 exhibited a similar detection behaviour as 33.
In the present subchapter, strong shifts of 54–76 nm (probes 28–30 and 32) were documented when the deprotonated groups was additionally involved into complexation with the metal ion. A somewhat smaller effect was recorded, when deprotonation and complexation were decoupled (shift = 33 nm, see probe 31). In such situation, even when the binding constants for the different analytes differ by one or two orders of magnitude, full quantification is possible by limiting the overall concentration of analytes and keeping the probe in excess.
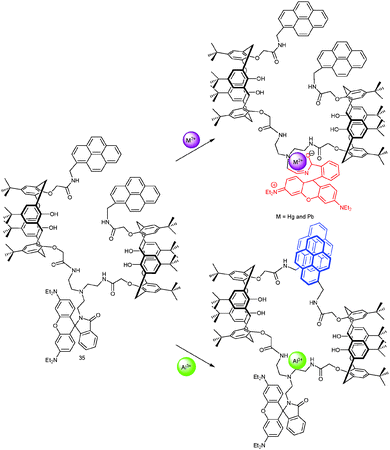
4.1.2.2 Profiting from different binding modes at the binding site. Different binding modes at a single site may lead to vastly different signals, if the site is equipped with two different reporter units operating at different wavelengths. For instance, Kim, Vicens and coworkers61 developed the calixarene-rhodamine-based FRET (fluorescence resonance energy transfer) probe 35 (Scheme 13). On one hand, Hg2+ and Pb2+ opened the lactam ring of 35 triggering a strong PL enhancement due to FRET from the excited pyrene(s) to the rhodamine. On the other hand, by coordinating to the tren-diamide unit, Al3+ triggered a strong emission of the pyrene excimer but hardly any rhodamine emission. Addition of Al3+ to 35·Hg2+ (39
![[thin space (1/6-em)]](https://www.rsc.org/images/entities/char_2009.gif) 070 M−1) gradually revived the pyrene emission band and weakened the emission of rhodamine. In a reverse way, addition of Hg2+ to a solution of 35·Al3+ did not induce significant PL changes. Quantification of Al3+ is not disturbed by other cations while that of Hg2+ is only feasible in the absence of Al3+.
070 M−1) gradually revived the pyrene emission band and weakened the emission of rhodamine. In a reverse way, addition of Hg2+ to a solution of 35·Al3+ did not induce significant PL changes. Quantification of Al3+ is not disturbed by other cations while that of Hg2+ is only feasible in the absence of Al3+.
 | ||
| Scheme 13 Proposed mechanism of probe 35 for sensing Hg2+/Pb2+ and Al3+.61 | ||
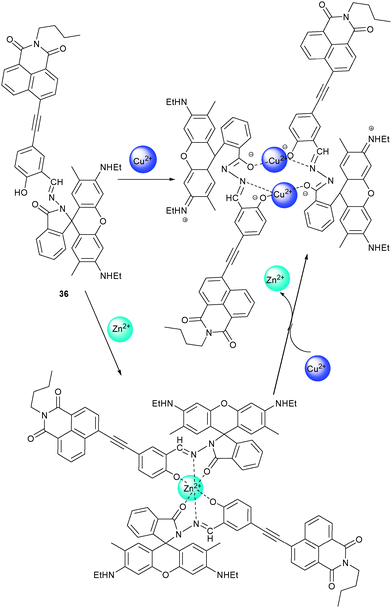
By linking a rhodamine to a naphthalimide unit, 36 was shown by Kim and coworkers62 to operate as a light-up probe for Cu2+ and Zn2+. Addition of Cu2+ to 36 led to a 2![[thin space (1/6-em)]](https://www.rsc.org/images/entities/char_2009.gif) :
:![[thin space (1/6-em)]](https://www.rsc.org/images/entities/char_2009.gif) 2 complex (Ka = 0.52 × 10⁴ M−3) showing the characteristic absorption and emission patterns of ring-opened rhodamines. In contrast, Zn2+ formed a 1
2 complex (Ka = 0.52 × 10⁴ M−3) showing the characteristic absorption and emission patterns of ring-opened rhodamines. In contrast, Zn2+ formed a 1![[thin space (1/6-em)]](https://www.rsc.org/images/entities/char_2009.gif) :
:![[thin space (1/6-em)]](https://www.rsc.org/images/entities/char_2009.gif) 2 complex with 36 (Ka = 0.34 × 10³ M−2) accompanied by appearance of a PL band at 595 nm indicating a promoted ICT process (Scheme 14). Other cations did exert little or no effect. Due to the lower Ka of the zinc complex, addition of Cu2+ to a solution of 362·Zn2+ induced a gradual blue shift in PL to 550 nm, indicating that Cu2+ is able to displace Zn2+ with concomitant formation of 362·(Cu2+)2. As a result, detection of Cu2+ was not disturbed by Zn2+ while that of Zn2+ was only feasible in the absence of Cu2+.
2 complex with 36 (Ka = 0.34 × 10³ M−2) accompanied by appearance of a PL band at 595 nm indicating a promoted ICT process (Scheme 14). Other cations did exert little or no effect. Due to the lower Ka of the zinc complex, addition of Cu2+ to a solution of 362·Zn2+ induced a gradual blue shift in PL to 550 nm, indicating that Cu2+ is able to displace Zn2+ with concomitant formation of 362·(Cu2+)2. As a result, detection of Cu2+ was not disturbed by Zn2+ while that of Zn2+ was only feasible in the absence of Cu2+.
 | ||
| Scheme 14 Structure of 36 and its possible binding modes upon addition of Zn2+ and Cu2+.62 | ||
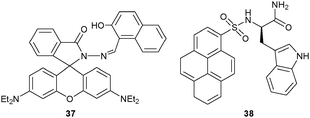
Xiao and coworkers63 prepared the rhodamine–naphthalene conjugate 37 to sense Hg2+ and Mg2+ by monitoring the PL intensity at different wavelengths. Addition of Hg2+ prompted an opening of the spirolactam ring of the rhodamine dye along with a new absorption at 558 nm and a new emission at 589 nm. In contrast, Mg2+ induced a different emission centred at 523 nm due to coordinating to the naphthol residue. The presence of Mg2+ did not affect the emission of 37·Hg2+ (1 × 10⁵ M−1). As a result, quantification of Mg2+ was only feasible in the absence of Hg2+.
Even in the presence of a single reporter unit, different binding modes may also lead to distinct signals with different analytes. Pyrene is famous for its excimer vs. monomer emission properties. Along those lines, Lee and coworkers64 developed probe 38 by merging the tryptophan unit (Trp) with a pyrene reporter unit. As a result, the PL response allowed detection of Pb2+ and Hg2+ at different wavelengths. Notably, the 1![[thin space (1/6-em)]](https://www.rsc.org/images/entities/char_2009.gif) :
:![[thin space (1/6-em)]](https://www.rsc.org/images/entities/char_2009.gif) 1 complex of Pb2+ and 38 enhanced the PL of the monomeric pyrene by inhibiting PET between pyrene and Trp. In contrast, Hg2+ interacted with 2 equiv. of 38 displaying a typical pyrene excimer emission. Because 382·Hg2+ (Ka = 1.12 × 10¹³ M−2) was much stronger bound than 38·Pb2+ (3.11 × 10² M−1), Hg2+ could easily be detected in the presence of Pb2+.
1 complex of Pb2+ and 38 enhanced the PL of the monomeric pyrene by inhibiting PET between pyrene and Trp. In contrast, Hg2+ interacted with 2 equiv. of 38 displaying a typical pyrene excimer emission. Because 382·Hg2+ (Ka = 1.12 × 10¹³ M−2) was much stronger bound than 38·Pb2+ (3.11 × 10² M−1), Hg2+ could easily be detected in the presence of Pb2+.
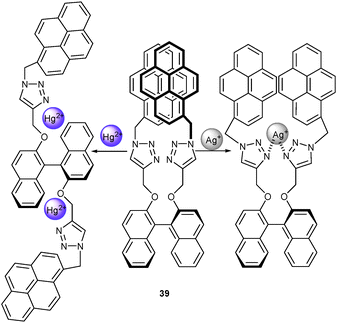
Not only pyrene dimer formation but also its separation may be used for detecting different analytes. Mounting pyrene via a click reaction onto a binaphthol scaffold, as explored by Zhu, Cheng and coworkers,65 furnished a new probe for Ag+ and Hg2+. Ag+ formed a 1![[thin space (1/6-em)]](https://www.rsc.org/images/entities/char_2009.gif) :
:![[thin space (1/6-em)]](https://www.rsc.org/images/entities/char_2009.gif) 1 complex (Ka = 3.4 × 10⁵ M−1) with 39 (Scheme 15) by coordinating to both triazole units which entailed some spatial separation of both pyrene residues. As a result, the PL of the pyrene excimer was reduced and that of the pyrene monomer enhanced allowing a ratiometric quantification of Ag+ in the presence of many metal ions. This assay was disturbed by Hg2+, though, because it formed a 1
1 complex (Ka = 3.4 × 10⁵ M−1) with 39 (Scheme 15) by coordinating to both triazole units which entailed some spatial separation of both pyrene residues. As a result, the PL of the pyrene excimer was reduced and that of the pyrene monomer enhanced allowing a ratiometric quantification of Ag+ in the presence of many metal ions. This assay was disturbed by Hg2+, though, because it formed a 1![[thin space (1/6-em)]](https://www.rsc.org/images/entities/char_2009.gif) :
:![[thin space (1/6-em)]](https://www.rsc.org/images/entities/char_2009.gif) 2 complex with 39 at a higher affinity constant (4.3 × 10⁸ M−2), which led to a quenching of both monomer and excimer emission. Thus, the assay for Ag+ only worked in the absence of Hg2+.
2 complex with 39 at a higher affinity constant (4.3 × 10⁸ M−2), which led to a quenching of both monomer and excimer emission. Thus, the assay for Ag+ only worked in the absence of Hg2+.
 | ||
| Scheme 15 Structure of 39 and its possible binding mode upon addition of Hg2+ and Ag+.65 | ||
Similarly as in Section 4.1.2.1, the different binding modes at a single binding site are subjected to competition between the different analytes. To nonetheless implement quantification schemes for more than one analyte, the assay needs to be restricted to analytes with similar binding affinity. Otherwise excess of the probe is required. As a way out, the analyte exhibiting the strongest affinity may be masked when quantifying the other analyte.
Very recently, the chromo-fluorescent probe 40 for the detection of Zn2+ and Fe3+ was designed by Luxami et al. (Scheme 16).66 In aqueous solution (20 μM HEPES/MeOH, 1![[thin space (1/6-em)]](https://www.rsc.org/images/entities/char_2009.gif) :
:![[thin space (1/6-em)]](https://www.rsc.org/images/entities/char_2009.gif) 1, pH = 7.2), addition of Zn2+ and Fe3+ triggered the appearance of UV-Vis absorptions at 380 nm and 335–500 nm, respectively, while other metal ions did not produce any significant colour changes. In the PL channel, Zn2+ and Fe3+ caused emissions at 440 and 585 nm, respectively. The difference arises, because Zn2+ binds to 40 at the hydroxy, imine and amide oxygen atoms without eliciting ring opening of the spirolactam. On the other hand, Fe3+ induced a ring-opening that was followed by an irreversible hydrolysis (Scheme 16). Individual Zn2+ and Fe3+ concentrations were determined by monitoring the PL intensity at 440 nm and 585 nm, respectively. Addition of Fe3+ to a solution of 40·Zn2+ resulted in an instantaneous PL quenching at 440 nm and enhancement at 585 nm suggesting to use 40·Zn2+ as a good displacement ratiometric probe for Fe3+. In contrast, the optical change produced from 40 and Fe3+ was not reversed by Zn2+. Thus, quantification of Zn2+ is only feasible in the absence of Fe3+.
1, pH = 7.2), addition of Zn2+ and Fe3+ triggered the appearance of UV-Vis absorptions at 380 nm and 335–500 nm, respectively, while other metal ions did not produce any significant colour changes. In the PL channel, Zn2+ and Fe3+ caused emissions at 440 and 585 nm, respectively. The difference arises, because Zn2+ binds to 40 at the hydroxy, imine and amide oxygen atoms without eliciting ring opening of the spirolactam. On the other hand, Fe3+ induced a ring-opening that was followed by an irreversible hydrolysis (Scheme 16). Individual Zn2+ and Fe3+ concentrations were determined by monitoring the PL intensity at 440 nm and 585 nm, respectively. Addition of Fe3+ to a solution of 40·Zn2+ resulted in an instantaneous PL quenching at 440 nm and enhancement at 585 nm suggesting to use 40·Zn2+ as a good displacement ratiometric probe for Fe3+. In contrast, the optical change produced from 40 and Fe3+ was not reversed by Zn2+. Thus, quantification of Zn2+ is only feasible in the absence of Fe3+.
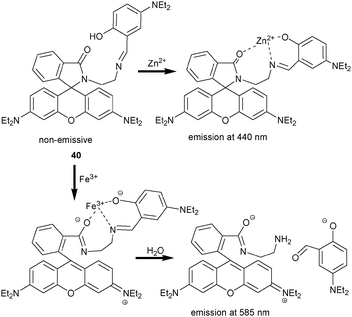 | ||
| Scheme 16 Sensing mechanism of probe 40 as a dual-wavelength probe for cation detection.66 | ||
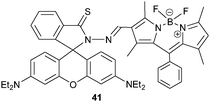
Very recently, Emrullahoğlu and coworkers67 connected a rhodamine and BODIPY unit via a hydrazone group. Due to the isomerisation about the C![[double bond, length as m-dash]](https://www.rsc.org/images/entities/char_e001.gif) N linkage and the spirolactam form of the rhodamine dye, probe 41 is non-emissive. Hg2+ prompted a ring-opening of the spirolactam entailing a PL enhancement at 585 nm, whereas Au3+ induced not only ring-opening but also C
N linkage and the spirolactam form of the rhodamine dye, probe 41 is non-emissive. Hg2+ prompted a ring-opening of the spirolactam entailing a PL enhancement at 585 nm, whereas Au3+ induced not only ring-opening but also C![[double bond, length as m-dash]](https://www.rsc.org/images/entities/char_e001.gif) N bond hydrolysis leading to emission recovery of the BODIPY as carbaldehyde. As a result, probe 41 displayed emissions at both 585 and 506 nm in the presence of Au3+, which were not disturbed by any other cation including Hg2+. Actually, complex 41·Hg2+ was not stable in the presence of Au3+ as indicated by PL enhancement at 506 nm suggesting C
N bond hydrolysis leading to emission recovery of the BODIPY as carbaldehyde. As a result, probe 41 displayed emissions at both 585 and 506 nm in the presence of Au3+, which were not disturbed by any other cation including Hg2+. Actually, complex 41·Hg2+ was not stable in the presence of Au3+ as indicated by PL enhancement at 506 nm suggesting C![[double bond, length as m-dash]](https://www.rsc.org/images/entities/char_e001.gif) N bond cleavage. Thus, quantification of Hg2+ was disturbed by Au3+. In fact, an excess of probe may allow to set up 41 as a true lab-on-a-molecule, but such experiment was not reported.
N bond cleavage. Thus, quantification of Hg2+ was disturbed by Au3+. In fact, an excess of probe may allow to set up 41 as a true lab-on-a-molecule, but such experiment was not reported.
Besides rhodamine and BODIPY, other luminophores have also been adopted. Qian, Xu and coworkers68 developed the real-time chemodosimeter 42 with large Stokes shifts to discriminate ClO− and OONO− from other reactive oxygen species (ROS). In buffered solution at pH 7.4 (0.1 M sodium phosphate, 1% DMF as cosolvent), ClO− triggered PL enhancements at 460 (71-fold) and 570 nm (63-fold) that were assigned to the formation of an intermediate and the final product, respectively. On the other side, OONO− only generated PL increase at 460 nm (68-fold) (Scheme 17). A quantitative assay of ClO− was performed using the intensity ratio at 460 nm and 570 nm, but those of OONO− and both analytes were not realised.
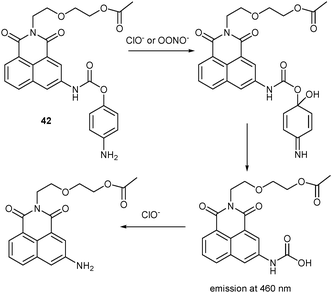 | ||
| Scheme 17 Mechanism of 42 as a dual-wavelength probe for ClO− and OONO−.68 | ||
It is well-known that the PL of iridium complexes originates from LC and/or MLCT transitions leading to characteristic emission spectra. Inspired by this wealth of information, a chemodosimeter based on iridium(III) complex 4369 was reported by Chen and Schmittel that is able to detect Hg2+ and ClO− simultaneously at pH = 6 (aqueous solution) in a single sample. Oxime residues were purposely selected as reactive sites and attached at the cyclometalated ligands of the iridium luminophore. The design was chosen because (1) PL in 43 should be low due to PET and oxime isomerisation, (2) the oxime is known to undergo facile conversion to other functional groups, and (3) the resultant functionality should influence the PL spectra in terms of shape and intensity. At pH 5–7, the oxime groups of 43 experienced dehydration selectively in the presence of Hg2+, while at pH > 5 and in the presence of ClO− they were increasingly oxidised to the carboxylate, resulting in an enhancement at two distinct wavelengths (505 nm for Hg2+ and 589 nm for ClO−) (Scheme 18). From the PL intensity ratio I577nm/I504nm at pH 6, the ratio of both analytes was obtained and their individual concentrations determined after assessing the concentration of Hg2+ in DMF–phthalate buffer at pH 5. At present, 43 is a selective two-analyte chemodosimeter for the largest library of analytes (33 species) ever reported.
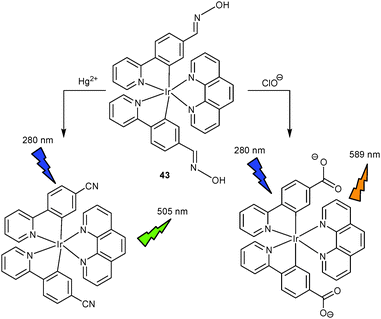 | ||
| Scheme 18 Sensing mechanism of probe 43 as a dual-wavelength probe for Hg2+ and ClO−.69 | ||
In summary, use of chemodosimeters provides a powerful strategy toward distinguishable signals for each analyte with high selectivity and quantification of each analyte. Reactions with large favourable free energy change (ΔG) and products with high quantum yield ensure highly sensitive detection. Nevertheless, the simultaneous quantification of two or three analytes in a single solution remains a main challenge. If orthogonal reactions are available then a fully competitive assay can be readily achieved by using an excess of the probe. However, if one product reacts further on with another analyte (see 42), then quantification of all analytes becomes difficult and sometimes even impossible.
Strongin et al.70 reported on probe 44 to discriminate glutathione (GSH), cysteine (Cys) and homocysteine (Hcy) from other amino acids under physiological condition. All three targets, GSH, Cys and Hcy, underwent a Michael addition to trigger a PL enhancement (λ = 377 nm) by suppressing the alkene-related PET. However, only the adducts generated from Cys and Hcy are able to undergo intramolecular cyclisation at the phenol ester site that are distinct in their kinetic rates (Scheme 19). Because the generated 2-(2′-hydroxy-3′-methoxyphenyl)benzothiazole (HMBT) experiences tautomerisation upon ESIPT with its phenol (λ = 377 nm) and keto (λ = 487 nm) tautomers displaying emissions at distinct wavelengths, the concentration of Cys, GSH and Hcy may be determined by monitoring the PL intensity over time. With cetyltrimethylammonium bromide (CTAB) to enhance the reaction rate in a micellar medium, the concentration of Cys, GSH and Hcy was read out at 487 nm after 9 min, 377 nm after 9 min and at both 487 and 377 nm after 9 min, respectively. A competitive assay was not realised.
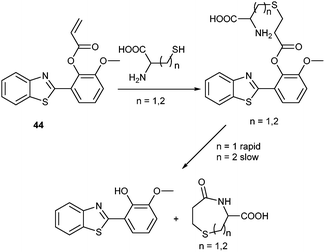 | ||
| Scheme 19 Sensing mechanism of 44 as a multianalyte probe for Cys–Hcy detection.70 | ||
More recently, the same group71 used the rhodol thioester 45 in combination with S–N acyl transfer and ESIPT to differentiate GSH and Hcy/Cys (Scheme 20). The probe displayed a weak emission at 587 nm due to PET quenching from the nitrothiophenoxy unit. GSH induced a transthioesterification that removed the nitrothiophenol thus recovering the PL at 587 nm. Hcy/Cys prompted an analogous reaction followed by an S, N-acyl shift to trigger ESIPT at the HMBT along with a PL enhancement at 454 nm. Other amino acids did not induce any significant PL enhancement. Neither did addition of Cys to a mixture of 45 and GSH cause any change indicating that 45 can differentiate GSH from Hcy/Cys. The addition of a mixture of GSH and Cys to 45 led to dramatic enhancements at both 454 and 587 nm. This result as well as experiments on human breast cancer cells indicated that the probe can detect GSH and determine the overall concentration of Hcy/Cys in a single solution.
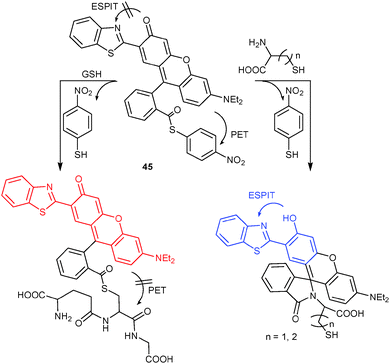 | ||
| Scheme 20 Sensing mechanism of 45 as probe for GSH and Cys/Hcy.71 | ||
Guo and coworkers designed the coumarin–hemicyanine probe 4672 with its three reaction sites as a fluorescent chemodosimeter for Cys and GSH. Cysteine induced a SNAr-based halogen–thiol exchange at site 1 followed by an thiol–amine rearrangement with the liberated thiol quickly attacking site 2. In the UV-Vis channel, the whole process led to a hypochromic effect at 535 nm and a hyperchromic effect at 360 nm. The concentration of cysteine was monitored by a new PL band at 420 nm. Hcy intrigued a similar substitution and rearrangement but a slower attack at site 2. As a result, it quenched the emission of probe 46. GSH initiated a SNAr at site 1 and a slow attack at site 3 accompanied by a hypochromic effect at 535 nm and a hyperchromic effect at 450 nm in the UV-Vis channel. In the PL channel, the new emission at 512 nm was useful to monitor the concentration of GSH. In the presence of high concentrations of Cys/Hcy/GSH (100 μM/100 μM/1 mM), 46 responded first to Cys due to its higher reactivity than that of GSH. In the presence of low concentrations of Cys/Hcy/GSH (1/1/10 μM), 46 elicited a PL enhancement at 512 nm. Unfortunately, quantitative detection in competition experiments was not addressed.
Inspired by the large Stokes shifts and substituent-dependent emissions of pyronin dyes, the same group73 designed the chemodosimeter 47. In the UV-Vis channel, GSH triggered a slight red shift to 593 nm in line with thiophenol/GSH exchange at the thiopyronin. On the other hand, Cys/Hcy (15 equiv.) caused a hypochromic effect at 588 nm along with the emergence of a band centred at 460 nm indicating the generation of aminopyronin dyes. Probe 47 was inert to other thiol-free amino acids evocative of a reaction pathway involving first SNAr and then S,N-rearrangement for Cys/Hcy. Individual quantification was realised by adopting different excitation wavelength. In the PL channel, after excitation at 580 nm, GSH (15 equiv.) elicited a 63-fold enhancement at 622 nm, while Cys/Hcy did not generate any increase. When excited at 455 nm, though, Cys/Hcy (15 equiv.) triggered a 90-fold enhancement at 546 nm but GSH only induced a poor emission at 622 nm. Cell imaging experiments indicated the feasibility of a simultaneous detection of both GSH and Cys/Hcy, however, the corresponding quantification scheme was not provided.
The examples demonstrate that kinetic differentiation is a powerful strategy to distinguish Cys/Hcy and GSH. By virtue of different rates (44, 45 and 47) or different sites of attack (46), analytes are differentiated. Probe 45 can simultaneously detect both GSH and Hcy/Cys in a dilute human serum sample. Moreover, excess of 46 might be able to quantify both GSH and Cys in a single solution.
![[thin space (1/6-em)]](https://www.rsc.org/images/entities/char_2009.gif) :
:![[thin space (1/6-em)]](https://www.rsc.org/images/entities/char_2009.gif) 1 complex (353 ± 21 M−1), which entailed a PL enhancement of the pyrene monomer at 377 nm. On the other hand, glucose interacted with two equiv. of 48 forming a 1
1 complex (353 ± 21 M−1), which entailed a PL enhancement of the pyrene monomer at 377 nm. On the other hand, glucose interacted with two equiv. of 48 forming a 1![[thin space (1/6-em)]](https://www.rsc.org/images/entities/char_2009.gif) :
:![[thin space (1/6-em)]](https://www.rsc.org/images/entities/char_2009.gif) 2 complex (1.9 × 10⁶ M−2) that assembled into an aggregate (diameter: 2000 nm) at pH = 10 by virtue of pyrene–pyrene π–π stacking entailing a characteristic excimer enhancement at 510 nm. With phenylboronic acid (10 mM) as a “knock-out”, the interference of fructose (5 mM) could be reduced to 4%. Unfortunately, quantification of fructose in the presence of glucose was not addressed.
2 complex (1.9 × 10⁶ M−2) that assembled into an aggregate (diameter: 2000 nm) at pH = 10 by virtue of pyrene–pyrene π–π stacking entailing a characteristic excimer enhancement at 510 nm. With phenylboronic acid (10 mM) as a “knock-out”, the interference of fructose (5 mM) could be reduced to 4%. Unfortunately, quantification of fructose in the presence of glucose was not addressed.Inducing a superstructure is a smart strategy to generate vastly different signals for different analytes. Adversely, such approach requires high concentration of the probe. In the case of 48, 0.1 mM of probe was used. For quantification of two analytes, the analyte that is unable to induce a superstructure should exhibit the higher affinity with the probe and be quantified first. Quantification of the second analyte can then be realised by masking the first one.
4.2 Multianalyte probes operating on multimodal sensing
By attaching three pyridyl residues on a phenyl scaffold, Wei, Yu and others78 generated a new probe for the dual detection of Zn2+ and Cu2+ (Scheme 21). In the UV-Vis channel, Zn2+ induced a slight absorbance increase (ca. 20% at 244 nm) while Cu2+ caused an intensive hyperchromic effect (2.9-fold) at the same wavelength. Because Zn2+ coordinated to the two ortho-pyridine rings of 51, it induced a 6.4-fold PL enhancement due to hindering the rotation about the C–C bond. In contrast, Cu2+ quenched the emission by a factor of 4.3 due to its paramagnetic nature. Among a series of cations, small interferences were reported: Cd2+ enhanced while Hg2+ slightly attenuated the PL intensity of 51. Addition of Cu2+ to a solution of 51·Zn2+ resulted in a gradual emission decrease at 375 nm due to formation of 51·Cu2+. As a result, the UV-Vis channel may be used to quantify Cu2+ and the PL channel for detecting Zn2+ in the absence of Cu2+.
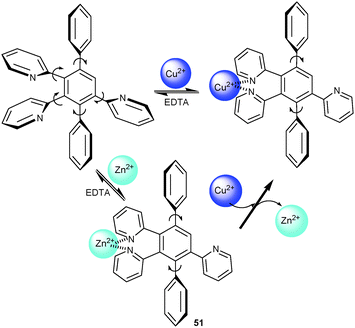 | ||
| Scheme 21 Structure of 51 and its possible binding modes upon addition of Zn2+ and Cu2+.78 | ||
Using the distinct metal-ion binding properties of porphyrin and DPA, 52 and 53 were designed by Jiang to selectively detect Cu2+ and Pb2+.79 In MeOH/CH2Cl2 (1![[thin space (1/6-em)]](https://www.rsc.org/images/entities/char_2009.gif) :
:![[thin space (1/6-em)]](https://www.rsc.org/images/entities/char_2009.gif) 1, v/v), Pb2+ formed a 3
1, v/v), Pb2+ formed a 3![[thin space (1/6-em)]](https://www.rsc.org/images/entities/char_2009.gif) :
:![[thin space (1/6-em)]](https://www.rsc.org/images/entities/char_2009.gif) 2 complex (2.1 × 10⁴ M−4) with 52 that showed a new absorption at 466 nm and an absorbance decrease at 417 nm as well as a new emission band at 604 nm and PL quenching at 650 nm. In contrast, Cu2+ formed a 2
2 complex (2.1 × 10⁴ M−4) with 52 that showed a new absorption at 466 nm and an absorbance decrease at 417 nm as well as a new emission band at 604 nm and PL quenching at 650 nm. In contrast, Cu2+ formed a 2![[thin space (1/6-em)]](https://www.rsc.org/images/entities/char_2009.gif) :
:![[thin space (1/6-em)]](https://www.rsc.org/images/entities/char_2009.gif) 1 complex (7.4 × 10⁵ M−2) with 52, which did not prompt any significant changes in the UV-Vis channel but PL quenching at 650 nm. Cu2+ exhibited a higher binding affinity than lead as it displaced Pb2+ from 52·Pb2+. The concentration of Cu2+ was determined by PL while Pb2+ may be quantified in both PL and UV-Vis channels in the absence of Cu2+. Probe 53 exhibited a similar detection behaviour.
1 complex (7.4 × 10⁵ M−2) with 52, which did not prompt any significant changes in the UV-Vis channel but PL quenching at 650 nm. Cu2+ exhibited a higher binding affinity than lead as it displaced Pb2+ from 52·Pb2+. The concentration of Cu2+ was determined by PL while Pb2+ may be quantified in both PL and UV-Vis channels in the absence of Cu2+. Probe 53 exhibited a similar detection behaviour.
Li and coworkers80 reported on the amino pyridine and benzimidazole conjugate 54 as a multianalyte sensor. Among a series of cations, only Al3+ hindered the ESIPT in 54 and enhanced the emission along with shifts from 395 (54N*) and 528 (54T*) nm to 430 and 504 nm, respectively (Scheme 22). On the other hand, Cu2+ quenched the PL of 54 due to its paramagnetic properties. In the UV-Vis channel, Al3+ induced a red shift from 345 to 355 nm without any change in absorbance, while addition of Cu2+ prompted a dramatic hypochromic effect at 345 nm and a hyperchromic effect at 390 nm after a 45 nm red shift. Job plots indicated a 1![[thin space (1/6-em)]](https://www.rsc.org/images/entities/char_2009.gif) :
:![[thin space (1/6-em)]](https://www.rsc.org/images/entities/char_2009.gif) 1 stoichiometry for both 54·Al3+ (1.35 × 10⁶ M−1) and 54·Cu2+ (6.53 × 10⁵ M−1). Quantification of Al3+ was not disturbed by other cations in the PL channel. Due to the higher affinity of 54·Al3+, however, Al3+ disturbed the detection of Cu2+ in the UV-Vis channel. Upon addition of F− and EDTA to 54·Al3+ or 54·Cu2+, fluorescence and absorption spectra were identical to those of 54 demonstrating the reversibility of binding. Complex 54·Al3+ exhibited a high selectivity for F− over Cl−, Br− and I−.
1 stoichiometry for both 54·Al3+ (1.35 × 10⁶ M−1) and 54·Cu2+ (6.53 × 10⁵ M−1). Quantification of Al3+ was not disturbed by other cations in the PL channel. Due to the higher affinity of 54·Al3+, however, Al3+ disturbed the detection of Cu2+ in the UV-Vis channel. Upon addition of F− and EDTA to 54·Al3+ or 54·Cu2+, fluorescence and absorption spectra were identical to those of 54 demonstrating the reversibility of binding. Complex 54·Al3+ exhibited a high selectivity for F− over Cl−, Br− and I−.
 | ||
| Scheme 22 ESIPT mechanism of probe 54.80 | ||
The key to successful multianalyte sensing is to implement a differential selectivity. As one of the strategies, a strongly binding analyte is made “silent” in one channel, e.g. Cu2+ as a strong quencher usually is unable to generate PL enhancement, while it is the dominant analyte in another channel. Other cases of “blanking an analyte”, but less in numbers, are known for UV-Vis channel detection. For example, the binding of Cu2+ to 51 resulted in a marked hyperchromic effect in the absorption spectrum, while Zn2+ as the competitor only induced a negligible increase.
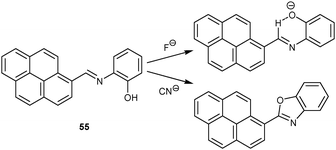 | ||
| Scheme 23 Proposed sensing mechanism of probe 55 for detecting fluoride and cyanide.81 | ||
![[thin space (1/6-em)]](https://www.rsc.org/images/entities/char_2009.gif) :
:![[thin space (1/6-em)]](https://www.rsc.org/images/entities/char_2009.gif) 2 complex with 56 that was silent in the UV-Vis channel but showed a 7-fold PL enhancement at 510 nm. This response was not disturbed by any of the usual cellular ions (Mg2+, Na2+, Ca2+ and Zn2+). Quantification of Hg2+ in the PL channel, however, was only feasible in absence of Cu2+.
2 complex with 56 that was silent in the UV-Vis channel but showed a 7-fold PL enhancement at 510 nm. This response was not disturbed by any of the usual cellular ions (Mg2+, Na2+, Ca2+ and Zn2+). Quantification of Hg2+ in the PL channel, however, was only feasible in absence of Cu2+.5 Non-competitive multianalyte chemosensors
Chemosensors in this category are often denoted as two-analyte chemosensors in their original papers but they do not exhibit/prove selectivity in competitive assays. Thus, they are incompatible with single-solution multianalyte quantification. Herein, a competitive assay would mean either the competition among different target analytes or among analyte and another unrelated species. If either of the competition was missing, the example was assigned to chapter 5. For a synopsis of the operating principles, probes 57–86 are listed in Table 1 along with their target analytes, the detection method(s) and spectroscopic responses (Scheme 24).| Probe | Analytes | Detection method | Response |
|---|---|---|---|
| 57 83 | Hg2+ | UV-Vis | Red shift from 421 to 515 nm |
| PL | Red shift from 475 to 508 nm with an enhancement factor of 30 | ||
| Cu2+ | UV-Vis | Red shift from 421 to 520 nm | |
| PL | Red shift from 475 to 590 nm with an enhancement factor of 8 | ||
| 58 84 | Na+ | UV-Vis (20 °C) | Hyperchromic effect at 566 nm |
| K+ | UV-Vis (50 °C) | Hyperchromic effect at 566 nm | |
| 59 85 | H+ | PL | Quenching at 420 nm and enhancement at 448 nm (Ratiometric response) |
| Cu2+ | Quenching at 420 nm | ||
| 60 86 | Cu2+ | UV-Vis | Hypochromic effect at 489 and hyperchromic effect at 383 nm (Isosbestic point at 410 nm) |
| Hg2+ | Hypochromic effect at 489 and hyperchromic effect at 413 nm | ||
| 61 87 | Zn2+ | PL | Quenching at 411 nm and enhancement at 458 nm (Ratiometric response) |
| Cu2+ | Quenching at 411 nm | ||
| 62 88 | Zn2+ | PL | Enhancement (16–18 fold) |
| Ni2+ | Quenching | ||
| 63 89 | Hg2+ | PL | Enhancement at 421 nm (8.3-fold) |
| Cu2+ | Enhancement at 405 nm (2.8-fold) | ||
| Zn2+ | Enhancement at 393 nm (3.6-fold) | ||
| 64 90,91 | Hg2+ | UV-Vis | Hypochromic effect at 575 nm (5-fold reduction, blue-shift to 535 nm) and a new band appearing at 405 nm |
| Fe3+ | Hypochromic effect at 550 nm | ||
| Cu2+ | Hypochromic effect at 575 nm | ||
| Fe3+ | CV | Anodic shift (28 mV) | |
| Cu2+ | Anodic shift (12 mV) | ||
| Hg2+ | Anodic shift (31 mV) | ||
| 65 91 | Cu2+ | UV-Vis | Hypochromic effect at 585 nm and blue-shift (from 585 to 560 nm) |
| Fe3+ | Hypochromic effect at 555 nm and blue-shift (from 585 to 555 nm) | ||
| CN− | Hypochromic effect at 585 nm | ||
| Cu2+ | CV | Anodic shift (11 mV) | |
| Fe3+ | Anodic shift (18 mV) | ||
| Hg2+ | Anodic shift (24 mV) | ||
| 66 91 | Fe3+ | UV-Vis | Hypochromic effect (10-fold reduction) and blue-shift (from 584 to 554 nm) |
| Cu2+ | Hypochromic effect (1.5-fold reduction) and blue-shift (from 584 to 574 nm) | ||
| CN− | Hypochromic effect at 584 nm | ||
| 67 92 | Cu2+ | UV-Vis | Hyperchromic effect at 557 nm (>30 fold) |
| VO2+ | PL | Enhancement at 583 nm (>40 fold) | |
| 68 93 | Cu2+ | PL | Quenching with shift from 492 to 471 nm |
| UV-Vis | Blue shift from 420 to 373 nm | ||
| Ni2+ | PL | Quenching | |
| UV-Vis | Red shift from 420 to 478 nm | ||
| 69 94 | Hg2+ | UV-Vis | Blue shift from 518 to 499 nm |
| PL | Blue shift from 548 to 532 nm (7-fold enhancement) | ||
| Ag+ | Enhancement at 548 nm (1-fold) | ||
| 70 95 | Cu2+ | PL | Quenching at 517 nm |
| F− |
Quenching at 517 nm (0–5 μM)
Enhancement at 478 nm (5–350 μM) |
||
| UV-Vis |
Hypochromic effect at 265 and 342 nm
Hyperchromic effect at 447 nm (Isosbestic point at 379 nm) |
||
| 71 96 | Ag+ | PL | Enhancement (56%) at 458 nm |
| Cu2+ | Quenching (89%) at 458 nm | ||
| UV-Vis | Blue-shift from 390 to 357 nm (Isosbestic point at 281 nm) | ||
| 72 97 | Fe2+ | PL | Enhancement (F516/F650 from 16.4 to 26.67) |
| Hg2+ | Quenching (F516/F650 from 16.4 to 1.24) | ||
| 73 98 | Cu2+ | UV-Vis | Hypochromic effect (441 nm) |
| F− |
Hypochromic effect (441 nm)
Hyperchromic effect (572 nm) (Isosbestic point at 480 nm) |
||
| Cu2+ | PL | Quenching | |
| F− | Quenching | ||
| 74 99 | Cu2+ | UV-Vis | Hyperchromic effect at 527 nm |
| Fe3+ | PL | Enhancement at 552 nm | |
| 75 100 | K+ | PL | Quenching at 430 nm with 20 blue-shift |
| F− | Quenching | ||
| 76 101 | Hg2+ | UV-Vis | Hyperchromic effect at 248 nm (4.9-fold) and 395 nm (9.7-fold) |
| Zn2+ | PL | Enhancement at 390 nm (10.5-fold) | |
| 77 102 | F− | UV-Vis |
Hypochromic effect (465 nm)
Hyperchromic effect (565 and 600 nm) |
| CN− |
Hypochromic effect (465 nm)
Hyperchromic effect (520 nm) |
||
| 78 103 | Zn2+ | PL | Enhancement at 480 nm (50-fold) |
| Cu2+ | Quenching at 390 nm | ||
| 79 103 | Zn2+ | PL | Blue shift from 585 to 480 nm with 41-fold enhancement |
| Cu2+ | Quenching (85%) at 585 nm | ||
| F− | Quenching at 585 nm | ||
| 80 104 | Zn2+ | PL |
Enhancement (85-fold)
Red-shift (from 445 to 520 nm) |
| Cd2+ |
Quenching
Red-shift (from 445 to 580 nm) |
||
| 81 105 | Zn2+ | PL | Enhancement with red shift from 475 to 492 nm |
| F− | Quenching at 475 nm | ||
| 82 106 | Sr2+ | PL | Enhancement at 365 nm |
| Cd2+ | Quenching at 365 nm | ||
| 83 107 | Cu2+ | PL | Enhancement at 476 nm |
| F− | Quenching at 476 nm | ||
| 84 108 | FMN | PL | Quenching at 525 nm |
| FAD | Enhancement at 525 nm | ||
| 85 109 | NAD+ | PL | Monomer quenching |
| NADP+ | Excimer formation at 526 nm | ||
| FMN | Mutual quenching | ||
| FAD | Time-dependent enhancement | ||
| 86 110 | F−/CN− | PL | Quenching at 608 nm |
| H2PO4− | Enhancement (3.2 fold) with red shift from 608 nm to 615 nm | ||
| Fe2+ | UV-Vis | Red shift from 318 to 323 nm and a new peak at 575 nm |
6 Conclusions
From our enumeration, it has become clear that orthogonal multianalyte detection by a single probe has attracted growing attention in recent years. The field will receive even more interest, when the first applications have emerged, in which small volume segments of different composition (e.g. see the pioneering work with probe 2 in cells)28 are screened for several analytes at high spatial resolution, because probe partitioning will not matter for the analysis. Moreover, replacing the single-analyte probes in sensor arrays with lab-on-a-molecules will vastly improve the power of analytic assays.In the last three years, numerous novel systems have emerged and new protocols have surfaced. Multianalyte chemosensors are successful when they operate on selective sensing and signaling modes that are based on different detection channels, orthogonal binding, orthogonal reaction mechanisms and/or differing kinetic features. Up to now, however, most multianalyte chemosensors are only able to quantify two analytes. Only in few probes, i.e. with 11 and 22, quantification of three species has been realized. As a result, additional work needs to be invested to improve the number of detectable analytes in large-sized libraries by using a single lab-on-a-molecule assay.
A wide range of analytes, selectivity in real-world chemical and biological samples, orthogonal detection of closely related analytes, reusability and practicability are desired in combination with surface-immobilized systems for handy applications. Furthermore, the sensitivity to different analytes should be in the relevant detection range for real world assays (e.g. the concentrations of GSH and Cys in the cell are 1–10 mM and 30–200 μM, respectively).71 Toward the end, low-cost, real time detection, and dynamics of response will become important in real-world applications. With an increasing amount of these requirements fulfilled, multianalyte chemosensors will find an increasing utility in environmental, industrial and medical analysis.
Acknowledgements
We thank the DFG for financial support in the DFG/ANR framework (Schm 647/17-1) and are indebted to Dr S. Khatua (North-Eastern Hill University, India) for some initial discussions on lab-on-a-molecule probes.Notes and references
- (a) L. E. Kreno, K. Leong, O. K. Farha, M. Allendorf, R. P. Van Duyne and J. T. Hupp, Chem. Rev., 2012, 112, 1105 CrossRef CAS PubMed; (b) T. Wagner, S. Haffer, C. Weinberger, D. Klaus and M. Tiemann, Chem. Soc. Rev., 2013, 42, 4036 RSC.
- (a) M. E. Germain and M. J. Knapp, Chem. Soc. Rev., 2009, 38, 2543 RSC; (b) Y. Salinas, R. Martínez-Máñez, M. D. Marcos, F. Sancenón, A. M. Costero, M. Parra and S. Gil, Chem. Soc. Rev., 2012, 41, 1261 RSC.
- M. T. Albelda, J. C. Frías, E. García-España and H.-J. Schneider, Chem. Soc. Rev., 2012, 41, 3859 RSC.
- A. Mills, Chem. Soc. Rev., 2005, 34, 1003 RSC.
- (a) A. R. Lippert, G. C. van de Bittner and C. J. Chang, Acc. Chem. Res., 2011, 44, 793 CrossRef CAS PubMed; (b) Y. Zhou, Z. Xu and J. Yoon, Chem. Soc. Rev., 2011, 40, 2222 RSC; (c) X. Chen, X. Tian, I. Shin and J. Yoon, Chem. Soc. Rev., 2011, 40, 4783 RSC; (d) J. Chan, S. C. Dodani and C. J. Chang, Nat. Chem., 2012, 4, 973 CrossRef CAS PubMed; (e) A. V. Jentzsch, A. Hennig, J. Mareda and S. Matile, Acc. Chem. Res., 2013, 46, 2791 CrossRef PubMed.
- (a) H. Craighead, Nature, 2006, 442, 387 CrossRef CAS PubMed; (b) T. F. Didar and M. Tabrizian, Lab Chip, 2010, 10, 3043 RSC; (c) A. M. Foudeh, T. F. Didar, T. Veres and M. Tabrizian, Lab Chip, 2012, 12, 3249 RSC; (d) Y. Du, B. Li and E. Wang, Acc. Chem. Res., 2013, 46, 203 CrossRef CAS PubMed.
- H. Schäfer, H. Lin, M. Schmittel and M. Böhm, Microsyst. Technol., 2008, 14, 589 CrossRef.
- M. Wu, D. Holowka, H. G. Craighead and B. Baird, Proc. Natl. Acad. Sci. U. S. A., 2004, 101, 13798 CrossRef CAS PubMed.
- (a) D. C. Magri, G. J. Brown, G. D. McClean and A. P. de Silva, J. Am. Chem. Soc., 2006, 128, 4950 CrossRef CAS PubMed; (b) D. C. Magri, M. C. Fava and C. J. Mallia, Chem. Commun., 2014, 50, 1009 RSC.
- L. Rosenfeld, Four centuries of clinical chemistry, Taylor & Francis, New York, London, 1999. See comment on page 255 Search PubMed.
- A. Hulanicki, S. Glab and F. Ingman, Pure Appl. Chem., 1991, 63, 1247 Search PubMed.
- (a) A. T. Wright and E. V. Anslyn, Chem. Soc. Rev., 2006, 35, 14 RSC; (b) P. Anzenbacher Jr., P. Lubal, P. Buček, M. A. Palacios and M. E. Kozelkova, Chem. Soc. Rev., 2010, 39, 3954 RSC; (c) K. L. Diehl and E. V. Anslyn, Chem. Soc. Rev., 2013, 42, 8596 RSC; (d) S. Stewart, M. A. Ivy and E. V. Anslyn, Chem. Soc. Rev., 2014, 43, 70 RSC.
- (a) C. N. LaFratta and D. R. Walt, Chem. Rev., 2008, 108, 614 CrossRef CAS PubMed; (b) D. R. Walt, Chem. Soc. Rev., 2010, 39, 38 RSC; (c) D. R. Walt, Anal. Chem., 2013, 85, 1258 CrossRef CAS PubMed.
- (a) L. E. Santos-Figueroa, M. E. Moragues, E. Climent, A. Agostini, R. Martínez-Máñez and F. Sancenón, Chem. Soc. Rev., 2013, 42, 3489 RSC; (b) X. Li, X. Gao, W. Shi and H. Ma, Chem. Rev., 2014, 114, 590 CrossRef CAS PubMed.
- (a) M. Dong, Y. Peng, Y.-M. Dong, N. Tang and Y.-W. Wang, Org. Lett., 2012, 14, 130 CrossRef CAS PubMed; (b) Y. Peng, Y.-M. Dong, M. Dong and Y.-W. Wang, J. Org. Chem., 2012, 77, 9072 CrossRef CAS PubMed.
- (a) D. Margulies, C. E. Felder, G. Melman and A. Shanzer, J. Am. Chem. Soc., 2007, 129, 347 CrossRef CAS PubMed; (b) J. Andréasson and U. Pischel, Chem. Soc. Rev., 2010, 39, 174 RSC; (c) U. Pischel, J. Andréasson, D. Gust and V. F. Pais, ChemPhysChem, 2013, 14, 28 CrossRef CAS PubMed; (d) B. Rout, L. Motiei and D. Margulies, Synlett, 2014, 25, 1050 CrossRef.
- (a) A. P. de Silva and S. Uchiyama, Nat. Nanotechnol., 2007, 2, 399 CrossRef CAS PubMed; (b) A. P. de Silva, Chem. – Asian J., 2011, 6, 750 CrossRef PubMed; (c) U. Pischel, Angew. Chem., Int. Ed., 2007, 46, 4026 CrossRef CAS PubMed; (d) U. Pischel, Aust. J. Chem., 2010, 63, 148 CrossRef CAS.
- S. Ozlem and E. U. Akkaya, J. Am. Chem. Soc., 2009, 131, 48 CrossRef CAS PubMed.
- (a) H. Kobayashi, M. R. Longmire, M. Ogawa and P. L. Choyke, Chem. Soc. Rev., 2011, 40, 4626 RSC; (b) S. Carregal-Romero, E. Caballero-Díaz, L. Beqa, A. M. Abdelmonem, M. Ochs, D. Hühn, B. S. Suau, M. Valcarcel and W. J. Parak, Annu. Rev. Anal. Chem., 2013, 6, 53 CrossRef CAS PubMed.
- See examples: (a) M. Dong, Y.-W. Wang and Y. Peng, Org. Lett., 2010, 12, 5310 CrossRef CAS PubMed; (b) H. J. Jung, N. Singh, D. Y. Lee and D. O. Jang, Tetrahedron Lett., 2010, 51, 3962 CrossRef CAS; (c) Z.-Q. Hu, C.-S. Lin, X.-M. Wang, L. Ding, C.-L. Cui, S.-F. Liu and H. Y. Lu, Chem. Commun., 2010, 46, 3765 RSC; (d) Y. Liu, Y. Sun, J. Du, X. Lv, Y. Zhao, M. Chen, P. Wang and W. Guo, Org. Biomol. Chem., 2011, 9, 432 RSC; (e) L. Wang, W. Qin, X. Tang, W. Dou and W. Liu, J. Phys. Chem. A, 2011, 115, 1609 CrossRef CAS PubMed; (f) N. Kumari, S. Jha and S. Bhattacharya, J. Org. Chem., 2011, 76, 8215 CrossRef CAS PubMed; (g) L. Xu, Y. Xu, W. Zhu, B. Zeng, C. Yang, B. Wu and X. Qian, Org. Biomol. Chem., 2011, 9, 8284 RSC; (h) L. Wang, J. Yan, W. Qin, W. Liu and R. Wang, Dyes Pigm., 2012, 92, 1083 CrossRef CAS; (i) X. Sun, Y.-W. Wang and Y. Peng, Org. Lett., 2012, 14, 3420 CrossRef CAS PubMed; (j) P. N. Basa and A. G. Sykes, J. Org. Chem., 2012, 77, 8428 CrossRef CAS PubMed; (k) M. S. Moorthy, H.-J. Cho, E.-J. Yu, Y.-S. Jung and C.-S. Ha, Chem. Commun., 2013, 49, 8758 RSC; (l) Y. Li, J. Wu, X. Jin, J. Wang, S. Han, W. Wu, J. Xu, W. Liu, X. Yao and Y. Tang, Dalton Trans., 2014, 43, 1881 RSC.
- (a) M. E. Huston, C. Engleman and A. W. Czarnik, J. Am. Chem. Soc., 1990, 112, 7054 CrossRef CAS; (b) J. M. Castagnetto and J. W. Canary, Chem. Commun., 1998, 203 RSC.
- Y. Lu, H. Kong, F. Wen, S. Zhang and X. Zhang, Chem. Commun., 2013, 49, 81 RSC.
- (a) D. Liu, M. Liu, G. Liu, S. Zhang, Y. Wu and X. Zhang, Anal. Chem., 2010, 82, 66 CrossRef CAS PubMed; (b) P. Wu, L.-N. Miao, H.-F. Wang, X.-G. Shao and X.-P. Yan, Angew. Chem., Int. Ed., 2011, 50, 8118 CrossRef CAS PubMed.
- F. Vogt and B. Mizaikoff, Anal. Chem., 2003, 75, 3050 CrossRef CAS PubMed.
- (a) I. M. Raimundo Jr. and R. Narayanaswamy, Sens. Actuators, B, 2003, 90, 189 CrossRef; (b) D. Mikami, T. Ohki, K. Yamaji, S. Ishihara, D. Citterio, M. Hagiwara and K. Suzuki, Anal. Chem., 2004, 76, 5726 CrossRef CAS PubMed.
- M. L. Griffiths, R. P. Barbagallo and J. T. Keer, Anal. Chem., 2006, 78, 513 CrossRef CAS PubMed.
- H. Komatsu, D. Citterio, Y. Fujiwara, K. Minamihashi, Y. Araki, M. Hagiwara and K. Suzuki, Org. Lett., 2005, 7, 2857 CrossRef CAS PubMed.
- H. Komatsu, T. Miki, D. Citterio, T. Kubota, Y. Shindo, Y. Kitamura, K. Oka and K. Suzuki, J. Am. Chem. Soc., 2005, 127, 10798 CrossRef CAS PubMed.
- L. A. Greene and A. S. Tischler, Proc. Natl. Acad. Sci. U. S. A., 1976, 73, 2424 CrossRef CAS.
- P. Kaur, D. Sareen and K. Singh, Dalton Trans., 2012, 41, 8767 RSC.
- N. Singh, R. C. Mulrooney, N. Kaur and J. F. Callan, Chem. Commun., 2008, 4900 RSC.
- N. Kaur and S. Kumar, Chem. Commun., 2007, 3069 RSC.
- N. Kaur and S. Kumar, Tetrahedron Lett., 2008, 49, 5067 CrossRef CAS.
- D. Y. Lee, N. Singh and D. O. Jang, Tetrahedron Lett., 2010, 51, 1103 CrossRef CAS.
- D. Y. Lee, N. Singh and D. O. Jang, Tetrahedron Lett., 2011, 52, 3886 CrossRef CAS.
- P. Kaur and D. Sareen, Dyes Pigm., 2011, 88, 296 CrossRef CAS.
- V. K. Bhardwaj, P. Saluja, G. Hundal, M. S. Hundal, N. Singh and D. O. Jang, Tetrahedron, 2013, 69, 1606 CrossRef CAS.
- (a) M. Schmittel and H.-W. Lin, Angew. Chem., Int. Ed., 2007, 46, 893 CrossRef CAS PubMed; (b) A. P. de Silva, Nature, 2007, 445, 718 CrossRef PubMed.
- N. Singh, N. Kaur, C. N. Choitir and J. F. Callan, Tetrahedron Lett., 2009, 50, 4201 CrossRef CAS.
- Q. Shu, L. Birlenbach and M. Schmittel, Inorg. Chem., 2012, 51, 13123 CrossRef CAS PubMed.
- M. Schmittel and S. Qinghai, Chem. Commun., 2012, 48, 2707 RSC.
- K. Chen and M. Schmittel, Analyst, 2013, 138, 6742 RSC.
- E. Berni, I. Gosse, D. Badocco, P. Pastore, N. Sojic and S. Pinet, Chem. – Eur. J., 2009, 15, 5145 CrossRef CAS PubMed.
- L. Tang, F. Li, M. Liu and R. Nandhakumar, Spectrochim. Acta, Part A, 2011, 78, 1168 CrossRef PubMed.
- L. Tang, F. Li, M. Liu and R. Nandhakumar, Bull. Korean Chem. Soc., 2011, 32, 3400 CrossRef CAS.
- H. Ye, F. Ge, X.-C. Chen, Y. Li, H. Zhang, B.-X. Zhao and J.-Y. Miao, Sens. Actuators, B, 2013, 182, 273 CrossRef CAS.
- M. Wang, F. Yan, Y. Zou, L. Chen, N. Yang and X. Zhou, Sens. Actuators, B, 2014, 192, 512 CrossRef CAS.
- L. Shi, Y. Li, Z.-P. Liu, T. D. James and Y.-T. Long, Talanta, 2012, 100, 401 CrossRef CAS PubMed.
- K. Chen and M. Schmittel, Chem. Commun., 2014, 50, 5756 RSC.
- E. Tulyakova, S. Delbaere, Y. Fedorov, G. Jonusauskas, A. Moiseeva and O. Fedorova, Chem. – Eur. J., 2011, 17, 10752 CrossRef CAS.
- C. Bhaumik, S. Das, D. Maity and S. Baitalik, Dalton Trans., 2011, 40, 11795 RSC.
- M. Yuan, W. Zhou, X. Liu, M. Zhu, J. Li, X. Yin, H. Zheng, Z. Zuo, C. Ouyang, H. Liu, Y. Li and D. Zhu, J. Org. Chem., 2008, 73, 5008 CrossRef CAS PubMed.
- L. Yuan, W. Lin, Y. Xie, B. Chen and S. Zhu, J. Am. Chem. Soc., 2012, 134, 1305 CrossRef CAS PubMed.
- B. Rout, L. Unger, G. Armony, M. A. Iron and D. Margulies, Angew. Chem., Int. Ed., 2012, 51, 12477 CrossRef CAS PubMed.
- C. Lu, Z. Xu, J. Cui, R. Zhang and X. Qian, J. Org. Chem., 2007, 72, 3554 CrossRef CAS PubMed.
- Z. Xu, K.-H. Baek, H. N. Kim, J. Cui, X. Qian, D. R. Spring, I. Shin and J. Yoon, J. Am. Chem. Soc., 2010, 132, 601 CrossRef CAS PubMed.
- L. Xue, C. Liu and H. Jiang, Org. Lett., 2009, 11, 1655 CrossRef CAS PubMed.
- L. Xue, Q. Liu and H. Jiang, Org. Lett., 2009, 11, 3454 CrossRef CAS PubMed.
- X. Zhou, P. Li, Z. Shi, X. Tang, C. Chen and W. Liu, Inorg. Chem., 2012, 51, 9226 CrossRef CAS PubMed.
- M. Kumar, R. Kumar and V. Bhalla, Tetrahedron Lett., 2013, 54, 1524 CrossRef CAS.
- A. B. Othman, J. W. Lee, J.-S. Wu, J. S. Kim, R. Abidi, P. Thuéry, J. M. Strub, A. Van Dorsselaer and J. Vicens, J. Org. Chem., 2007, 72, 7634 CrossRef PubMed.
- J. F. Zhang, Y. Zhou, J. Yoon, Y. Kim, S. J. Kim and J. S. Kim, Org. Lett., 2010, 12, 3852 CrossRef CAS PubMed.
- Y. Zhao, B. Zheng, J. Du, D. Xiao and L. Yang, Talanta, 2011, 85, 2194 CrossRef CAS PubMed.
- L. N. Neupane, J.-Y. Park, J. H. Park and K.-H. Lee, Org. Lett., 2013, 15, 254 CrossRef CAS PubMed.
- X. Liu, X. Yang, Y. Fu, C. Zhu and Y. Cheng, Tetrahedron, 2011, 67, 3181 CrossRef CAS.
- V. Luxami, Renukamal, K. Paul and S. Kumar, RSC Adv., 2013, 3, 9189 RSC.
- E. Karakuş, M. Üçüncü and M. Emrullahoğlu, Chem. Commun., 2014, 50, 1119 RSC.
- T. Guo, L. Cui, J. Shen, R. Wang, W. Zhu, Y. Xu and X. Qian, Chem. Commun., 2013, 49, 1862 RSC.
- K. Chen, J. W. Bats and M. Schmittel, Inorg. Chem., 2013, 52, 12863 CrossRef CAS PubMed.
- X. Yang, Y. Guo and R. M. Strongin, Angew. Chem., Int. Ed., 2011, 50, 10690 CrossRef CAS PubMed.
- X.-F. Yang, Q. Huang, Y. Zhong, Z. Li, H. Li, M. Lowry, J. O. Escobedo and R. M. Strongin, Chem. Sci., 2014, 5, 2177 RSC.
- J. Liu, Y.-Q. Sun, Y. Huo, H. Zhang, L. Wang, P. Zhang, D. Song, Y. Shi and W. Guo, J. Am. Chem. Soc., 2014, 136, 574 CrossRef CAS PubMed.
- J. Liu, Y.-Q. Sun, H. Zhang, Y. Huo, Y. Shi and W. Guo, Chem. Sci., 2014, 5, 3183 RSC.
- Y.-J. Huang, W.-J. Ouyang, X. Wu, Z. Li, J. S. Fossey, T. D. James and Y.-B. Jiang, J. Am. Chem. Soc., 2013, 135, 1700 CrossRef CAS PubMed.
- M. Tian, H. Ihmels and K. Benner, Chem. Commun., 2010, 46, 5719 RSC.
- S. H. Kim, J. S. Kim, S. M. Park and S.-K. Chang, Org. Lett., 2006, 8, 371 CrossRef CAS PubMed.
- F. Qian, C. Zhang, Y. Zhang, W. He, X. Gao, P. Hu and Z. Guo, J. Am. Chem. Soc., 2009, 131, 1460 CrossRef CAS PubMed.
- Z. Li, L. Zhang, L. Wang, Y. Guo, L. Cai, M. Yu and L. Wei, Chem. Commun., 2011, 47, 5798 RSC.
- Y. Chen and J. Jiang, Org. Biomol. Chem., 2012, 10, 4782 CAS.
- X. Li, M. Yu, F. Yang, X. Liu, L. Wei and Z. Li, New J. Chem., 2013, 37, 2257 RSC.
- L. Zang, D. Wei, S. Wang and S. Jiang, Tetrahedron, 2012, 68, 636 CrossRef CAS.
- H. Lu, Z. Xue, J. Mack, Z. Shen, X. You and N. Kobayashi, Chem. Commun., 2010, 46, 3565 RSC.
- R. Martínez, A. Espinosa, A. Tárraga and P. Molina, Org. Lett., 2005, 7, 5869 CrossRef PubMed.
- K. Tsubaki, D. Tanima, Y. Kuroda, K. Fuji and T. Kawabata, Org. Lett., 2006, 8, 5797 CrossRef CAS PubMed.
- L.-L. Li, H. Sun, C.-J. Fang, J. Xu, J.-Y. Jin and C.-H. Yan, J. Mater. Chem., 2007, 17, 4492 RSC.
- J. Tan and X.-P. Yan, Talanta, 2008, 76, 9 CrossRef CAS PubMed.
- M.-M. Yu, Z.-X. Li, L.-H. Wei, D.-H. Wei and M.-S. Tang, Org. Lett., 2008, 10, 5115 CrossRef CAS PubMed.
- R. Joseph, B. Ramanujam, H. Pal and C. P. Rao, Tetrahedron Lett., 2008, 49, 6257 CrossRef CAS.
- B. N. Ahamed, I. Ravikumar and P. Ghosh, New J. Chem., 2009, 33, 1825 RSC.
- T. Ábalos, D. Jiménez, R. Martínez-Máñez, J. V. Ros-Lis, S. Royo, F. Sancenón, J. Soto, A. M. Costero, S. Gil and M. Parra, Tetrahedron Lett., 2009, 50, 3885 CrossRef.
- T. Ábalos, D. Jiménez, M. Moragues, S. Royo, R. Martínez-Máñez, F. Sancenón, J. Soto, A. M. Costero, M. Parra and S. Gil, Dalton Trans., 2010, 39, 3449 RSC.
- F.-J. Huo, J. Su, Y.-Q. Sun, C.-X. Yin, H.-B. Tong and Z.-X. Nie, Dyes Pigm., 2010, 86, 50 CrossRef CAS.
- H. Li, L. Cai, J. Li, Y. Hu, P. Zhou and J. Zhang, Dyes Pigm., 2011, 91, 309 CrossRef CAS.
- X. Zhang, Y. Xu, P. Guo and X. Qian, New J. Chem., 2012, 36, 1621 RSC.
- V. Bhalla, R. Tejpal and M. Kumar, Tetrahedron, 2011, 67, 1266 CrossRef CAS.
- R. Pandey, P. Kumar, A. K. Singh, M. Shahid, P.-Z. Li, S. K. Singh, Q. Xu, A. Misra and D. S. Pandey, Inorg. Chem., 2011, 50, 3189 CrossRef CAS PubMed.
- Y. Chen, L. Wan, X. Yu, W. Li, Y. Bian and J. Jiang, Org. Lett., 2011, 13, 5774 CrossRef CAS PubMed.
- H. Yang, H. Song, Y. Zhu and S. Yang, Tetrahedron Lett., 2012, 53, 2026 CrossRef CAS.
- A. Sikdar, S. S. Panja, P. Biswas and S. Roy, J. Fluoresc., 2012, 22, 443 CrossRef CAS PubMed.
- X. He and V. W.-W. Yam, Org. Lett., 2011, 13, 2172 CrossRef CAS PubMed.
- R. Satapathy, Y.-H. Wu and H.-C. Lin, Org. Lett., 2012, 14, 2564 CrossRef CAS PubMed.
- R. Guliyev, S. Ozturk, E. Sahin and E. U. Akkaya, Org. Lett., 2012, 14, 1528 CrossRef CAS PubMed.
- V. Luxami and S. Kumar, RSC Adv., 2012, 2, 8734 RSC.
- J. Wang, W. Lin and W. Li, Chem. – Eur. J., 2012, 18, 13629 CrossRef CAS PubMed.
- P. G. Sutariya, N. R. Modi, A. Pandya, B. K. Joshi, K. V. Joshi and S. K. Menon, Analyst, 2012, 137, 5491 RSC.
- P. G. Sutariya, A. Pandya, N. R. Modi and S. K. Menon, Analyst, 2013, 138, 2244 RSC.
- P. G. Sutariya, A. Pandya, A. Lodha and S. K. Menon, Analyst, 2013, 138, 2531 RSC.
- H.-W. Rhee, S. J. Choi, S. H. Yoo, Y. O. Jang, H. H. Park, R. M. Pinto, J. C. Cameselle, F. J. Sandoval, S. Roje, K. Han, D. S. Chung, J. Suh and J.-I. Hong, J. Am. Chem. Soc., 2009, 131, 10107 CrossRef CAS PubMed.
- J. Oh and J.-I. Hong, Org. Lett., 2013, 15, 1210 CrossRef CAS PubMed.
- Z.-B. Zheng, Z.-M. Duan, Y.-Y. Ma and K.-Z. Wang, Inorg. Chem., 2013, 52, 2306 CrossRef CAS PubMed.
Footnote |
| † These authors contributed equally. |
| This journal is © The Royal Society of Chemistry 2015 |


