 Open Access Article
Creative Commons Attribution 3.0 Unported Licence
Characterisation and application of ultra-high spin clusters as magnetic resonance relaxation agents
Gisela
Guthausen
*a,
Julyana R.
Machado
a,
Burkhard
Luy
a,
Amer
Baniodeh
bc,
Annie K.
Powell
bc,
Steffen
Krämer
d,
Florian
Ranzinger
ae,
Maria P.
Herrling
e,
Susanne
Lackner
e and
Harald
Horn
e
aPro2NMR at the Institutes for Biological Interfaces and for Mechanical Processes Engineering and Mechanics, KIT, Adenauerring 20b, D-76131 Karlsruhe, Germany. E-mail: gisela.guthausen@kit.edu
bInstitute of Nanotechnology, KIT, Hermann-von-Helmholtz-Platz 1, 76344 Eggenstein-Leopoldshafen, Germany
cInstitute of Inorganic Chemistry, KIT, Engesserstr. 15, D-76131 Karlsruhe, Germany
dLaboratoire National des Champs Magnétiques Intenses, LNCMI-CNRS (UPR3228), UJF, UPS, and INSA, 25 rue des Martyrs, BP 166, 38042 Grenoble, France
eEBI, Chair of Water Chemistry and Water Technology, KIT, Engler-Bunte-Ring 1, D-76131 Karlsruhe, Germany
First published on 11th February 2015
Abstract
In Magnetic Resonance Tomography (MRT) image contrast can be improved by adding paramagnetic relaxation agents such as lanthanide ions. Here we report on the use of highly paramagnetic isostructural FeIII/4f coordination clusters with a [Fe10Ln10] core to enhance relaxation. Measurements were performed over the range of 1H Larmor frequencies of 10 MHz to 1.4 GHz in order to determine the relevant parameters for longitudinal and transverse relaxivities. Variation of the lanthanide ion allows differentiation of relaxation contributions from electronic states and molecular dynamics. We find that the transverse relaxivities increase with field, whereas the longitudinal relaxivities depend on the nature of the lanthanide. In addition, the GdIII analogue was selected in particular to test the interaction with tissue observed using MRT. Studies on biofilms used in waste water treatment reveal that the behaviour of the high-spin clusters is different from what is observed for common relaxation agents with respect to the penetration into the biofilms. The Fe10Gd10 cluster adheres to the surface of the biofilm better than the commercial agent Gadovist.
Introduction
In MRT and also in NMR spectroscopy, paramagnetic molecules are of special importance regarding their relaxation behaviour in solution (paramagnetic relaxation enhancement, PRE) and their influence on line shifts (pseudocontact shift, PCS). In the present context, PRE is examined for newly available highly paramagnetic coordination clusters with up to 120 unpaired electrons. These 3d/4f clusters form cyclic structures which - to the best of our knowledge - are unique in the category of potential relaxation agents. The high spin clusters [FeIII10LnIII10(Me-tea)10(Me-teaH)10(NO3)10] are abbreviated as Fe10Ln10. At room temperature they have magnetic moments corresponding to the sum of the contributions of the isolated ions.1 The clusters were synthesized as outlined recently.2 The Fe10Ln10 compounds are soluble in water3 and other solvents. Apart from these cyclic coordination clusters there are very few other examples of such d/f systems.4In addition to the large number of unpaired electrons in the Fe10Ln10 systems, the molecular tumbling in solution deviates from the usual behaviour of small molecules such as single ion gadolinium complexes.3 These points are of fundamental interest since these molecules have nanoscale dimensions and are thus expected to behave differently from both single-centre coordination compounds and nanoparticles used as contrast agents. Thus, the first step is to provide a suitable database in order to develop a theoretical model which describes the clusters’ properties with respect to PRE. The series of compounds available makes it possible to investigate the individual electronic contributions to the hyperfine relaxation and the parameters that depend on the molecular environment by varying the lanthanide ion and allow us to discover the influence of the time-modulated hyperfine couplings.
From the application point of view of PRE in magnetic resonance imaging or tomography (MRT), generating a contrast enhancement is required. This is especially relevant in cases where the difference in chemical composition is small making structures hard to distinguish. Potential relaxation agents are of interest regardless of whether the application is in medical diagnostics or related to material science. PRE reduces both the longitudinal relaxation times T1 as well as the transverse relaxation times T2, which lead to different effects on image contrast. On one hand, the reduction of T1 is equivalent with a faster magnetization build-up. As in MRT measurements are most often performed in dynamic magnetization equilibrium, this leads to larger signal amplitudes in the presence of relaxation agents. PRE of T1 is therefore often called a positive contrast enhancement. On the other hand, the reduction of the transverse relaxation time leads to a reduction of signal amplitude. MRT in material science often utilizes spin echo sequences, which involve an echo time with a lower limiting value. Therefore, reducing T2 leads to a reduction of signal in the presence of paramagnetic moieties. The knowledge of the clusters relaxation properties gives a first indication, which contrast can be expected in MRT.
This approach has the limitation that the paramagnetic molecules must be in solution. An intriguing question, especially in the present case of relatively large clusters, is how they behave in inhomogeneous systems. Apart from clustering and aggregation, tumbling, diffusion and exchange rates depend on the chemical environment as quantified in the equations describing classical PRE.5 When imaging heterogeneous systems the PRE's of the components have to be known, if the concentrations of the paramagnetic moieties are to be determined quantitatively. In the present study on biofilms, a fundamental question is the degree of mass transfer of compounds into the biofilm matrix. Relaxation agents exhibiting different chemical surface properties and sizes can be used as probes with the prerequisite that this effect still occurs when the moieties are within the biofilm structure.
Experimental
Sample preparation
The five lanthanides clusters Fe10Dy10, Fe10Er10, Fe10Gd10, Fe10Tb10 and Fe10Tm10 with a concentration of 1 mM in water were selected for the relaxivity studies. They were diluted using D2O (90%) and H2O (10%) to avoid radiation damping, especially at high magnetic fields. The concentrations investigated in the NMR experiments were: 0.05 mM, 0.10 mM, 0.20 mM, 0.30 mM, 0.40 mM, 0.50 mM, 0.60 mM, 0.80 mM and 1 mM. In the ultra-high fields >600 MHz, only concentrations of interest were selected which were 0.30 mM, 0.60 mM, 0.80 mM and 1 mM due to the short time period of access to the magnet. Measurements at 1H-Larmor frequencies from 10 MHz to 600 MHz were performed on samples in Wilmad sample tubes (OD 5.0 mm). At higher fields above 1H-Larmor frequencies of 600 MHz, Wilmad EPR capillary tubes of OD 1.2 mm and ID 1.0 mm with a length of 12 mm were used. The capillaries borders were closed with proton free fluorinated polymer grease (DAIFLOIL, Daikin, China). By Teflon ribbon, the capillaries were fixed in the horizontally oriented NMR coil. Further details are summarized in ref. 3.
NMR spectrometers and pulse sequences
In the relaxivity study, several NMR systems were used in order to cover the interesting Larmor frequency range from 10 MHz to 1.4 GHz. The MRT images were obtained at 200 MHz applying different parameter schemes to obtain a dedicated contrast.On a Bruker 400 MHz WB spectrometer, a SEF 400 MHz W1 probe for 5 mm sample tubes were used; at 600 MHz, a TBI probe for 5 mm sample tubes with actively shielded z-gradients was placed into a 600 MHz SB magnet. The data acquisition software varied from XWINNMR 3.5 (600 MHz) to TOPSPIN1.5 (200 MHz) to TOPSPIN2.1 (400 MHz). T1 was obtained from mono-exponential fits on data from inversion recovery; T2 resulted from single echo CPMG measurements as implemented on Bruker high field NMR spectrometers. Data were processed within TOPSPIN. All samples were measured at room temperature. Typical sequence parameters of the measurements are summarized in ref. 3.
A Bruker 200 MHz SWB instrument was used for relaxivity measurements, being equipped with a Diff30 probe for 5 mm sample tubes. For imaging, the multi-slice multi-echo sequence was applied on a micro2.5 set-up with a 25 mm birdcage resonator. Parameters were adjusted such that either dominantly R1 or R2 contrast was achieved. Carrier matierials with attached cultivated bioilm were measured first without any relaxation agents, then a time series of images was acquired to detect a possible permeation of the paramagnetic moieties into the biofilm. The contrast parameter for the images were repetition times and echo time, which were chosen to TR = 800 ms and τE = 4.5 ms for T1 weighting, TR = 10 s and τE = 50 ms for T2 weighting, and TR = 10 s and τE = 3.2 ms for PD images.
Results and discussion
Relaxation study of Fe10Ln10 clusters
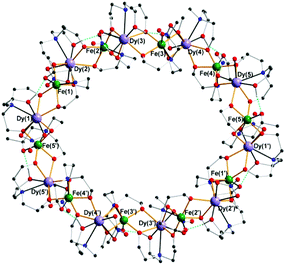
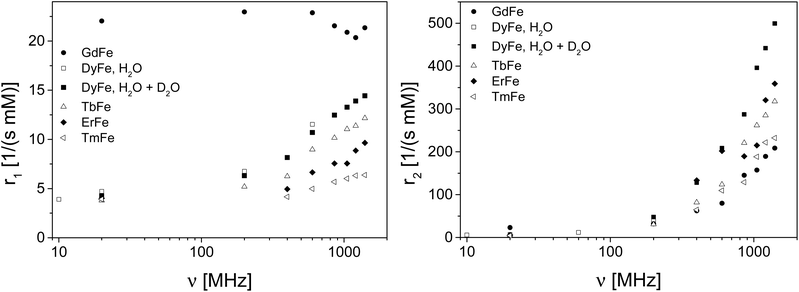
From the perspective of MRT, the paramagnetic clusters Fe10Ln10 (Fig. 1) are an interesting substance class because of their magnetic properties. Due to the hyperfine coupling between electron spins on the cluster and nuclei in the neighbourhood together with field fluctuations due to electron spin relaxation, molecular tumbling, diffusion, or chemical exchange, the relaxation properties of molecules surrounding the cluster will change. In the case of conventional contrast agents these mechanisms are well understood5,7 and can be calculated analytically, provided that the parameters of the multi-variable equations are known.5 Often limiting cases of this rather complex theoretical framework for PRE are discussed.5 In the present paper, we explored a different way for the characterization of the molecular clusters by variation of the lanthanide ions also mentioned in ref. 8. The molecular architecture allows the synthesis of a series of Fe10Ln10 clusters with different electronic properties and therefore hyperfine couplings. In terms of NMR relaxation, the contributions to PRE are varied due to different electronic relaxation contributions. This contribution to PRE is characterized by the hyperfine coupling and the electronic correlation times and can therefore be differentiated from the contributions of molecular tumbling, diffusion and chemical exchange. In the present study, the investigated lanthanides within the Fe10Ln10 clusters are GdIII (total angular momentum quantum number j = 7/2), TbIII (j = 6), DyIII (j = 15/2), ErIII (j = 15/2), and TmIII (j = 6).The relaxivities (Fig. 2) were obtained by measuring the longitudinal and the transverse relaxation rates for different contrast agent concentrations over the range of 1H Larmor frequencies of 10 MHz to about 1.4 GHz. The relaxation rates were obtained by monoexponential fits on the experimental data. These relaxation rates are expected to linearly depend on concentration, which was indeed observed in analogy to ref. 3. A linear fit was performed on the relaxation rates as a function of concentration. The resulting slopes represent the relaxivities (Fig. 2). The concentration, which entered the relaxivity, is based on the whole cluster rather than on the single paramagnetic ion. We currently prefer this presentation, as little is known whether the relaxation can be understood regarding the whole complex as a single magnetic moment or regarding each single ion in the cluster in terms of a conventional molecular relaxation agent. In addition, one should keep in mind that the dimension of a single water molecule is rather small compared to the cluster size such that the question whether the cluster acts as a single moiety or as a sum of individual ions is not trivial. The answer will certainly depend also on the degree and nature of coupling of the electronic d and f orbitals of the ions via the nearby p orbitals of the bridging oxo-groups from the ligands.
At low magnetic fields the longitudinal relaxivity r1 shows a quite interesting behaviour as a function of the Ln ions: Except of the Gd cluster, all contrast agents show moderate relaxivities despite of the large number of unpaired electrons, which is expected for outer sphere relaxation. Furthermore, r1 increases more or less pronounced with field. This behaviour differs from that of common relaxation agents: Often, the relaxivity decreases with increasing field,5,9–12 already at moderate field strengths. We observed a steady increase of relaxivity up to the highest currently available magnetic fields in a similar way as it was observed at lower fields also for Ln ions in aqueous solutions,13,14 NiII complexes15 and magnetic nanoparticles.16 Further measurements on Fe10Lu10 in the range 10 MHz to 600 MHz do not show the typical increase of r1 and r2 as a function of 1H Larmor frequency, leading to the conclusion that this observation can be attributed to the paramagnetism of the LnIII ions in the clusters. An additional hint on the importance of the Ln electronic states and their correlations times is given by the PRE of the Fe10Gd10 cluster (Fig. 2) in comparison to the other Fe10Ln10 moieties: r1 (Fe10Gd10) behaves approximately field independent at moderate fields, except in the very high field limit where a small decrease is observed.
In order to qualitatively explain the observed relaxivity (Fig. 2) different determining factors should be considered: molecular tumbling rates, diffusion, chemical exchange as well as field dependence and dynamics of the electron spin states. As far as the cluster is currently analysed with respect to its physical properties, the dominant part of PRE is attributed to outer sphere relaxation, as no direct binding site for water molecules is available at the FeIII and LnIII ions. Dipolar and Curie contributions are of major importance for PRE of diverse Ln contrast agents, which is supported by experimental investigations.13,14 However, inner sphere contributions are significant in these investigations, which is not the case for the Fe10Ln10 clusters.
The known physical parameters of Ln ions are summarized with respect to PRE in literature:13,17 In particular, the electronic correlation times and the anisotropy parameters of the hyperfine coupling differ across the lanthanide series. An effective radius for PRE is assigned for the different lanthanides.17 When comparing the findings in ref. 13, 14, 17 with Fig. 2, a qualitative correlation can be established, although without taking into account the role of the FeIII ions. An especially interesting case is the cluster Fe10Gd10: The electronic correlation time of Gd3+ spin states is usually rather long, the hyperfine anisotropy is negligible, and the effective radius for PRE is rather large. These exceptional properties are reflected in Fig. 2. The large number of paramagnetic ions leads to a spread of the electronic energy levels, which is confirmed by preliminary EPR measurements at room temperature. In this case relaxation theory for a single centre is not adequate a priori. On the other hand, the observed PREs differ also from typical observations in superparamagnetic clusters and nanoparticles,11,18,19 therefore the models for the description of PRE of these moieties cannot be applied directly to the data in Fig. 2. Magnetically coupled systems such as the present Fe10Ln10 clusters do not necessarily follow the standard approaches to interpreting PRE.5
In summary, PRE is influenced by a variety of molecular parameters such as diffusional and rotational correlation times. The electronic correlation times, the symmetry of the hyperfine couplings and the susceptibility of the LnIII ions differ by orders of magnitude, which are important parameters in PRE. Furthermore, polarization effects in the high spin clusters can occur at the rather high magnetic fields, which complicate the picture even more. There is also the question of the distance of water molecules from the sites of the ions and the influence of tunnelling effects. At present we attribute the major effect to outer sphere relaxation, involving a significant Curie contribution.
Regarding r2, a similar behaviour is observed for all the different clusters: It is interesting to note that the Fe10Dy10 cluster shows the highest transverse relaxivity, whereas Fe10Gd10 exhibits the smallest. But all of them increase monotonically with increasing field. At the highest fields, large relaxivities are observed which is equivalent with the possibility of detecting rather small amounts of the relaxation agents due to the shortening of the transverse relaxation time.
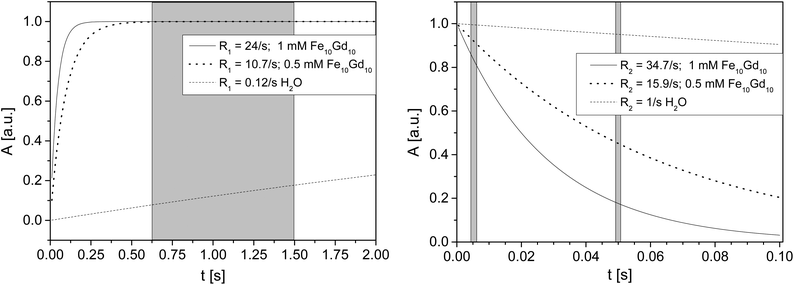
From the perspective of MRT, Fe10Gd10 seems at a first sight the most interesting cluster as the high r1 leads to a signal enhancement when measuring at high repetition rates in a non-equilibrium state of magnetization. r2 is still moderate also at the fields currently used in material science. This means that the echo times can still be chosen such that a reasonably good spatial resolution is obtainable. To give some experimentally relevant numbers: T2 relaxation time of water is in the order of 1 s, a 1 mM Fe10Gd10 solution will exhibit a transverse relaxation time around 28.6 ms at a 1H Larmor frequency of 200 MHz. When imaging a sample by a multi slice multi echo sequence, spin echo times are usually in the order of several ms. Pure water is therefore hardly attenuated. In the case of the 1 mM Fe10Gd10 solution, the signal will be attenuated already to roughly 3/4. On the other hand, T1 is shortened from around 2–3 s to 42 ms. On the time scale of the recovery time of an imaging experiment, the magnetization is fully relaxed leading to a drastic signal enhancement compared to pure water.
The simulation (Fig. 3) illustrates the situation for three concentrations of Fe10Gd10 in a range relevant for applications. The relative signal amplitude of water is calculated for different cluster concentrations as a function of time for both the transverse magnetization decay and the longitudinal recovery. The typical ranges of the MRT parameters used in the study on biofilms are marked. The conclusion from these graphs is that the discrimination of “pure” water is mostly due to the longitudinal contrast. The discrimination of different Fe10Gd10 concentrations, on the other hand, is achieved more easily in transverse magnetization. This fact has to be considered when choosing a cluster for MRT investigations: Since the Fe10Dy10 cluster shows the largest r2 value and as the sensitivity to concentration is therefore the highest, this cluster is also of interest as a relaxation agent and will be examined in further studies. An additional point should be mentioned: Here we make the assumption that the order of magnitudes of relaxivities is more or less independent of the environment. This assumption has to be checked, as PRE strongly depends on molecular arrangements and tumbling frequencies.20–22
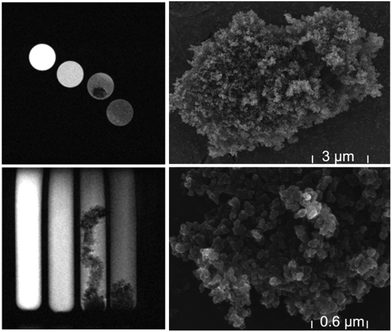
During the measurements, some samples started to separate especially at the lower concentrations up to 0.30 mM after about 24 hours. This phenomenon of separation had, of course, a large influence on the NMR relaxation times, and multi-exponential recovery curves were detected. In Fig. 4 a typical MRT image of the aggregation phenomenon is shown together with TEM images which reveal the surface structure of the agglomerates. In the MRT images, different concentrations were investigated from 1 mM to 0.1 mM, the lower concentrations show the agglomerates. To avoid problems with this trend of aggregation or agglomeration of the clusters, samples were prepared immediately before running the NMR experiments, and special care was taken that no aggregation processes occurred during the relaxivity measurements. Due to the inhomogeneous structure of biofilms, which are presented in the next section, this effect may also occur in the biofilm-carrier systems and probably reinforces the observed contrast, since image contrast is enhanced with respect to inhomogeneities and interfaces, in turn facilitating the observation of details in the water-rich biofilms.
Imaging of biofilms: transport and penetration of small molecules into the biofilm matrix
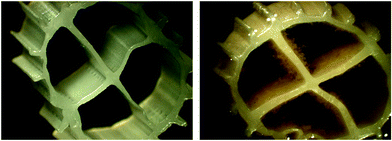
Biofilms are formed by attachment of microorganisms to interfaces and are omnipresent in natural as well as in technical systems.23 They form various structures with smooth, rough, fluffy, porous or compact texture which influence the biological activity.24 In municipal waste water systems, biofilms on carrier material (Fig. 5) are a popular option for biological treatment.25 Transport of substrates to the biofilm surface is essential for high turnover rates. The predominant transport process in the concentration layer at the interface bulk/biofilm and in the biofilm itself is diffusion.26 Advection dominates the transport in the surrounding. For a better understanding of structure and functionality, MRT contrast agents are used for structure determination and as tracers for mass transport. Recent studies show that the spatially and time resolved distribution of contrast agents like Gd-chelates can help to non-invasively determine effective diffusion coefficients of model systems such as agar and pure culture biofilms.27,28 The present systems are more complex: The heterogeneous biofilms grown on irregularly shaped carrier material have open patchy structures and fluffy surfaces.As little is known about the details of molecular transport into this technical biofilm matrix, the approach in the present paper is to apply different contrast agents with different molecular sizes as well as with different chemo-physical adsorption properties. With 4-Hydroxy-TEMPO, a small and hydrophilic molecule, a contrast agent is available, which does not agglomerate nor shows a pronounced surface activity (images not shown). Conventional Gadovist was applied, being well known as a medical relaxation agent, which can pass through tissue. The axial images obtained from long-term experiments after the injection of a bolus are compared with those obtained when applying the mentioned Fe10Gd10 clusters. The slice thickness was chosen to be 0.7 mm, the spatial resolution in the image plane is 80 μm × 80 μm, acquiring 256 data points in each direction for T1 weighted images. For T2 weighted and proton density images, a resolution of 160 μm × 160 μm, acquiring 128 data points in each direction, was chosen.
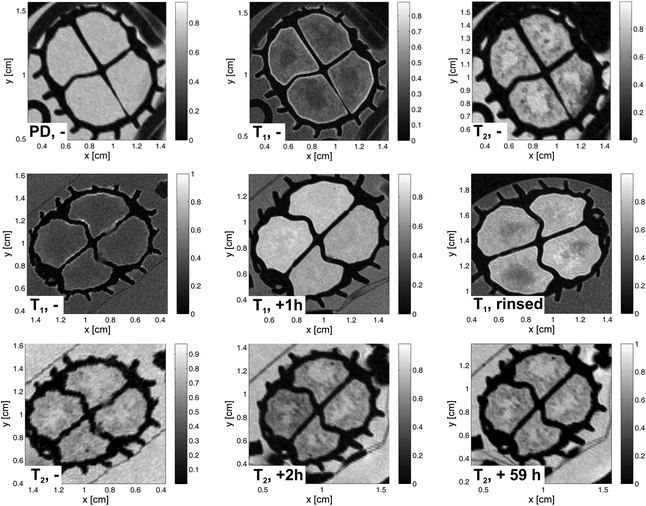
A carrier with biofilm has a relatively homogenous proton density distribution (Fig. 6), which is measured also with a multi slice multi echo sequence, but with the smallest possible echo time of 3.2 ms (4.5 ms for T1 weighted images) and a repetition time of 10 s to minimize the influence of relaxation contributions. Only the carrier itself can be clearly differentiated as the transverse relaxation is very short for hard polymer materials. The biofilm has an open structure and a low biomass density. The molecular mobility is not sufficiently hindered to show up in the relaxation times and surface related relaxation effects are found not to be dominant in the present system. In the middle of the upper row, a T1 weighted image allows the differentiation of biofilm and surrounding water in the bulk at short repetition times (in our case 800 ms) as “pure” water T1 relaxation is much slower than T1 of water in the biofilm. Finally, the T2 weighted image shows the reverse contrast: Biofilm appears with lower amplitudes compared with the surrounding water as T2 in the biofilm is shorter, which is in accordance with ref. 29. In the row in the middle of Fig. 6, T1 weighted images are displayed: In a reference image shown on the left the biofilm is barely visible on the carrier. When injecting Gadovist and waiting 58 h, the sections of the carrier, in which Gadovist was injected, appear with higher amplitudes, but still show little contrast to the water in the sections. When replacing the water in the carrier with fresh water and acquiring a T1 weighted image afterwards (right), regions of water and of biofilm can be differentiated. Water with the larger T1 appears in dark grey within the section. The picture becomes clearer in the case of T2 weighted images of the same carrier (bottom row), again on the left the reference image without Gadovist is given. In the middle, the image shows the biofilm directly after injection, whereas 59 h passed before acquiring the image on the right.
These experiments clearly show the influence of the relaxation agent. The T2 weighted images were recorded directly after the T1 weighted images to reflect the same state of the biofilm. In the T2 weighted images acquired after injection, the adsorption of the contrast agent into the biofilm surface is clearly visible. It seems that the fluffy biomass accumulated most of the Gadovist near the surface due to the high surface contact area. By comparing these to the images taken when no contrast agent was added, the full penetration of the Gadovist into the biomass is underlined. After rinsing the biofilm carriers the Gadovist situated in the bulk medium was removed. This indicates that Gadovist diffuses into the biofilm, and a dynamic equilibrium is observed between the water phase and the biofilm.
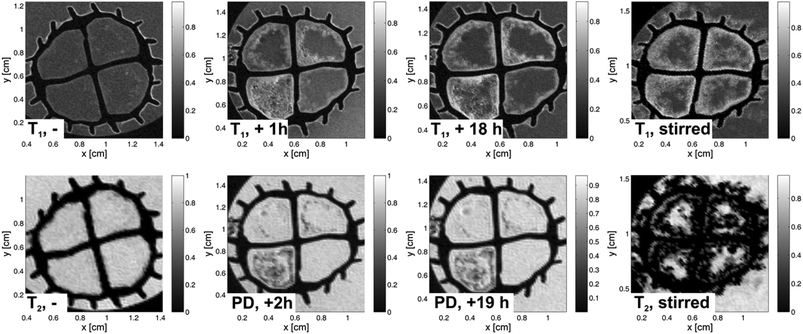
A similar experiment was performed injecting Fe10Gd10 as contrast agent into the sections of the carrier. In Fig. 7, the corresponding MRT images are shown as axial slices with a thickness of 0.7 mm and the same in-plane resolution as stated above. The rows correspond to T1 weighted images and T2 weighted (proton density) images, respectively. The left column is again the reference, the lower one being a T2 weighted image with an echo time of 50 ms. The contrast between water and biofilm is relatively poor. Directly after injection, images were acquired which show the influence of the high-spin cluster due to PRE as discussed in context of the relaxivity study. Interestingly, the surfaces of the biofilm become clear in both the T1 weighted and the proton density images, respectively. Structural features can be identified in the T1 weighted images, probably arising from the tendency of the Fe10Ln10 clusters to agglomerate. Given that the interfaces of biofilms are usually hard to detect, the Fe10Gd10 used here provides a novel and selective contrast enhancement. Furthermore, it bridges the gap between molecular contrast agents and classical magnetic nanoparticles.
After 18 h, T1 weighted and proton density images with identical MRT parameters were recorded; this showed that the situation did not change significantly. As shown in the section “Experimental”, the clusters tend to agglomerate, therefore the created contrast after injection of Fe10Gd10 can be understood as being due to the presence of the clusters especially on the biofilm surfaces. A quite strong interaction seems to be present, as no signature of diffusion neither into the surrounding water nor into the biofilm is obvious in the images. Furthermore, after stirring the solution, the effect increases (Fig. 7, right column): The T2 weighted image (Fig. 7, bottom row) shows this process very clearly. The short transverse relaxation times lead to vanishing signal amplitudes in the neighbourhood of the clusters and to a strong negative contrast in the image. Since the longitudinal relaxivity is also relatively large, the positive contrast is still visible in the T1 weighted image when using the smallest possible echo time. The comparison of both parameterized images of the same object in a similar state allows therefore the localization of the clusters at the biofilm's interfaces. When observing Fe10Gd10 as contrast agent in the carriers and when comparing with the behaviour of Gadovist it can be concluded that here penetration occurs more slowly than that of Gadovist, probably due to the molecular structure (mass, shape, surface functionality and radius: about 1.4 nm compared to a hydrodynamic radius of 0.9 nm for Gadovist) and especially due to agglomeration processes. In contrast to Gadovist, where a relatively unspecific reaction is observed, the Fe10Gd10 cluster focuses the image contrast onto the biofilm interfaces, seen especially clearly in the proton density and in the T2 weighted images due to the large r2 value. Less contrast agent is found in the “pure” bulk. This shows that Fe10Gd10 has a certain affinity for the biofilm's interfaces. Furthermore, differences in the biofilm structure can be imaged by focusing on areas where the contrast agents could penetrate as a function of time. The application of the Fe10Gd10 to fluffy biofilms offers new possibilities to visualize the biofilm/bulk boundary as well as to study the behaviour of contrast agents in biological systems – provided the biological compatibility and toxicological issues are proven.
Conclusion
The relaxivities of the highly paramagnetic cooperative clusters Fe10Ln10 were measured over a wide range of 1H Larmor frequencies from 10 MHz up to 1.4 GHz. Both relaxivities, r1 and r2, depend on the nature of LnIII. The transverse relaxivity r2 increases monotonically with field for all the investigated paramagnetic LnIII ions as does the longitudinal relaxivity r1 except for that of Fe10Gd10, which is almost constant up to high Larmor frequencies. As far as the clusters are presently understood, the major contributions to PRE are due to outer sphere dipolar and Curie contributions.In the first MRT application of Fe10Gd10 in a study of biofilms from waste water treatment, the PRE effect is confirmed as expected from the relaxivity investigations. Furthermore, a pronounced adhesion is observed on the biofilm's surfaces. As the clusters preferably adhere to the fractional surface of the biofilm, the image contrast is modified such that interfaces can be investigated in more detail.
Acknowledgements
Our work was funded by the German State of Baden-Württemberg, the Karlsruhe Institute of Technology (KIT) and the Deutsche Forschungsgemeinschaft as administrated through the Center for Functional Nanostructures (CFN) and within the DFG-instrumental facility center Pro2NMR. LNCMI Grenoble is member of the European Magnetic Field Laboratory (EMFL), and part of this work there has been supported by EuroMagNET under the EU contract no. 228043. Financial support of Julyana R. Machado was provided by Csf/CNPq-Conselho Nacional de Desenvolvimento Científico e Tecnológico, of the Ministry of Science, Technology and Innovation from Brazil, which is kindly acknowledged. Maria P. Herrling thanks the German Carl-Zeiss Foundation for financial support. Special thanks to Dr Jochen Junker for helpful discussions, to Dr Mladen Horvatić and Dr Hadrien Mayaffre for assistance at the LNCMI, and to Vanessa Grande for laboratory support. The relaxivities of water in the presence of Fe10Lu10 were investigated by Y. Maier. The TEM images and size analysis were performed at MVM by A. Huber, K. Hirsch, and T. Lebe, sincere thanks are given to them all.Notes and references
- A. Baniodeh, PhD-Thesis, Karlsruher Institut für Technologie (KIT), 2012.
- A. Baniodeh, C. E. Anson and A. K. Powell, Chem. Sci., 2013, 4, 4325–4536 RSC.
- J. R. Machado, A. Baniodeh, A. K. Powell, B. Luy, S. Krämer and G. Guthausen, ChemPhysChem, 2014, 15, 3608–3613 CrossRef CAS PubMed.
- X. P. Yang, D. Schipper, R. A. Jones, L. A. Lytwak, B. J. Holliday and S. M. Huang, J. Am. Chem. Soc., 2013, 135, 8468–8471 CrossRef CAS PubMed.
- I. Bertini, C. Luchinat and G. Parigi, Solution NMR of paramagnetic molecules: Applications to metallobiomolecules and models, Elsevier Science B.V., Amsterdam, 1st edn, 2001 Search PubMed.
- A. Baniodeh, Y. Liang, C. E. Anson, N. Magnani, A. K. Powell, A.-N. Unterreiner, S. Seyfferle, M. Slota, M. Dressel, L. Bogani and K. Goß, Adv. Funct. Mater., 2014, 24, 6280–6290 CrossRef CAS.
- M. Bottrill, L. K. Nicholas and N. J. Long, Chem. Soc. Rev., 2006, 35, 557–571 RSC.
- P. H. Fries, J. Chem. Phys., 2012, 136, 044504–044504 CrossRef PubMed.
- Y. Gossuin, A. Roch, F. Lo Bue, R. N. Muller and P. Gillis, Magn. Reson. Med., 2001, 46, 476–481 CrossRef CAS PubMed.
- D. Kruk, A. Korpala, J. Kowalewski, E. A. Rössler and J. Moscicki, J. Chem. Phys., 2012, 137, 044512–044512 CrossRef CAS PubMed.
- Q. L. Vuong, S. Van Doorslaer, J. L. Bridot, C. Argante, G. Alejandro, R. Hermann, S. Disch, C. Mattea, S. Stapf and Y. Gossuin, Magn. Reson. Mater. Phys., 2012, 25, 467–478 CrossRef CAS PubMed.
- S. Laurent, L. Vander Elst and R. N. Muller, Contrast Media Mol. Imaging, 2006, 1, 128–137 CrossRef CAS PubMed.
- I. Bertini, F. Capozzi, C. Luchinat, G. Nicastro and Z. C. Xia, J. Phys. Chem., 1993, 97, 6351–6354 CrossRef CAS.
- L. Van der Elst, A. Roch, P. Gillis, S. Laurent, F. Botteman, J. W. M. Bulte and R. N. Muller, Magn. Reson. Med., 2002, 47, 1121–1130 CrossRef PubMed.
- T. Nilsson, G. Parigi and J. Kowalewski, J. Phys. Chem. A, 2002, 106, 4476–4488 CrossRef CAS.
- S. Laurent, L. Vander Elst, A. Roch and R. N. Muller, in NMR-MRI, μSR and Mössbauer Spectroscopies in Molecular Magnets, ed. P. Carretta and A. Lascialfari, Springer, 2007, pp. 71–87 Search PubMed.
- G. Pintacuda, M. John, X. C. Su and G. Otting, Acc. Chem. Res., 2007, 40, 206–212 CrossRef CAS PubMed.
- A. Roch, Y. Gossuin, R. N. Muller and P. Gillis, J. Magn. Magn. Mater., 2005, 293, 532–539 CrossRef CAS.
- C. J. Meledandri, J. K. Stolarczyk, S. Ghosh and D. F. Brougham, Langmuir, 2008, 24, 14159–14165 CrossRef CAS PubMed.
- J. L. Barnhart, N. Kuhnert, D. A. Bakan and R. N. Berk, Magn. Reson. Imaging, 1987, 5, 221–231 CrossRef CAS PubMed.
- J. L. Barnhart and R. N. Berk, Invest. Radiol., 1986, 21, 132–136 CrossRef CAS PubMed.
- Y. Gossuin, C. Burtea, A. Monseux, G. Toubeau, A. Roch, R. N. Muller and P. Gillis, J. Magn. Reson. Imaging, 2004, 20, 690–696 CrossRef PubMed.
- J. W. Costerton, Z. Lewandowski, D. E. Caldwell, D. R. Korber and H. M. Lappinscott, Annu. Rev. Microbiol., 1995, 49, 711–745 CrossRef CAS PubMed.
- H.-C. Flemming and J. Wingender, Nat. Rev. Microbiol., 2010, 8, 623–633 CAS.
- H. Odegaard, Water Sci. Technol., 2006, 53, 17–33 CrossRef PubMed.
- P. S. Stewart, J. Bacteriol., 2003, 185, 1485–1491 CrossRef CAS PubMed.
- B. Ramanan, W. M. Holmes, W. T. Sloan and V. R. Phoenix, Appl. Environ. Microbiol., 2010, 76, 4027–4036 CrossRef CAS PubMed.
- B. Ramanan, W. M. Holmes, W. T. Sloan and V. R. Phoenix, Curr. Microbiol., 2013, 66, 456–461 CrossRef CAS PubMed.
- B. Manz, F. Volke, D. Goll and H. Horn, Biotechnol. Bioeng., 2003, 84, 424–432 CrossRef CAS PubMed.
| This journal is © The Royal Society of Chemistry 2015 |

