 Open Access Article
Creative Commons Attribution 3.0 Unported Licence
Axial fluoride binding by lanthanide DTMA complexes alters the local crystal field, resulting in dramatic spectroscopic changes†
Octavia A.
Blackburn
a,
Alan M.
Kenwright
b,
Paul D.
Beer
a and
Stephen
Faulkner
*a
aUniversity of Oxford, Chemistry Research Laboratory, 12 Mansfield Road, Oxford OX1 3TA, UK. E-mail: Stephen.Faulkner@chem.ox.ac.uk
bDepartment of Chemistry, University of Durham, South Road, Durham DH1 3LE, UK. E-mail: a.m.kenwright@dur.ac.uk
First published on 17th July 2015
Abstract
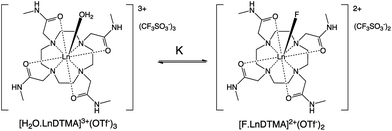
Addition of fluoride to aqueous solutions of lanthanide complexes of DTMA results in the formation of ternary complexes of the form [F·Ln·DTMA]2+ in which an axial solvent molecule is displaced by fluoride. [F·Ln·DTMA]2+ and [H2O·Ln·DTMA]3+ are in exchange on a timescale of around 1 s. Dramatic changes are observed in both the NMR and luminescence spectra of the complexes: these are consistent with a change in the nature of the magnetic anisotropy at the paramagnetic lanthanide centre, itself arising from a change in the local crystal field. Study of paramagnetic lanthanide complexes with anisotropic electronic distributions reveals that, upon replacing water with fluoride, there is an inversion of the sign, and a significant reduction in the magnitude, of the crystal field term that defines the nature of the pseudocontact shift.
The spectroscopic properties of lanthanide complexes have been studied in depth for many years as a consequence of their utility in a wide variety of applications. For the last three decades, the application of such complexes has been dominated by the use of gadolinium complexes in magnetic resonance imaging (MRI) and the use of luminescent lanthanide complexes in time-resolved bioassays.1 More recently, magnetic resonance spectroscopy methods for imaging have been diversified to other lanthanide complexes through the exploration of PARACEST and PARASHIFT probes,2 while the molecular magnetism of paramagnetic lanthanide complexes has become a burgeoning field of interest.3 Furthermore, the use of polydentate ligands that incompletely saturate the lanthanide coordination sphere has resulted in a diverse range of systems in which solvent is displaced by anionic analytes, giving responsive systems that can be used to probe analyte concentration, or applied in early diagnosis of disease.4
All of these studies are only possible because of the fundamental properties of paramagnetic lanthanide complexes. Among the tripositive ions, gadolinium is exceptional, in that its 4f7 configuration is defined by a 8S7/2 ground state with a spherical electronic distribution in the free ion. For all the other paramagnetic lanthanide(III) ions, there is inherent anisotropy to the electronic distribution around the metal centre. Although crystal field effects for lanthanide complexes are small by comparison with the d-block transition metals, the crystal field still has significant consequences for the behaviour of lanthanide-containing systems.
For more than forty years, Bleaney's ideas have dominated our understanding of the NMR of lanthanide complexes.5 Bleaney pointed out that the observed chemical shift for a given nucleus can be defined in terms of the sum of dipolar or pseudocontact (through-space) and contact (through-bond) contributions, in addition to the usual diamagnetic shift. In most lanthanide-containing complexes, the pseudocontact term, δP, is the dominant factor in determining the observed shift for the nuclei of common ligand architectures. For an axially symmetric system,
 | (1) |
Crystal field effects also influence the photophysical properties of the lanthanides, though to a less profound degree. The fine structure of the observed transitions in optical spectra is a direct consequence of crystal field effects: in luminescence spectra, this is a consequence of the degeneracies of both ground and excited states being lifted by the ligand field.
Despite the rapid development of the field in general, there has been relatively little work done to correlate local ligand field effects with the properties of complexes. Parker and co-workers explored the effect of changing solvent (and thus axial donor) on lanthanide tetraamide complexes,6 and have recently studied the scope and limitations of Bleaney's theory applied to a range of complexes.7
It has now become apparent that the crystal field splitting (including higher order terms) plays a more significant part in determining the observed properties of lanthanide complexes (including the electronic relaxation time, T1e)8 than was previously supposed, and that the ability to manipulate and control this parameter is likely to play an important role in the design of new complexes. The observation of dramatic changes in this parameter on ligand binding is therefore of significance.
Study of the interactions of halide guests with stable octadentate complexes are equally rare. Aime et al. observed that addition of fluoride caused significant changes to the NMR spectra of lanthanide–DOTA complexes.9 More recently, Charbonnière and co-workers have observed strong fluoride binding in C2 symmetric systems, though without discussing the consequences of binding on ligand field.10
This manuscript presents a detailed study of the interactions of paramagnetic lanthanide complexes with fluoride ions in water, using luminescence and NMR spectroscopies to characterise the effect of the changes in ligand field on the observed spectra. This work extends our recent work on the ytterbium complex of DTMA to the whole series.11
Materials and methods
The tetraamide ligand DTMA (1,4,7,10-tetrakis[(N-methylcarbamoyl)methyl]-1,4,7,10-tetraaza-cyclododecane) and its lanthanide complexes (Pr to Lu, minus Gd with Pm, plus Y) were synthesised as their trifluoromethanesulfonate salts, as previously described.12 Full details of methods used for NMR and luminescence spectroscopies and data fitting can be found in the ESI† associated with this paper.Results and discussion
Luminescence spectroscopy
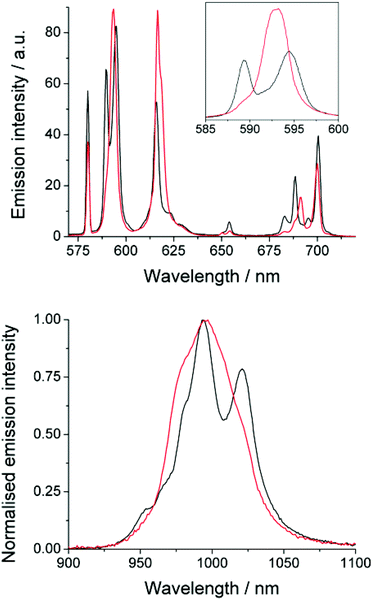
The emission spectrum of EuDTMA was recorded in the presence and absence of sodium fluoride in aqueous solution (Fig. 1). Significant changes are observed in both the form and intensity of the bands, in particular the ΔJ = 1 and ΔJ = 4 bands show a marked change in shape. The nature of the Stark splitting of the ΔJ = 1 band (ca. 590 nm) has been used as a direct measure of the magnitude, and sometimes sign, of the second order crystal field coefficient, B20, in axially symmetric systems.13 Upon addition of fluoride, the Stark splitting of ΔJ = 1 dramatically decreases and A and E components merge to form one apparent peak. This indicates that the second order crystal field parameter has dramatically decreased in magnitude. Information about any change in sign of B20 is unresolvable, even at narrower slit widths. Such a striking effect on B20 would indicate a significant change to the crystal field around the europium centre.Near-IR emission from YbDTMA was also recorded in the presence and absence of fluoride upon excitation at 265 nm (Fig. 1). Once again, the shape of the spectrum is significantly altered. Although interpretation of the Stark splitting is much more complex due to the high J-multiplicity of the excited (2F5/2) and ground (2F7/2) states, we can infer a change in B20 analogous to that observed with Eu.
The effects of fluoride on the luminescence lifetimes of EuDTMA were also investigated. The Eu-based lifetime increased on addition of excess fluoride from 0.54 to 1.07 ms in H2O, and 1.72 to 2.41 ms in D2O. This corresponds to a change in the number of bound water molecules, q,14 from 0.9 to 0, indicating that the axially bound water is displaced by fluoride (Scheme 1).
NMR studies on diamagnetic complexes
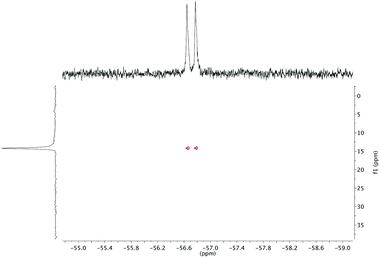
The effect of fluoride on the proton NMR spectra of LuDTMA and YDTMA complexes was measured in D2O (see ESI†). Addition of sodium fluoride to a solution of LuDTMA caused a significant shifting of the resonances corresponding to the CH2 cyclen ring protons and the amide arm protons, in line with a fast exchange process on this timescale. In the case of YDTMA, the exchange appears to be slower, with a new set of resonances emerging while the original peaks diminish, although some shifting of the peaks indicates an intermediate exchange rate (i.e. the exchange rate is non-negligible on the relevant NMR timescales).The 19F NMR proves to be more revealing. In addition to the expected fluoride peak at −122 ppm, resonances are also found at −74 and −58 ppm for LuDTMA and YDTMA respectively (see ESI†). Saturation transfer experiments reveal that these peaks are in exchange with those corresponding to free fluoride at −122 ppm. The −74 ppm peak in the LuDTMA spectrum is broader than that at −58 ppm with YDTMA at 298 K, but sharpens up on cooling in corroboration with the faster exchange rate observed in the 1H NMR. More interestingly, the peak at −58 ppm in the YDTMA spectrum is a doublet with a coupling constant of 64 Hz, which remains when the spectrum is recorded with proton decoupling and does not vary with the applied field. This splitting is indicative of traditional spin–spin coupling between the 19F and 89Y nuclei. The presence of 89Y–19F J-coupling was confirmed by 19F detected HMQC (Fig. 2). These observations indicate that fluoride is bound at the lanthanide centre and is in exchange with bulk fluoride in a process that is slow on the timescale of these 19F experiments. The 89Y–19F doublet indicates that the binding event is of 1![[thin space (1/6-em)]](https://www.rsc.org/images/entities/char_2009.gif) :
:![[thin space (1/6-em)]](https://www.rsc.org/images/entities/char_2009.gif) 1 stoichiometry. Since significant coupling between the nuclei is observed, we can infer that there must be some orbital overlap between the Ln and F atoms and we would expect a contact contribution to the lanthanide-induced shift (LIS) of the fluoride (see below). Note that this does not necessarily imply covalent bonding since 19F nuclei are well known for showing coupling through non-bonding overlap of lone pairs.15
1 stoichiometry. Since significant coupling between the nuclei is observed, we can infer that there must be some orbital overlap between the Ln and F atoms and we would expect a contact contribution to the lanthanide-induced shift (LIS) of the fluoride (see below). Note that this does not necessarily imply covalent bonding since 19F nuclei are well known for showing coupling through non-bonding overlap of lone pairs.15
NMR studies on paramagnetic complexes
Proton NMR spectra of paramagnetic DTMA complexes with and without added fluoride were recorded in D2O for lanthanides from Pr to Yb across the series (excluding Pm and Gd), and are shown in Fig. 5. Of the paramagnetic lanthanides, the NMR spectra of Yb complexes are most straightforward to interpret due to the domination of the pseudocontact contribution to the LIS felt by nearby nuclei, meaning that we can largely neglect the contact contribution and describe the shift using eqn (1). Furthermore, YbDTMA adopts only one conformation in solution, the square-antiprism (SAP). Upon addition of fluoride to a solution of YbDTMA, the original set of seven peaks appears to diminish in intensity and a new set of peaks grows in (Fig. 3). Given our other observations, we can surmise that these new peaks correspond to a fluoride-bound complex in slow exchange with the original hydrated species on this timescale. Notably, the range of chemical shifts spanned by the resonances of the new species is much smaller than that of the original (approximately 50 compared with 160 ppm). A two-dimensional exchange correlation spectrum (EXSY) confirms that the original peaks and the new set are in exchange (Fig. 3). Further inspection of the EXSY cross-peaks reveals that, on binding fluoride, the sign of the chemical shift of each proton changes, and the ordering of the peaks (from low frequency to high) is reversed. From eqn (1), it is clear that the only variable that can cause such changes is B20. This NMR data suggests that the magnitude of B20 is decreased and that its sign is reversed upon binding of fluoride in the axial site in place of water. The decreased magnitude of B20 corroborates the observed changes in the EuDTMA emission spectrum.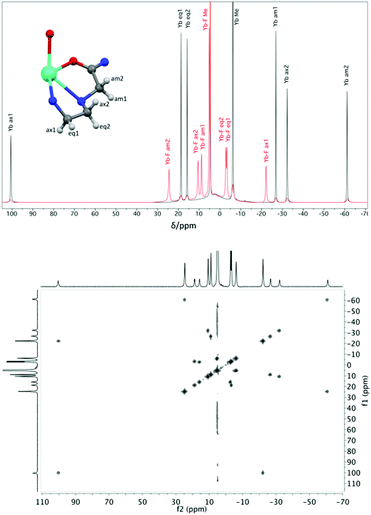 | ||
| Fig. 3 Top: 1H NMR spectra (400 MHz, 298 K, D2O) of YbDTMA in the absence (black) and presence (red) of an excess of sodium fluoride, with assignments based on the labelled portion of the complex shown (using DyDTMA crystal structure12). Bottom: EXSY spectrum of YbDTMA with fluoride at 298 K with a mixing time of 1 ms at 500 MHz. | ||
Assignment of the resonances of YbDTMA, shown in Fig. 3, was achieved by comparison with similar compounds in the literature16 and is confirmed by a linear plot of the observed LIS vs. (3cos2![[thin space (1/6-em)]](https://www.rsc.org/images/entities/char_2009.gif) ϑ − 1)/r3 according to eqn (1) for the six CH2 protons. Values of (3cos2
ϑ − 1)/r3 according to eqn (1) for the six CH2 protons. Values of (3cos2![[thin space (1/6-em)]](https://www.rsc.org/images/entities/char_2009.gif) ϑ − 1)/r3 were taken from the closest available crystal structure ((DyDTMA·H2O)(PF6)3).12 The LIS is given by the observed shift (δobs) minus the diamagnetic contribution (δD). Here, 2.9 ppm was subtracted from each experimental shift as the estimated diamagnetic contribution, providing approximate values for the LIS. The six protons of the ligand backbone are labelled throughout this article, as axial (ax) 1/2, equatorial (eq) 1/2 and amide (am) 1/2, according to the representation of the atoms shown in Fig. 3. The assignment of the protons of the fluoride-bound YbDTMA complex can be inferred from the EXSY spectrum. A plot of the LIS values vs. (3cos2
ϑ − 1)/r3 were taken from the closest available crystal structure ((DyDTMA·H2O)(PF6)3).12 The LIS is given by the observed shift (δobs) minus the diamagnetic contribution (δD). Here, 2.9 ppm was subtracted from each experimental shift as the estimated diamagnetic contribution, providing approximate values for the LIS. The six protons of the ligand backbone are labelled throughout this article, as axial (ax) 1/2, equatorial (eq) 1/2 and amide (am) 1/2, according to the representation of the atoms shown in Fig. 3. The assignment of the protons of the fluoride-bound YbDTMA complex can be inferred from the EXSY spectrum. A plot of the LIS values vs. (3cos2![[thin space (1/6-em)]](https://www.rsc.org/images/entities/char_2009.gif) ϑ − 1)/r3 from the YbDTMA-F complex also gives a straight line, although Fig. 4 shows that the gradient of the line is now smaller and opposite in sign, consistent with the proposed changes to B20. Analysis of the slopes of the Bleaney plots reveals that B20 has been reduced to around 28% of its original value upon binding of fluoride.
ϑ − 1)/r3 from the YbDTMA-F complex also gives a straight line, although Fig. 4 shows that the gradient of the line is now smaller and opposite in sign, consistent with the proposed changes to B20. Analysis of the slopes of the Bleaney plots reveals that B20 has been reduced to around 28% of its original value upon binding of fluoride.
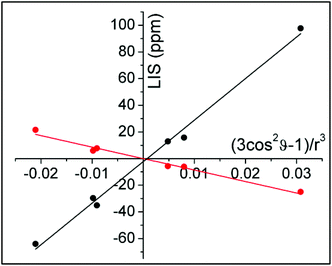 | ||
| Fig. 4 Bleaney plots for YbDTMA proton resonances in the absence (black) and presence (red) of an excess of sodium fluoride in D2O, using atomic coordinates from the crystal structure of DyDTMA.12 | ||
Having assessed changes in the proton spectrum of YbDTMA with fluoride, we then investigated the other paramagnetic lanthanides. In each case, a second set of peaks emerged in slow exchange with the original peaks (Fig. 5). Analysis of the proton spectra of complexes of paramagnetic lanthanides other than Yb is complicated by (a) a significant contact shift contribution to the LIS, (b) large linewidths and (c) the presence of multiple isomers in solution (SAP and TSAP). The presence of differing contact contributions to each proton shift in theory prevents the use of the LIS vs. (3cos2![[thin space (1/6-em)]](https://www.rsc.org/images/entities/char_2009.gif) ϑ − 1)/r3 relationship. Nevertheless, linear Bleaney plots are obtained for complexes with a relatively small contact contribution to their LIS (Tb, Dy, Ho, Er, Tm), by analogy with the YbDTMA assignment (see ESI†). Whilst proton spectra of the DTMA complexes of the second half of the series show some resemblance to the YbDTMA spectrum, the contact shift distorts the spectrum of EuDTMA significantly and its Bleaney plot shows substantial deviation from linearity. It should be stressed that the contact shift contribution to the observed shifts of typical ligand protons cannot be neglected for the earlier lanthanides such as Eu3+. The assignment process is aided by inspection of T1 relaxation times/linewidths considering the r−6 dependence (where r is the Ln–H distance). Three protons have r = 3.6–3.7 Å, and the second set of three have r = 4.3 Å, resulting in two clusters of T1 values. Assignment of the proton spectra of the fluoride-bound complexes is more difficult due to severe overlapping of peaks and the apparent unpredictability of the shifts, moreover EXSY spectra are largely uninformative due to the broad lines. However, reasonably linear Bleaney plots are achieved for Tm, Er, Dy and Tb (see ESI†). Data for HoDTMA could not be extracted since the greatly reduced chemical shift range results in severe peak overlap.
ϑ − 1)/r3 relationship. Nevertheless, linear Bleaney plots are obtained for complexes with a relatively small contact contribution to their LIS (Tb, Dy, Ho, Er, Tm), by analogy with the YbDTMA assignment (see ESI†). Whilst proton spectra of the DTMA complexes of the second half of the series show some resemblance to the YbDTMA spectrum, the contact shift distorts the spectrum of EuDTMA significantly and its Bleaney plot shows substantial deviation from linearity. It should be stressed that the contact shift contribution to the observed shifts of typical ligand protons cannot be neglected for the earlier lanthanides such as Eu3+. The assignment process is aided by inspection of T1 relaxation times/linewidths considering the r−6 dependence (where r is the Ln–H distance). Three protons have r = 3.6–3.7 Å, and the second set of three have r = 4.3 Å, resulting in two clusters of T1 values. Assignment of the proton spectra of the fluoride-bound complexes is more difficult due to severe overlapping of peaks and the apparent unpredictability of the shifts, moreover EXSY spectra are largely uninformative due to the broad lines. However, reasonably linear Bleaney plots are achieved for Tm, Er, Dy and Tb (see ESI†). Data for HoDTMA could not be extracted since the greatly reduced chemical shift range results in severe peak overlap.
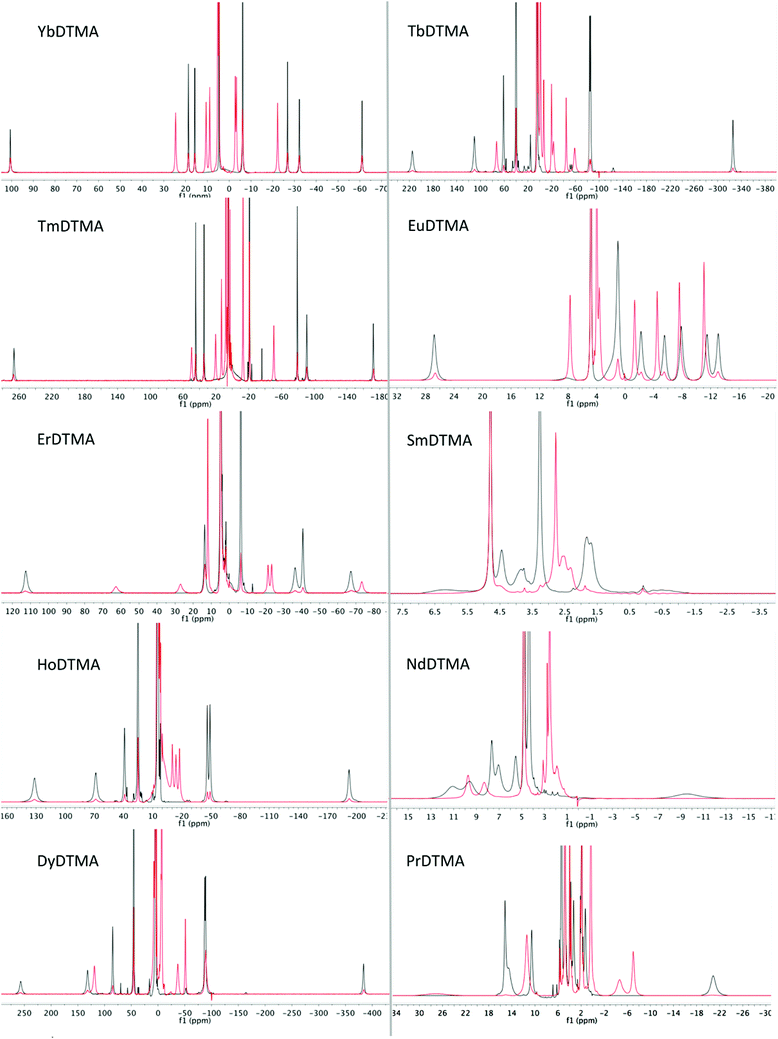 | ||
| Fig. 5 1H NMR spectra of paramagnetic lanthanide complexes of DTMA from Pr to Yb (excluding Pm and Gd) in D2O at 298 K in the absence (black) and presence (red) of an excess of sodium fluoride. | ||
In order to assess changes to the pseudocontact and contact contributions to the ligand proton shifts upon fluoride binding, it is necessary to separate the two components. This is most commonly achieved using the so-called Reilley method.17 The paramagnetic influence on the shift is expressed as a sum of contact (δC) and pseudocontact (δP) contributions, that can be written as products of lanthanide dependant terms (〈SZ〉 and CJ respectively) and terms characteristic of the observed nuclei (F and G respectively):
| LIS = δobs − δD = δC + δP = 〈SZ〉F + CJG | (2) |
Method A
Method B
Linear plots of LIS/〈SZ〉 vs. CJ/〈SZ〉 (Method A), and LIS/CJvs. 〈SZ〉/CJ (Method B) across the series allow extraction of F and G values for each nucleus and thus the contact and pseudocontact contributions can be evaluated. Method A is more appropriate for pseudocontact dominated shifts and Method B for contact dominated shifts. The Reilley treatment makes a number of assumptions about the complexes across the series: (a) complexes are isostructural, (b) the crystal field parameter, B20, is invariant, and (c) the hyperfine coupling constant, A/ħ, is invariant.
Having assigned the proton resonances for a number of LnDTMA complexes, we were able to obtain Reilley plots (Method A) both in the presence and absence of fluoride with R2 values above 0.9 (Fig. 6, Table 1). The methyl protons were also included in this treatment since they are easily identified. Values of G (slope) and F (intercept) extracted from the plots are given in Table 1. The quality of the Reilley plots can also be judged by assessing the difference between the experimental shifts and those calculated based on the extracted F and G values for each proton; differences for YbDTMA for example are at most 5% (see ESI†).
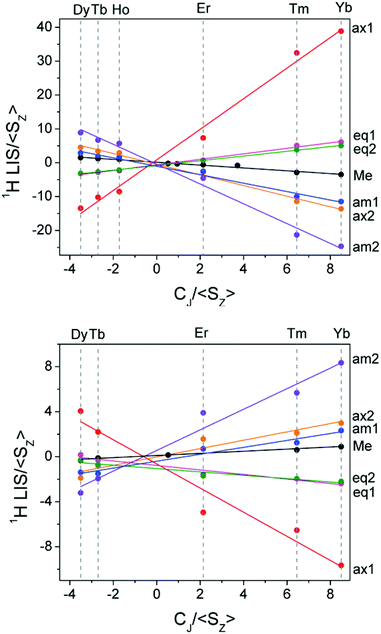 | ||
| Fig. 6 Reilley plots (Method A) for the proton shifts of LnDTMA in D2O at 298 K without added fluoride (top) and for the fluoride-bound species (bottom). | ||
| Proton | G (slope) | F (intercept) | R 2 | |||
|---|---|---|---|---|---|---|
| No F− | +F− | No F− | +F− | No F− | +F− | |
| Axial 1 | 4.52 | −1.07 | 0.82 | −0.64 | 0.99 | 0.94 |
| Axial 2 | −1.57 | 0.37 | −0.45 | −0.02 | 0.99 | 0.91 |
| Eq. 1 | 0.81 | −0.20 | −0.65 | −0.78 | 0.99 | 0.94 |
| Eq. 2 | 0.70 | −0.15 | −0.83 | −1.05 | 1.00 | 0.91 |
| Amide 1 | −1.25 | 0.31 | −1.05 | −0.40 | 0.98 | 0.95 |
| Amide 2 | −2.93 | 0.92 | −0.42 | 0.55 | 0.99 | 0.96 |
| Methyl | −0.42 | 0.09 | 0.14 | 0.05 | 0.97 | 0.98 |
The G values for each proton, which characterise the pseudocontact shifts, change sign with fluoride as expected and their magnitudes are reduced to between 21 and 31% of their original values, in agreement with the change observed from the Bleaney treatment for Yb above. Conversely, the changes in the F values (which define the contact shifts) upon fluoride addition are not constant across all of the protons. Some protons, e.g. the equatorial protons, see only a small change in the contact contribution to their shifts. Meanwhile, for axial 1 and amide 2, F changes in sign whilst their magnitudes vary little, meaning that the effect of the contact shift on these resonances is reversed. It is notable that the protons which feel the largest change in contact shift with fluoride are those closest to 90 and 180° with respect to the molecular axis, though account should be taken of the change in anisotropy, discussed below. In general, the reduction in magnitude of the pseudocontact shift with fluoride results in an increased proportion of contact contribution to the shift since the magnitude of F is only so drastically reduced in the case of axial proton 2. It is this relative increase in contact contribution combined with the large variation in the change of the contact shift with fluoride that makes the proton shifts of the fluoride-bound complex difficult to assign.
The 19F NMR spectra of paramagnetic LnDTMA complexes with added fluoride revealed peaks for bound fluoride with large shifts, although only in a few cases: Nd 231 ppm, Sm −112 ppm, Eu −479 ppm, Tm −1600 ppm, Yb −858 ppm. These peaks display short T1 relaxation times, as expected (μs–ms order). In each case, the T1 of the free fluoride peak at −122 ppm is diminished compared to a fluoride solution containing no LnDTMA. The free fluoride T1 becomes longer as the concentration of fluoride is increased, consistent with a weighted average value due to exchange. Saturation of the bound fluoride peak results in diminished intensity of the free fluoride peak and vice versa, confirming that chemical exchange between the two is taking place. The ratio of the intensity of the bound fluoride peak to that of the triflate counterion gives an estimation of the proportion of the complex that has a bound fluoride ion. The same ratio can be obtained from the proton spectra of the same sample by integration of the two sets of peaks, and this ratio matched well with that from the 19F spectra. This is a good indication that the shifted 19F peaks correspond to the same species as the proton signals that emerge on addition of fluoride. The linewidths of these bound fluoride peaks are generally a lot broader than the analogous peaks of the diamagnetic complexes, although that for Eu is less than twice as wide as for Lu. The observed lines are perhaps not as broad as might be anticipated,20 and the same observation was made recently for the 17O resonances of LnDOTA complexes,21 although it is likely that the analogous peaks for the remaining paramagnetic lanthanides are undetectable due to extensive broadening. Line broadening of 19F− in this case is obviously affected by exchange as well as proximity to paramagnetic ions.
The contact and pseudocontact contributions to the bound fluoride shift can be assessed in the same way as for the protons. Reilley analysis with the available shifts gives good linear plots (R2 ≥ 0.93) for the metals available using both Methods A and B (see ESI†), using the shift of bound fluoride in the Lu complex to subtract the diamagnetic contribution. Samarium is anomalous in both cases and is omitted from the analysis; Sm3+ is well known to have a highly variable 〈SZ〉 and therefore be an outlier in such treatments.18 There is good agreement between the F and G values given by the two plots and average values of F = −37.7 and G = −28.0 are obtained. The much greater magnitudes of the F and G values compared with those of the ligand protons, despite similar gyromagnetic ratios, reflect the smaller values of r and θ, and the increased influence of the unpaired electron density on the 19F nucleus. As expected for a nucleus directly bound to the lanthanide centre, there is a significant contact contribution to the fluoride LIS.
These assessments of the proton and fluorine shift data indicate that the assumptions of the Reilley method hold true for LnDTMA complexes and their fluoride-adducts. In particular, our conclusions about changes to the sign and magnitude of the crystal field parameter B20 can be applied across the lanthanide series.
Exchange rates
Some indications about the rate of exchange of fluoride at the lanthanide centre can be gleaned from NMR spectra. Firstly, the presence of the 89Y–19F doublet suggests that fluoride is binding to the yttrium centre in a process that is not appreciably faster than 64 Hz. Secondly, 1H and 19F NMR indicate that the fluoride exchange process is faster for LuDTMA than YDTMA (see above). Since we would expect binding at the axial site to take place via a dissociative mechanism by analogy with water exchange,12,22 we can infer that the faster rate for Lu may be due to an increased rate of dissociation of the bound species due to steric crowding at the axial site.Exchange rates can be quantified using NMR techniques. Selective inversion experiments, monitoring the intensity of the exchanging peaks after a selective pulse, are difficult to carry out on these systems due to large chemical shift separations and fast T1s. When this technique was attempted with the 19F spectrum of YDTMA, we were unable to fit the data to a simple 2-site exchange. Since the fluoride-bound species can be formed by exchange with either water or fluoride in the axial site, distinct rates will become convoluted and analysis becomes difficult with the available data. We therefore attempted to obtain approximate, averaged rates using a saturation transfer technique with 19F spectra based on a previously described method (see ESI† for details).23 Rates for Eu, Y, Yb and LuDTMA complexes were calculated to be around 1 s−1, although this value is affected by concentration and K. The exchange of fluoride for water at the lanthanide can therefore be considered to be a relatively slow process in comparison with, for example, the exchange of water (kex = 6.4(±1.5) × 103 s−1 for EuDTMA, SAP isomer).12
Determining association constants with fluoride
The association of fluoride with LnDTMA was quantified to give binding constants (K) using NMR and luminescence techniques. In all cases a 1![[thin space (1/6-em)]](https://www.rsc.org/images/entities/char_2009.gif) :
:![[thin space (1/6-em)]](https://www.rsc.org/images/entities/char_2009.gif) 1 binding model was used within the DYNAFIT program.24 Association constants with confidence intervals are given in Table 2.
1 binding model was used within the DYNAFIT program.24 Association constants with confidence intervals are given in Table 2.
| K/M−1 | |||
|---|---|---|---|
| 1H NMR | 19F NMR | Luminescence | |
a In all cases, the data was modelled according to a 1![[thin space (1/6-em)]](https://www.rsc.org/images/entities/char_2009.gif) : :![[thin space (1/6-em)]](https://www.rsc.org/images/entities/char_2009.gif) 1 binding model, using the equilibrium: (LnDTMA − H2O)3+ + F− ⇌ (LnDTMA − F)2+ + H2O 1 binding model, using the equilibrium: (LnDTMA − H2O)3+ + F− ⇌ (LnDTMA − F)2+ + H2O  |
|||
| EuDTMA | 57.5 [47.7–69.5] | 47.4 [30.0–80.2] | 78.9 [56.2–113.9] |
| YDTMA | 48.7 [35.6–66.5] | 31.4 [22.4–45.0] | — |
| YbDTMA | 9.38 [7.64–11.43] | — | — |
| LuDTMA | 10.2 [8.9–11.7] | 12.8 [9.7–17.2] | — |
We were able to use changes to the 1H NMR spectra upon titration with sodium fluoride to assess fluoride binding for Eu3+, Y3+, Yb3+ and Lu3+ DTMA complexes. For the systems in slow exchange (Eu3+, Y3+, Yb3+), the binding isotherms were obtained by integration of the signals relative to the water-soluble standard DSS (4,4-dimethyl-4-silapentane-1-sulfonic acid), while for LuDTMA the shifting resonances were monitored. For titrations by 19F NMR, the increasing intensity of the bound fluoride peak was monitored with respect to the intensity of the CF3SO3− counterion. Changes to the europium emission spectrum provided a third method of monitoring the interaction. The ratios of the intensity of the hypersensitive ΔJ = 2 transition vs. those of the ΔJ = 1 and 4 transitions were used to monitor the changes in the local coordination sphere of the Eu3+ ion. For further details of all procedures, see ESI.†
Where multiple independent titrations were carried out on the same complex by different methods, the values obtained are within error of one-another, confirming that the observed changes in the spectra correspond to the same event. However, there does seem to be a significant difference in K across the series with Eu and Y complexes having higher association constants than Yb and Lu complexes. It might be expected that decreasing ionic radii across the series would infer increasing binding constants due to increasing charge density [9 coordinate ionic radii (pm): Eu3+ 112, Y3+ 108, Yb3+ 104, Lu3+ 103].25 However, the decreased ionic size also results in the ligand enveloping more of the lanthanide ion and so less space is available in the axial site for ligand binding. The two factors are competing and in the case of fluoride, the steric factor appears to be dominant. A similar conclusion was postulated by Aime et al. on comparison of fluoride's interaction with Yb and Eu complexes of DOTA.9
It should be noted that the values obtained here are small in comparison to those recently reported by Charbonnière and co-workers,10 though their system forms 2![[thin space (1/6-em)]](https://www.rsc.org/images/entities/char_2009.gif) :
:![[thin space (1/6-em)]](https://www.rsc.org/images/entities/char_2009.gif) 1 complexes in which the fluoride binds between two lanthanide centres as a result of strong interactions between hydrophobic domains in both lanthanide complexes. In our case, no improvement in fit was observed with 2
1 complexes in which the fluoride binds between two lanthanide centres as a result of strong interactions between hydrophobic domains in both lanthanide complexes. In our case, no improvement in fit was observed with 2![[thin space (1/6-em)]](https://www.rsc.org/images/entities/char_2009.gif) :
:![[thin space (1/6-em)]](https://www.rsc.org/images/entities/char_2009.gif) 1 binding models, suggesting that 1
1 binding models, suggesting that 1![[thin space (1/6-em)]](https://www.rsc.org/images/entities/char_2009.gif) :
:![[thin space (1/6-em)]](https://www.rsc.org/images/entities/char_2009.gif) 1 complexation does indeed occur. Furthermore the observation of a doublet for fluoride bound to the yttrium complex bears out 1
1 complexation does indeed occur. Furthermore the observation of a doublet for fluoride bound to the yttrium complex bears out 1![[thin space (1/6-em)]](https://www.rsc.org/images/entities/char_2009.gif) :
:![[thin space (1/6-em)]](https://www.rsc.org/images/entities/char_2009.gif) 1 complexation in our system. The binding constants are likely to reflect the thermodynamic costs of solvent reorganisation and desolvation of both the lanthanide centre and the fluoride ion, as well as the electrostatic attraction between the lanthanide and the fluoride.
1 complexation in our system. The binding constants are likely to reflect the thermodynamic costs of solvent reorganisation and desolvation of both the lanthanide centre and the fluoride ion, as well as the electrostatic attraction between the lanthanide and the fluoride.
Summary and conclusions
Binding of fluoride by lanthanide DTMA complexes results in dramatic changes in the behaviour of the fluoride bound species relative to that of their analogues with coordinated water, which result from a change in the sign and magnitude of the crystal field term. While we have discussed these changes in terms of a simple crystal field splitting parameter and related this directly to B20, as is commonly done for axially symmetric complexes, it seems likely that these dramatic changes would also affect higher order terms in Bkq.7 We can interpret the observed phenomena in terms of a change in the anisotropy of the magnetic suceptibility tensor i.e. moving from a prolate system in which the anisotropic distribution of electrons aligns with the axis of symmetry to an oblate one, or vice versa. Scheme 2 offers a pictorial representation of these changes for the later lanthanides.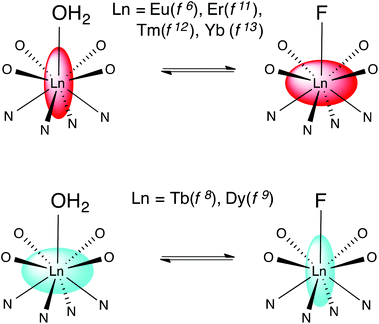 | ||
| Scheme 2 Representing the change in magnetic anisotropy upon fluoride binding for the later lanthanides. | ||
It is clear from these results that the ligand donor set is of vital importance in determining the properties of lanthanide complexes. That importance has already become apparent in the field of lanthanide magnetism, and it clearly has relevance for a wide variety of areas from ligand design to MRI applications. Furthermore, calculation of ground states for lanthanide compounds must take account of ligand field if we are to explain anisotropy properly.
It is also worth noting that, despite binding weakly to the metal centre, slow exchange of fluoride implies significant reorganisation of the solvation sphere upon binding. We are exploring ways to exploit both this slow exchange and the dominance of the axial ligand in designing and applying new ligand systems.
Acknowledgements
The Authors acknowledge the Universities of Oxford and Durham for support. The research leading to these results has received funding from the European Research Council under the European Union's seventh Framework Programme (FP7/2007_2013)/ERC-Advanced Grant Agreement Number 267426.Notes and references
- (a) P. Caravan, J. J. Ellison, T. J. McMurry and R. B. Lauffer, Chem. Rev., 1999, 99, 2293–2352 CrossRef CAS PubMed; (b) S. Faulkner and O. A. Blackburn, in The Chemistry of Molecular Imaging, ed. N. Long and W. T. Wong, Wiley, Chichester, 2015, ch. 8 Search PubMed; (c) J.-C. G. Bünzli and C. Piguet, Chem. Soc. Rev., 2005, 34, 1048–1077 RSC; (d) S. V. Eliseeva and J.-C. G. Bünzli, Chem. Soc. Rev., 2009, 39, 189–227 RSC.
- (a) S. Viswanathan, Z. Kovacs, K. N. Green, S. J. Ratnakar and A. D. Sherry, Chem. Rev., 2010, 110, 2960–3018 CrossRef CAS PubMed; (b) M. Woods, D. E. Woessner and A. D. Sherry, Chem. Soc. Rev., 2006, 35, 500–511 RSC; (c) P. Harvey, A. M. Blamire, J. I. Wilson, K.-L. N. A. Finney, A. M. Funk, P. K. Senanayake and D. Parker, Chem. Sci., 2013, 4, 4251–4258 RSC.
- (a) D. N. Woodruff, R. E. P. Winpenny and R. A. Layfield, Chem. Rev., 2013, 113, 5110–5148 CrossRef CAS PubMed; (b) L. Sorace, C. Benelli and D. Gatteschi, Chem. Soc. Rev., 2011, 40, 3092–3104 RSC; (c) J. D. Rinehart and J. R. Long, Chem. Sci., 2011, 2, 2078–2085 RSC.
- (a) S. J. Butler and D. Parker, Chem. Soc. Rev., 2013, 42, 1652–1666 RSC; (b) C. P. Montgomery, B. S. Murray, E. J. New, R. Pal and D. Parker, Acc. Chem. Res., 2009, 42, 925–937 CrossRef CAS PubMed; (c) L. M. P. Lima and R. Tripier, Curr. Inorg. Chem., 2011, 1, 36–60 CrossRef CAS; (d) C. M. G. Dos Santos, A. J. Harte, S. J. Quinn and T. Gunnlaugsson, Coord. Chem. Rev., 2008, 252, 2512–2527 CrossRef CAS PubMed.
- (a) B. Bleaney, J. Magn. Reson., 1972, 8, 91–100 CAS; (b) B. Bleaney, C. M. Dobson, B. A. Levine, R. B. Martin, R. J. P. Williams and A. V. Xavier, J. Chem. Soc., Chem. Commun., 1972, 791b–7793 RSC.
- R. S. Dickins, D. Parker, J. I. Bruce and D. J. Tozer, Dalton Trans., 2003, 1264–1271 RSC.
- A. M. Funk, K.-L. N. A. Finney, P. Harvey, A. M. Kenwright, E. R. Neil, N. J. Rogers, P. Kanthi Senanayake and D. Parker, Chem. Sci., 2015, 6, 1655–1662 RSC.
- A. M. Funk, P. H. Fries, P. Harvey, A. M. Kenwright and D. Parker, J. Phys. Chem. A, 2013, 117, 905–917 CrossRef CAS PubMed.
- S. Aime, M. Botta, M. Fasano, M. P. M. Marques, C. F. Geraldes, D. Pubanz and A. E. Merbach, Inorg. Chem., 1997, 36, 2059–2068 CrossRef CAS PubMed.
- (a) T. Liu, A. Nonat, M. Beyler, M. Regueiro-Figueroa, K. Nchimi Nono, O. Jeannin, F. Camerel, F. Debaene, S. Cianférani-Sanglier, R. Tripier, C. Platas-Iglesias and L. J. Charbonnière, Angew. Chem., Int. Ed., 2014, 53, 7259–7263 CrossRef CAS PubMed; (b) L. M. P. Lima, A. Lecointre, J.-F. Morfin, A. de Blas, D. Visvikis, L. J. Charbonnière, C. Platas-Iglesias and R. Tripier, Inorg. Chem., 2011, 50, 12508–12521 CrossRef CAS PubMed; (c) R. Tripier, C. Platas-Iglesias, A. Boos, J.-F. Morfin and L. Charbonnière, Eur. J. Inorg. Chem., 2010, 2010, 2735–2745 CrossRef PubMed.
- O. A. Blackburn, N. F. Chilton, K. Keller, W. K. Myers, E. J. L. McInnes, A. M. Kenwright, P. D. Beer, C. R. Timmel and S. Faulkner, Angew. Chem., Int. Ed., 2015 DOI:10.1002/anie.201503421.
- S. Aime, A. Barge, J. I. Bruce, M. Botta, J. A. K. Howard, J. M. Moloney, D. Parker, A. S. de Sousa and M. Woods, J. Am. Chem. Soc., 1999, 121, 5762–5771 CrossRef CAS.
- (a) P. Hanninen and H. Härmä, Lanthanide Luminescence, Springer, Heidelberg, Springer Series on Fluorescence, 2011, vol. 7 Search PubMed; (b) C. Görller-Walrand and K. Binnemans, Rationalization of crystal field parametrization, in Handbook on the Physics and Chemistry of Rare Earths, ed. K. A. Gschneidner Jr. and L. Eyring, North-Holland Publishing, Amsterdam, 1996, ch. 155, vol. 23, p. 121 Search PubMed.
- A. Beeby, I. M. Clarkson, R. S. Dickins, S. Faulkner, D. Parker, L. Royle, A. S. de Sousa, J. A. G. Williams and M. Woods, J. Chem. Soc., Perkin Trans. 2, 1999, 493–504 RSC.
- F. B. Mallory, J. Am. Chem. Soc., 1973, 95, 7747–7752 CrossRef CAS.
- (a) R. S. Dickins, J. A. Howard, C. L. Maupin, J. M. Moloney, D. Parker, J. P. Riehl, G. Siligardi and J. A. G. Williams, Chemistry, 1999, 5, 1095–1105 CrossRef CAS; (b) J. H. Forsberg, R. M. Delaney, Q. Zhao, G. Harakas and R. Chandran, Inorg. Chem., 1995, 34, 3705–3715 CrossRef CAS.
- (a) C. N. Reilley, B. Good and J. Desreux, Anal. Chem., 1975, 47, 2110–2116 CrossRef CAS; (b) S. Rigault, C. Piguet and J.-C. G. Bünzli, J. Chem. Soc., Dalton Trans., 2000, 2045–2053 RSC; (c) S. Rigault, C. Piguet, G. Bernardinelli and G. Hopfgartner, J. Chem. Soc., Dalton Trans., 2000, 4587–4600 RSC.
- A. A. Pinkerton, M. Rossier and S. Spiliadis, J. Magn. Reson., 1985, 64, 420 CAS.
- R. Golding and P. Pyykkö, Mol. Phys., 1973, 26, 1389–1396 CrossRef CAS PubMed.
- J. Peters, J. Huskens and D. Raber, Prog. Nucl. Magn. Reson. Spectrosc., 1996, 28, 283–350 CrossRef CAS.
- L. Fusaro and M. Luhmer, Inorg. Chem., 2014, 53, 8717 CrossRef CAS PubMed.
- F. A. Dunand, S. Aime and A. E. Merbach, J. Am. Chem. Soc., 2000, 122, 1506–1512 CrossRef CAS.
- R. L. Jarek, R. J. Flesher and S. K. Shin, J. Chem. Educ., 1997, 74, 978–982 CrossRef CAS.
- P. Kuzmič, Anal. Biochem., 1996, 237, 260–273 CrossRef PubMed.
- R. D. Shannon, Acta Crystallogr., Sect. A: Cryst. Phys., Diffr., Theor. Gen. Cryst., 1976, 32, 751–767 CrossRef.
Footnote |
| † Electronic supplementary information (ESI) available: NMR experimental detail; titration procedures, isotherms and data fitting; luminescence spectra and decays; 1H and 19F NMR spectra; Bleaney and Reilley plots and corresponding data. See DOI: 10.1039/c5dt02398j |
| This journal is © The Royal Society of Chemistry 2015 |

