Heteroaggregation of bare silver nanoparticles with clay minerals†
Jibin
Liu
a,
Yu Sik
Hwang
b and
John J.
Lenhart
*a
aDepartment of Civil, Environmental and Geodetic Engineering, The Ohio State University, Columbus, OH 43210, USA. E-mail: lenhart.49@osu.edu; Fax: +1 614 292 3780; Tel: +1 614 688 8157
bFuture Environmental Research Center, Korea Institute of Toxicology, Jinju 660-844, Republic of Korea
First published on 25th August 2015
Abstract
In this study, we investigated the heteroaggregation of silver nanoparticles with clay minerals in neutral pH solutions as a function of electrolyte type and concentration. Bare nanoparticles with a nominal diameter of 60.9 ± 0.5 nm were synthesized and their aggregation behavior with illite (IMt-2) and montmorillonite (SWy-2), pretreated to obtain monocationic (Na-clay) and dicationic (Ca-clay) suspensions, was studied. Aggregation was monitored as a function of electrolyte concentration in both homo- and heteroaggregation scenarios by measuring the change in hydrodynamic diameter as a function of time using dynamic light scattering. Our results did not show significant differences in the stability of binary component systems of bare silver nanoparticle and clays at pH 7 when compared to the single particle systems of clay or silver at the same pH. In each case, high electrolyte concentrations were needed to overcome the energy barrier to form aggregates, which we attribute to weakly charged or negatively charged clay edges, negatively charged silver nanoparticles, as well as the permanently negatively charged basal plane surfaces of the clays at pH 7. The results suggest that a binary system of clay (either montmorillonite or illite) and bare silver nanoparticles can be treated as a single component system of the respective clay under the experimental conditions studied, and the fate of silver nanoparticles in aqueous system may be controlled by their heteroaggregation with native particles, such as clays.
Nano impactUnderstanding how nanoparticles interact with other particulate material in aqueous systems is essential to assess the fate of nanoparticles because these interactions directly or indirectly affect nanoparticle form, concentration, and aggregation. Clays are one of the dominant naturally occurring particle classes in aqueous system. Thus, in this study we investigated the heteroaggregation of silver nanoparticles with two clay minerals in neutral pH solutions. Our results suggest the binary clay-nanosilver systems behave nearly the same as the clay-only systems under the experimental conditions studied. Thus, to account for the influence of native particles, such as clays, on the fate of silver nanoparticles in aqueous system may simply require the understanding of the aggregation behavior of the clay minerals. |
Introduction
Engineered nanoparticles are intentionally produced particles with a size less than 100 nm. Owing to this small size, the particles' properties are drastically different from those for the bulk material of the same composition.1 As the application of nanotechnology has increased, many engineered nanoparticles have been introduced to products used in our daily lives. Due to this fact, questions arise about nanoparticle release to the environment during product use or disposal as well as the potential of these released particles to cause adverse effects to the environment and human health.1,2 Routes of entry to the environment may originate from point sources such as factories, or from non-point sources such as wet deposition, storm water runoff, and the degradation or disposal of discarded nanomaterial-containing products.3 In aqueous systems, the fate of engineered nanoparticles is controlled by physical transport (e.g., advection or sedimentation), chemical or biological transformation (e.g., oxidation–reduction or dissolution) and particle interaction (e.g., heteroaggregation) processes.4 These processes can act independently or mutually and their role in determining the fate of nanoparticles remains poorly understood.2,3 An accurate determination of fate is critical to determining the risk of nanoparticles to humans, organisms, and the environment.3Among metallic nanoparticles currently being produced and utilized, silver nanoparticles (AgNPs) are unique in their widespread and extensive use in commercial products.5 This reflects their utility as non-specific antibiotics and thus they are utilized in products (e.g., clothing, food containers, wound dressings, etc.) that exploit this effect for beneficial purposes.6 When used, however, these products release nanoparticles and these nanoparticles can be discharged into the environment.6 The properties that make AgNPs useful in commercial products could produce unforeseen adverse effects on aquatic biota and thus there is considerable interest in determining the mechanisms and processes responsible for dictating AgNP fate in different settings, such as aquatic environments.7 One of the dominant processes affecting the fate of AgNPs in aquatic systems is aggregation and recent research provides insight into the effects of electrolyte type, ionic strength, coating layer and organic matter on the aggregation of AgNPs.8–10 For example, NaCl, NaNO3, and CaCl2 produce “dissolution-accompanied” aggregation of silver nanoparticles, meaning the particles simultaneously aggregate and dissolve.10 More dissolution occurred in chloride-containing AgNPs suspensions and the aggregates formed had smooth continuous surfaces, while discrete aggregates were formed in nitrate-containing suspensions.10 Aggregation of AgNPs is a function of the capping layer, with AgNPs coated with large organic molecules such as the surfactant Tween resisting aggregation more than those coated with smaller organic molecules, such as citrate or sodium dodecyl sulfate.9
While these and similar studies provide insight into the environmental fate of AgNPs, they do so based on the analyses of model systems that do not necessarily correspond well with natural systems. For example, these studies do not account for interactions that may arise between silver nanoparticles introduced into a system and native particles that are already present in a system, a process termed heteroaggregation. Heteroaggregates form between two or more dissimilar particles and heteroaggregation is thus used to describe the stability of particle suspensions that contain more than one type of particle which may differ in size, shape, surface charge, etc.11 One of the more dominant native particle types in aquatic systems are clay minerals12 and thus an initial attempt to study the influence of heteroaggregation on AgNPs should naturally start by characterizing interactions between AgNPs and clay minerals.
Heteroaggregation has been researched for years and several studies have evaluated nanoparticles. Yates et al.,13 for example, determined that adding nano-sized silica particles (4.3–285 nm) to stable alumina dispersions produced large aggregates that readily settled out. Cerbelaud et al.14 also found heteroaggregates formed between submicrometer Al2O3 particles and SiO2 nanoparticles as silica nanoparticles depositing on the alumina particles produced attractive interactions between the now silica-coated alumina particles. Since the two particles were oppositely charged, the resulting process was conceptualized by the following two steps: 1) deposition of the silica nanoparticles on alumina particles and 2) aggregation of the silica-covered alumina particles.14 Comparable studies with AgNPs are limited and have only recently been studied. In studying interactions between AgNPs and hematite Huynh et al.15 observed rapid heteroaggregation that far exceeded that for the single-particle systems. This result was similar to that observed by Yates et al.13 and Cerbelaud et al.14 and is a reflection of the attractive electrostatic interactions between the two particles in these systems. Zhou et al.12 report similar results in their study of the heteroaggregation of AgNPs with montmorillonite at pH 4 where the edge sites of the clay carry a positive charge. However, at pH 8 they report that mixed montmorillonite-Ag system aggregation behavior was little changed compared to those for the single-particle systems. They attribute this observation to the repulsive electrostatics that exist between the AgNPs and the clay face and edge sites.
In this study, two common clay minerals, montmorillonite and illite, were chosen to evaluate their effects on the heteroaggregation of AgNPs. These minerals are both 2![[thin space (1/6-em)]](https://www.rsc.org/images/entities/char_2009.gif) :
:![[thin space (1/6-em)]](https://www.rsc.org/images/entities/char_2009.gif) 1 type clays, with one octahedral alumina sheet sharing oxygen atoms with two tetrahedral silica sheets.16–18 Montmorillonite is distinct from illite in its ability to expand when it contacts water due to it lacking strongly held potassium ions in the interlayer region and thus its ratio of edge to basal plane sites is greater than illite.14 The basal planes of clay lamella carry a permanent negative charge due to isomorphic substitution of Si- and Al-ions for ions of lower valence, while the charge of the lamella edge is pH-dependent because of pH-dependence in the exposed >Al–OH and >Si–OH surface groups.16 The edge is positively charged when the pH is below the point of zero charge (PZC) of the exposed functional groups and negatively charged when the pH is above the PZC.16,19–21 Extensive experimentation on the aggregation of clay minerals (see Table S1†) shows their behavior follows expected trends and depends upon pH, electrolyte solutions, ionic strength, and saturating cations.16,19–21 In the case of montmorillonite and illite, the greater proportion of illite edge sites to basal plane sites results in it exhibiting aggregation tendencies that vary with the nature of the saturating cation.14 Although the heteroaggregation of clay particles with other nanoparticles has been studied,22,23 except for the study of Zhou et al.12 the aggregation of clay minerals with AgNPs remains little understood.
1 type clays, with one octahedral alumina sheet sharing oxygen atoms with two tetrahedral silica sheets.16–18 Montmorillonite is distinct from illite in its ability to expand when it contacts water due to it lacking strongly held potassium ions in the interlayer region and thus its ratio of edge to basal plane sites is greater than illite.14 The basal planes of clay lamella carry a permanent negative charge due to isomorphic substitution of Si- and Al-ions for ions of lower valence, while the charge of the lamella edge is pH-dependent because of pH-dependence in the exposed >Al–OH and >Si–OH surface groups.16 The edge is positively charged when the pH is below the point of zero charge (PZC) of the exposed functional groups and negatively charged when the pH is above the PZC.16,19–21 Extensive experimentation on the aggregation of clay minerals (see Table S1†) shows their behavior follows expected trends and depends upon pH, electrolyte solutions, ionic strength, and saturating cations.16,19–21 In the case of montmorillonite and illite, the greater proportion of illite edge sites to basal plane sites results in it exhibiting aggregation tendencies that vary with the nature of the saturating cation.14 Although the heteroaggregation of clay particles with other nanoparticles has been studied,22,23 except for the study of Zhou et al.12 the aggregation of clay minerals with AgNPs remains little understood.
The overall goal of our research is to elucidate the fundamental processes that control the fate of silver nanoparticles in natural aquatic environments, with the specific objective of this study being to evaluate the influence of heteroaggregation. We focus our attention in this paper on expanding progress made toward understanding the heteroaggregation of silver nanoparticles with clay minerals presented by Zhou et al.,12 by comparing results with two clay minerals (montmorillonite and illite) as a function of saturating cation (Na+ and Ca2+) and electrolyte (NaCl, NaNO3 or CaCl2). Although montmorillonite and illite are structurally similar, the non-expanding nature of illite produces aggregation behavior with greater dependence on solution composition than that for montmorillonite (see Table S1†). Thus, we hypothesize that illite interactions with AgNPs will exhibit a greater dependence on solution composition (e.g., saturating cation) than will montmorillonite. To facilitate comparisons, the conditions in this study were the same as those previously used to evaluate the homoaggregation of silver nanoparticles.10 Our results did not show significant differences in the stability, as defined by the critical coagulation concentration (CCC), of binary systems of silver nanoparticle and clays when compared to the single component systems under the same conditions. They also did not exhibit much dependence on the clay mineral or saturating cation, which was counter to our original hypothesis. Instead, the broader aggregation behavior of the binary systems closely mimicked that for the clay minerals and thus we propose under conditions present in natural systems (e.g., circumneutral pH and excess concentration of natural particles) that the aggregation kinetics of binary systems with AgNPs and natural particles, such as clays, can be approximated based upon knowledge of just the single component clay systems.
Experimental details
Materials
AgNO3 (≥99.8%) and D-maltose monohydrate (99%) were purchased from Sigma-Aldrich and used as received. Ammonium hydroxide (20–22% as NH3, trace metal grade) was bought from Fisher Scientific. All other reagents were analytical grade or higher. All experiments used deionized water (Millipore Milli-Q) with a resistivity of 18.2 MΩ cm. The electrolyte solutions (NaCl, NaNO3, and CaCl2), buffer solution (NaHCO3), and solutions employed in silver nanoparticle synthesis were filtered through 0.1 μm cellulose ester membranes (Millipore) before use. All labware and glassware were thoroughly cleaned and soaked in 5% nitric acid for at least one day before use, followed by a thorough rinse with deionized water and oven-drying. The labware was immediately used or stored in a dust-free environment prior to use.Clay preparation
Montmorillonite (SWy-2) and illite (IMt-2) were obtained from the Clay Minerals Society and prepared as monocationic suspensions following established protocols.24,25 To begin, 5 g of each clay in 250 mL deionized water was rapidly mixed for 45 min. The less than 2 μm size fraction was isolated into the supernatant by overnight gravity sedimentation. The supernatant was decanted and the electrolyte concentration was adjusted to be 1 M NaCl. For montmorillonite, this step was followed by a rapid 15 minute mix, whereas for illite the suspension was adjusted to pH 3 with 10% HCl and stirred for two hours. The clays were separated from their respective suspensions through centrifugation at 3600 rpm for 30 min. The supernatant was decanted and fresh 0.01 M NaCl was added. The clay suspensions were vigorously shaken to re-suspend the clay particles and subsequently centrifuged once again at 3600 rpm for 30 min. This washing procedure was repeated 5 times. The suspensions were dialyzed against 0.01 M NaCl. The solution was changed daily until the conductivity of the clay suspension was the same as the 0.01 M NaCl.Calcium-saturated clay samples were prepared following the methods previously described with the exception that NaCl was replaced with CaCl2. All of the clays were stored as concentrated suspensions in the dark at 4 °C.
Silver nanoparticle synthesis
Monodisperse suspensions of silver nanoparticles were synthesized following Li et al.10 In short, 2 mL of 0.01 M AgNO3 was pipetted into a 50 mL glass beaker followed by 10 mL of 0.02 M ammonium hydroxide. The solution was stirred using a small Teflon-coated magnetic stir bar. The solution pH was adjusted to ca. 11.5 through the addition of 250 μL of 0.1 M NaOH, after which 8 mL of 0.025 M D-maltose was introduced to reduce the Ag[(NH3)2]+ complex to form metallic silver nanoparticles. After the addition of all reagents, the suspension was equilibrated for 30 min in the dark at room temperature (20 ± 1 °C).The freshly synthesized silver nanoparticles were dialyzed against deionized water using a cellulose ester membrane (Spectra/Por, 8-10k MWCO) over a period of 24 hours. The deionized water was changed a minimum of 4 times, which Li et al.10 report is sufficient time to remove residual ions. Six such batches of silver nanoparticles were synthesized and combined to form the stock suspension which was stored in a polypropylene bottle in the dark at 4 °C. The concentration of the stock suspension, determined using an inductively coupled plasma optical emission spectrometer (Varian Vista AX), was 60 mg Ag L−1 which corresponds to an approximate yield of 55% of the initial Ag.
Particle characterization
The hydrodynamic diameter and UV-vis spectrum of the silver nanoparticles was determined on a sample that was diluted by 25 times in a sodium bicarbonate – sodium chloride buffer solution that maintained the pH at 7.0 ± 0.3 and ionic strength at 1 mM. The hydrodynamic diameter was measured by dynamic light scattering (DLS) (90Plus, Brookhaven Instruments Corp., Holtsville, NY). The UV-vis spectrum was collected over the wavelength range of 200–700 nm using a Shimadzu UV-4201PC UV-vis spectrophotometer.The morphology and size of the dispersed silver nanoparticles and clays were imaged using a Technai G2 Spirit Transmission Electron Microscope (TEM) with a 120 kV electron beam. Samples were prepared by placing one drop of the working suspension on a 100 mesh copper grid that was dried under nitrogen. Samples of dispersed silver nanoparticles and clays were prepared using concentrated stock suspensions which were sonicated before use. The morphology of the heteroaggregates was also evaluated using the TEM, where one drop of the suspension generated from the heteroaggregation experiments was used instead.
The electrophoretic mobility of Na-/Ca-montmorillonite and illite was measured by a Brookhaven Instrument Corp. ZetaPALS instrument. The Smoluchowski equation was used to calculate the zeta potential from the corresponding mobility values for a particle of arbitrary shape with a nominal diameter that is much larger than the thickness of the electrical double-layer.26 The measurements were conducted at a temperature of 22 ± 0.5 °C across the pH range of 4.0–10.0 in 1 mM NaCl solutions. The samples were equilibrated for 5 min and for each pH value the data comprised ten individual measurements collected and averaged for three separate samples. The effects of NaCl (0.1–10 mM) and CaCl2 (1–500 mM) on the electrophoretic mobility of the clay minerals were evaluated as well at pH 7.
Aggregation kinetics
Aggregation kinetics for both the homoaggregate and heteroaggregate systems was determined by measuring the initial time rate of change in the average hydrodynamic radius of the particle suspensions using DLS. The instrument was equipped with a 678 nm laser with a detection angle of 90 degrees and the experiments were conducted at a temperature of 22 ± 0.5 °C.All working suspensions were prepared by diluting stock suspensions in a 0.05 mM sodium bicarbonate buffer at pH 7.0 ± 0.3. Individual particle concentrations were kept the same for both the homoaggregation and heteroaggregation experiments. This entailed diluting the stock particle suspensions when preparing the working suspensions for the heteroaggregation experiments with a particle concentration twice that for the homoaggregation experiments (see Table S2†). All working suspensions were briefly sonicated in an ultrasonic water bath before each experiment.
For the homoaggregation experiments, 3 mL of the particle suspension of interest was pipetted into a disposable acrylic cuvette. The cuvette was prepared before use by washing using 5% HNO3 followed by a thorough rinse with deionized water. Predetermined amounts of electrolyte and buffer solutions were added to the cuvette to obtain the desired ionic strength, while maintaining the total volume at 4 mL. The cuvette was covered with a plastic lid, quickly hand-shaken and inserted into the DLS sample holder. The heteroaggregation experiments were the same except that 1.5 mL of silver nanoparticles and 1.5 mL of the clay suspensions of interest were used. In either case, measurements begun immediately upon inserting the cuvette into the DLS. For silver nanoparticle systems, measurements were collected over a period of 15 min with 90 s intervals between measurements, while single clay and binary component systems were measured over a period of 5 min with 30 s intervals between measurements.
The stability of the suspensions was analyzed by comparing variations in the inverse stability ratio (1/W) with ionic strength where 1/W is defined as the ratio of the experimental aggregation rate constant (kexp) to that determined for rapid aggregation (krapid), or diffusion-limited aggregation, as shown in the following expressions:27
 | (1) |
 | (2) |
Results and discussions
Silver nanoparticle characterization
The hydrodynamic diameter of the silver nanoparticles determined by DLS was 60.9 ± 0.5 nm. TEM images show the silver nanoparticles' morphology as smooth and roughly spherical with a diameter similar to that measured by DLS (Fig. S1a†). Based on this size, the concentration of the stock suspension (60 mg Ag L−1), and the density of metallic silver (10.5 g cm−3), we calculated a particle concentration for the stock suspension of 5 × 10¹⁰ particles mL−1. Based on the dilutions used to prepare working solutions (see Table S2†), the silver nanoparticle concentration used in aggregation experiments was 1.5 × 10⁹ particles mL−1.The UV-vis spectrum (Fig. S1b†) of freshly synthesized silver nanoparticles showed a maximum absorption peak at a wavelength of 433 nm, which was consistent with the reported location of the surface plasmon absorption band of silver nanoparticles synthesized using this method.28 The observed red-shift in the position of the absorption peak compared to that for monodispersed silver nanoparticles with a diameter below 100 nm with no adsorbed or oxidized layer, as well as the broadening of the absorption band provide evidence for the existence of an oxidized layer on the particle surface.10
According to Li. et al.,10 the silver nanoparticles synthesized with this method have a negative zeta potential across the pH range of 4.0 to 10.0 that remains relatively unchanged at −45.8 ± 0.9 mV in 1 mM NaCl. Li et al.10 rationalize the measured negatively charged surfaces may reflect the existence of an oxide surface layer and the adsorption of anions during synthesis. Increasing the electrolyte concentration or valence of the electrolyte cation decreased the magnitude of the zeta potential,10 reflecting the increase in charge screening under these conditions.
Clay mineral characterization
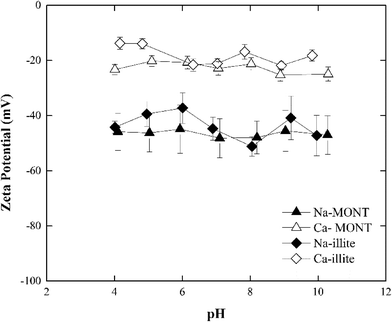
The zeta potential of the sodium- and calcium-forms of the montmorillonite in 1 mM NaCl remained unchanged at −46.5 ± 7.14 mV and −22.6 ± 2.88 mV, respectively, across the pH range 4.0 to 10.0 (Fig. 1). These results were consistent with those published for this montmorillonite suspended in NaCl.12,30 Under the experimental conditions studied, the zeta potential of Ca-montmorillonite was less negative than that for Na-montmorillonite. Montmorillonite has a higher affinity for Ca2+ than Na+ and the bound Ca2+ can suppress the negative charge of the basal planes30,31 Given time, the bound Ca2+ could be displaced when Ca-montmorillonite was dispersed in NaCl, but since the electrolyte concentration (1 mM) was too low and the time during sample preparation (less than 30 min) was too short such ion exchange was not fully completed.30
The zeta potential of both forms of montmorillonite were measured across the NaCl and CaCl2 concentrations corresponding to those studied in the aggregation experiments (Fig. 2a). At low electrolyte concentration, the zeta potential for Ca-montmorillonite was less negative than that for Na-montmorillonite. As the electrolyte concentration increased, however, the zeta potential for both forms of the clay converged to similar values. The same trend existed for both CaCl2 and NaCl. It was more pronounced for NaCl, however, as the zeta potential of Na-montmorillonite became less negative as NaCl increased from 30 mM to 500 mM. Likely, this just reflects compression of the electrical double layer at elevated electrolyte concentration.26 Below 30 mM NaCl, the absolute value of the zeta potential of Na-montmorillonite increased from ca. 40 mV to ca. 65 mV. According to Delgado et al.32 this reflects montmorillonite can undergo rapid hydrolysis at circumneutral pH, whereby H+, exchanged for bound Na+, induces the release of Al3+ and Mg2+ from montmorillonite which could produce the observed increase in the magnitude of the zeta potential. Hydrolysis is distinct from mineral dissolution, which occurs slowly (e.g., Metz et al.33), and is partially driven by the accumulation of H+ at the clay interface needed to satisfy electroneutrality in the system.23,24 Delgado et al.32 described this hydrolysis as two steps: (1) a rapid exchange of hydrogen ions in the solution with Na+ originally attached to the montmorillonite and (2) a slow penetration of the exchanged H+ into the sheets of montmorillonite. The penetrating hydrogen ions induce the release of Al3+ and Mg2+ from montmorillonite into the solution. The released multivalent cations could also compress the electrical double layer which would reduce the magnitude of zeta potential. At the same time, however, the loss of these cations would decrease the zeta potential of montmorillonite. The determination of the electrophoretic mobility, hence zeta potential, is also influenced by the high surface conductivity of montmorillonite which is reported to also produce low absolute values under dilute electrolyte conditions.34 Thus, the observed decrease of zeta potential of clay was likely the net result of these combined actions. The hydrolysis process is kinetically hindered at elevated electrolyte concentrations and thus it tends to be observed at electrolyte concentrations less than 10−3 M.32,35,36 Callaghan and Ottewill37 and Rossi et al.38 observed different trends in the zeta potential that entailed a decrease (increase in the magnitude) at NaCl concentrations above 10−2 M. Rossi et al.38 attribute this to particle dissolution and ion release. Finally, aggregation of the montmorillonite during the five minute equilibration time prior to the zeta potential determinations was possible, particularly at electrolytes equal to or greater than 30 mM, and it could also have influenced these measurements. Considering the obvious sensitivity of clay surfaces to methods of preparation and storage,36 our results were similar in magnitude to those previously reported.
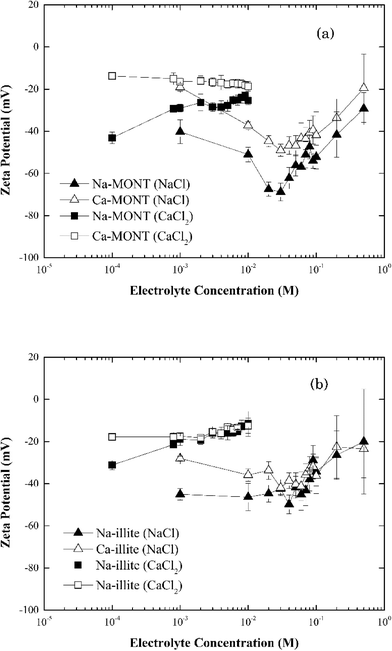 | ||
| Fig. 2 Zeta potential of (a) montmorillonite and (b) illite in the systems with 1–500 mM NaCl or 0.1–10 mM CaCl2. | ||
When Ca-montmorillonite was suspended in 1 to 30 mM NaCl, a similar trend of decreasing zeta potential with increasing NaCl concentration resulted. However, in this case the origin of the trend not only reflects hydrolysis and surface conductance, but also the exchange of Ca2+ bound to the clay with Na+ ions in the solution. This net loss of bound cation charge could produce a lower zeta potential. The time needed for complete replacement of Ca2+ by Na+ is reported to be around 24 h (ref. 36) and presumably given sufficient time the two data sets would converge. Since the equilibration time was much less than 24 hours, Ca-montmorillonite had a consistently higher (less negative) zeta potential than did Na-montmorillonite.
In systems with CaCl2, the zeta potential for Na-montmorillonite increased as the electrolyte concentration increased (Fig. 2a). This reflects both the exchange of bound Na+ with solution phase Ca2+ and the enhanced compression of the electrical double layer induced by the divalent calcium cations. However, except for an increase in the standard error of the zeta potential with increasing electrolyte, no significant change in the zeta potential of Ca-montmorillonite was observed in the range of 10−4 to 10−2 M CaCl2 (Fig. 2a). While the reason for this result was not known with certainty, it was similar to results presented in the literature39 and may reflect the influence of particle aggregation during the preparation of the samples prior to these measurements.
At pH 7, the zeta-potential of Na-illite was −44 ± 4 mV while for Ca-illite it was −21 ± 2 mV (Fig. 1). Similar trends were found for the zeta-potential of illite in the pH range 4 to 10 as was measured for montmorillonite. This was expected considering both clay minerals had the same basic structure. As was observed for montmorillonite, the calcium-form of illite had a less negative zeta potential than did the Na form, reflecting the presence of the bound divalent cations.
The zeta potential for both Na- and Ca-illite generally increased (trend to a less negative value) as the NaCl concentration increased from 1 mM to 500 mM (Fig. 2b). Unlike what was observed for Na-montmorillonite, however, no significant decrease in the zeta potential occurred for Na-illite below 30 mM NaCl. Illite is a nonexpanding clay41 and although the 2![[thin space (1/6-em)]](https://www.rsc.org/images/entities/char_2009.gif) :
:![[thin space (1/6-em)]](https://www.rsc.org/images/entities/char_2009.gif) 1 layer structure is similar to that for montmorillonite, the cation exchange capacity (CEC) of illite is lower than that of montmorillonite.39 The CEC of the montmorillonite in this study is 1040 mmol kg−1,24 while that for illite is 231 mmol kg−1,25 reflecting the smaller amount of internal cations (i.e., potassium ions) available for release from illite than montmorillonite.42 Thus, the decrease in the magnitude of the negative zeta potential as NaCl was increased from 1 mM to 500 mM likely reflects compression of the electrical double layer induced by the increasing electrolyte. Similar to Ca-montmorillonite, the exchange of clay-bound Ca2+ associated with Ca-illite with solution-phase Na+ remains possible and if it occurred it could have produced the reduction in the magnitude of the zeta potential at NaCl below 30 mM.
1 layer structure is similar to that for montmorillonite, the cation exchange capacity (CEC) of illite is lower than that of montmorillonite.39 The CEC of the montmorillonite in this study is 1040 mmol kg−1,24 while that for illite is 231 mmol kg−1,25 reflecting the smaller amount of internal cations (i.e., potassium ions) available for release from illite than montmorillonite.42 Thus, the decrease in the magnitude of the negative zeta potential as NaCl was increased from 1 mM to 500 mM likely reflects compression of the electrical double layer induced by the increasing electrolyte. Similar to Ca-montmorillonite, the exchange of clay-bound Ca2+ associated with Ca-illite with solution-phase Na+ remains possible and if it occurred it could have produced the reduction in the magnitude of the zeta potential at NaCl below 30 mM.
The effect of CaCl2 on the zeta potentials of both Na- and Ca-illite (Fig. 2b) reveals illite has a higher affinity for Ca2+ than Na+. Since illite is a nonexpanding clay, suspending Na-illite in CaCl2 was assumed to lead to more rapid and complete exchange of Na+ with Ca2+ than that for Na-montmorillonite. As a result, the zeta potential of Na-illite was very close to that for Ca-illite from 1 mM to 10 mM CaCl2.
Homoaggregation of single component systems
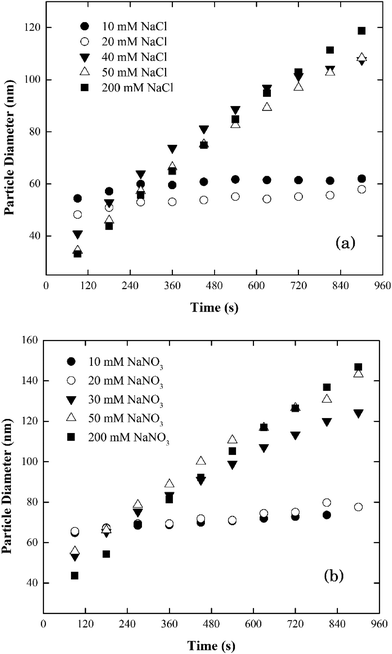 | ||
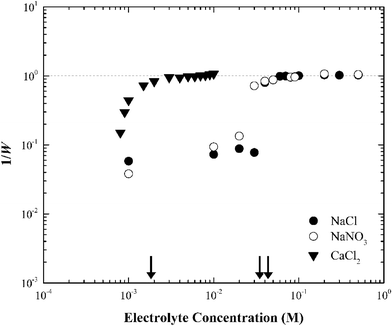
| Fig. 3 Aggregation profiles of silver nanoparticles at pH 7.0 as a function of electrolyte concentrations in (a) NaCl and (b) NaNO3. | ||
When the electrolyte was CaCl2 the CCC of silver nanoparticles was much lower (ca. 2 mM) than that in NaCl/NaNO3 (Fig. 4). According to the Schulze–Hardy rule,26 CCC[Na]/CCC[Ca] equals z6 for particles with a large zeta potential (|ξ| > 50 mV), and z2 for those with a low zeta potential (|ξ| < 50 mV), where z is the counterion charge (i.e., z = 2 in the case of Ca2+). In our experiments, the ratio of CCC[Na] and CCC[Ca] was approximately proportional to z4. This intermediate value between the two predicted by the Schulze–Hardy rule (i.e., z6) is consistent with previous measurements, and according to Li et al.9,10 indicates the modification of surface charge due to the adsorption of cations on the surface of the silver nanoparticles.
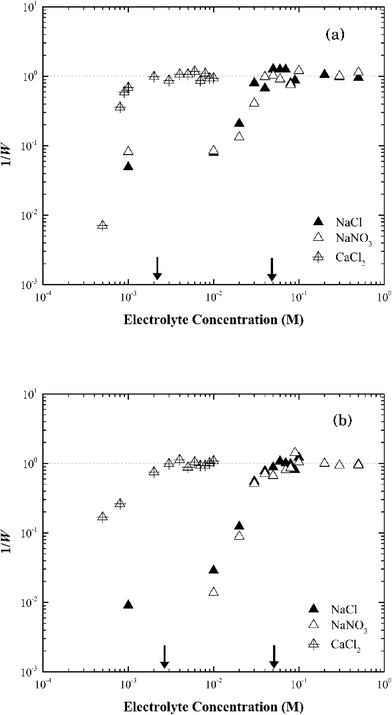
In CaCl2, the CCC value of Na-montmorillonite was estimated at 1.5 mM (Fig. 5a). The ratio of the CCC[Na]/CCC[Ca] was 33![[thin space (1/6-em)]](https://www.rsc.org/images/entities/char_2009.gif) :
:![[thin space (1/6-em)]](https://www.rsc.org/images/entities/char_2009.gif) 1, proportional to z5, which was similar with that predicted by the Schulze–Hardy rule of z6.47 The difference could reflect the difficulty in preparing a pure monocationic montmorillonite due to the potential release of multivalent cations (Mg2+, Al3+) from the clay minerals.47 It could also reflect exchange of surface cations with the added electrolyte cation during aggregation.31,48
1, proportional to z5, which was similar with that predicted by the Schulze–Hardy rule of z6.47 The difference could reflect the difficulty in preparing a pure monocationic montmorillonite due to the potential release of multivalent cations (Mg2+, Al3+) from the clay minerals.47 It could also reflect exchange of surface cations with the added electrolyte cation during aggregation.31,48
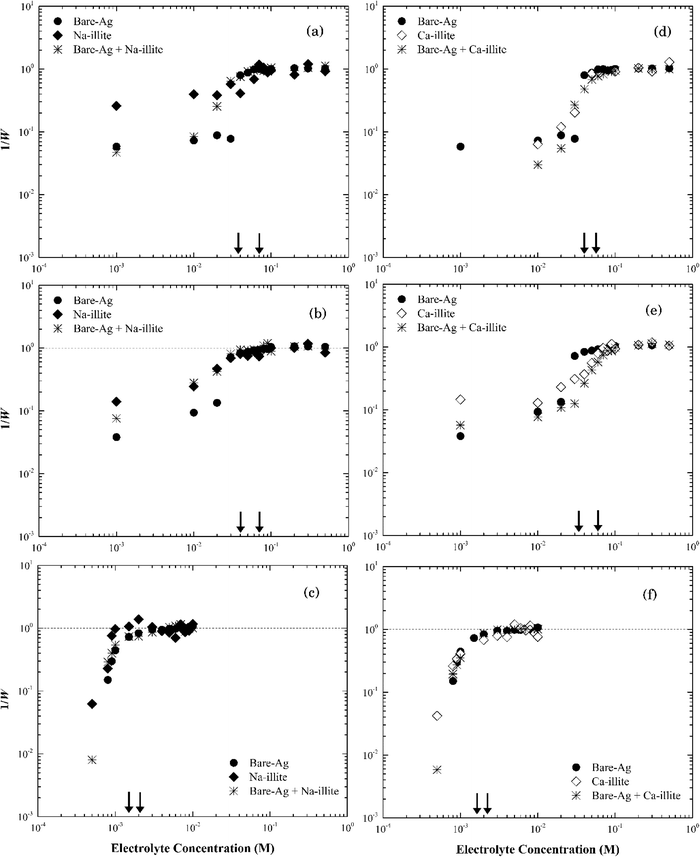
The same CCC of ca. 50 mM NaCl or NaNO3 and ca. 2 mM CaCl2 were observed for both Na-montmorillonite and Ca-montmorillonite at pH ~7 (Fig. 5b). The cation used to saturate the basal surface planes of montmorillonite had little to no impact on the suspension stability (Fig. S3†), which was consistent with the similar values of zeta potentials for Na- and Ca-montmorillonite (Fig. 2a). The ratio of CCC[Na]/CCC[Ca] for Ca-montmorillonite was 25![[thin space (1/6-em)]](https://www.rsc.org/images/entities/char_2009.gif) :
:![[thin space (1/6-em)]](https://www.rsc.org/images/entities/char_2009.gif) 1, or approximately z4.6, which was close to that of Na-montmorillonite. A similar result was obtained by Tombácz et al.31 and as a result they hypothesized that montmorillonite aggregation depends only on the electrolyte, not the original cations present in the montmorillonite. This was also consistent with the reported CCC of 70 mM for Mg-montmorillonite at pH 7 in KCl.49
1, or approximately z4.6, which was close to that of Na-montmorillonite. A similar result was obtained by Tombácz et al.31 and as a result they hypothesized that montmorillonite aggregation depends only on the electrolyte, not the original cations present in the montmorillonite. This was also consistent with the reported CCC of 70 mM for Mg-montmorillonite at pH 7 in KCl.49
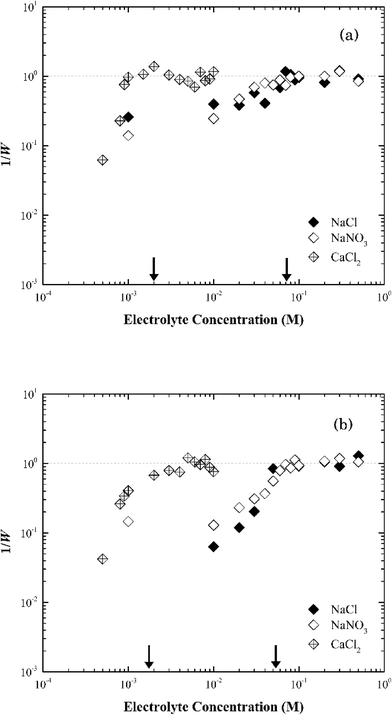 | ||
| Fig. 6 Inverse stability ratio (1/W) of (a) Na-illite and (b) Ca-illite as a function of NaCl, NaNO3 and CaCl2 concentrations. The arrows indicate the CCCs for different systems. | ||
Similar to montmorillonite, the bound cation had little effect on the stability of illite (Fig. S4†). The CCCs of Ca-illite and Ca-montmorillonite were similar, but the CCCs of Na-illite were slightly higher than those for Na-montmorillonite (Table 1). Oster et al.47 similarly observed the CCC of Na-illite was higher than the CCC for Na-montmorillonite, while the CCCs of the two calcium forms of the clays were similar. They concluded the irregular surfaces and terraced planar orientation (i.e., wheel-like orientation in the TEM image of Na-illite in Fig. S2b†) of Na-illite lead to smaller edge-to-face attraction forces, and eventually a higher CCC for Na-illite than for Na-montmorillonite. At the same time, the PZC of illite ranges from 3.5 to 4.5 (ref. 53–55) and thus considering its structure is similar to montmorillonite a higher CCC value of illite than that of montmorillonite seems reasonable.
| Particle type | CCC (mM) | ||
|---|---|---|---|
| NaCl | NaNO3 | CaCl2 | |
| Bare silver nanoparticles | 40 | 35 | 2 |
| Na-MONT | 50 | 50 | 1.5 |
| Ca-MONT | 50 | 50 | 2 |
| Na-illite | 70 | 70 | 2 |
| Ca-illite | 50 | 50 | 1 |
Heteroaggregation of binary component systems
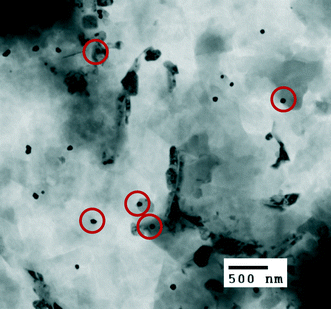 | ||
| Fig. 8 TEM image of heteroaggregated silver nanoparticles with Na-montmorillonite at 100 mM NaCl. Red circles highlight the interactions between AgNPs and basal planes of Na-montmorillonite. | ||
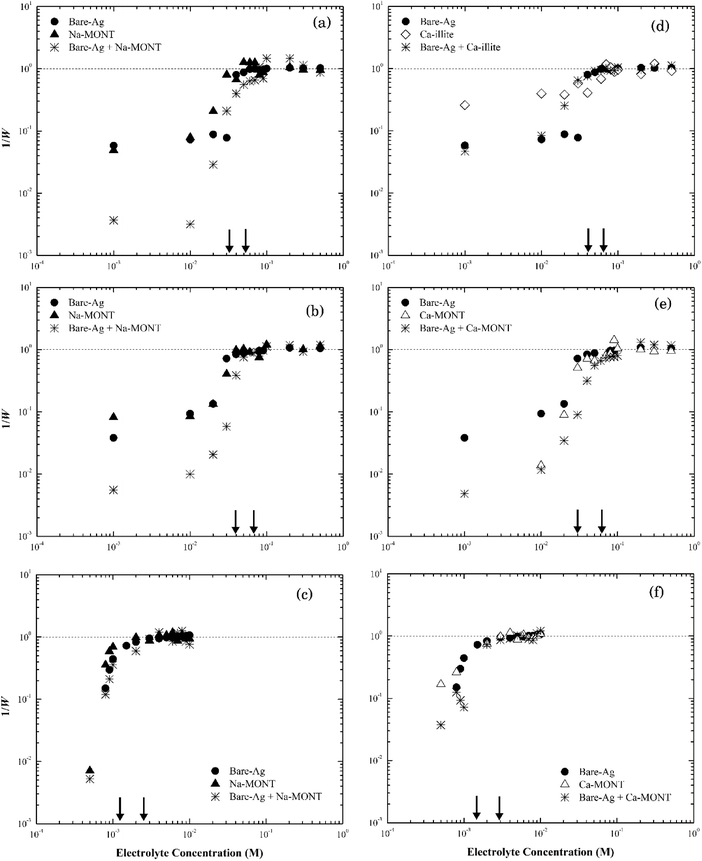
The rates of particle heteroaggregation at high electrolyte concentrations appeared to be dominated by montmorillonite as the values for krapid for the binary-particle systems were similar to those for the respective clay system as opposed to that for the silver nanoparticle system (see Tables S3 and S4†). At low electrolyte concentrations, however, the aggregation rates were intermediate between the two single particle systems resulting in values for 1/W in the binary system being lower than those for either of the single particle systems (e.g., see Fig. 7a). These trends could reflect that the montmorillonite flakes were roughly five times larger than the silver nanoparticles (Fig. S1a and S2a†) and the particle number of montmorillonite was greater than that of the silver nanoparticles. It could also reflect non-DLVO depletion force interactions that can form in binary systems that have a large ratio in particle sizes12 when the large particles are suspended in a dilute solution of the smaller ones.57 It occurs when the distance between two large particles is less than the diameter of the smaller particles resulting in the small particles being pushed out to leave a “free volume” between the large particles. This “free volume” will then lead to an imbalance of pressure around the large particles, which in turn may form either attractive or repulsive forces between these same particles.58 The attractive form of the depletion force can lead to the flocculation of particles.57 The limited change in the stability of the mixture compared to the clay-only system suggests any such depletion force was negligible, if present at all, in this binary system.
Thus, we propose that as electrolyte concentrations approach the CCC for the respective binary system that the heteroaggregation of silver nanoparticles and montmorillonite was comprised of two simultaneous processes. The first entailed the deposition of the silver nanoparticles onto the montmorillonite flakes, likely during the initial stage of the experiment.59 In essence, montmorillonite acts as a mobile collector in a manner that is analogous to the deposition of silver nanoparticles onto the surface of sand60 or silica61 where silver nanoparticle deposition occurs at ionic strength values as low as 5 mM.42,43 Since both the basal planes and the edges of montmorillonite were negatively charged at pH 7 as were sand42 and silica43 their interactions with the silver nanoparticles should be similar. Based on the size of nanoparticles (~60 nm) and clay particles (200–400 nm), however, it seems more likely that the basal planes of the clay particles provide sites for nanoparticle deposition. The second process involved the aggregation of the combined NP-clay particles, which aggregate more or less at the same rate as that for the clay-only systems. Because of the larger particle number concentration of montmorillonite, the deposition of bare silver nanoparticles appears to have little effect on its stability as the CCC of the heteroaggregate system was similar to that for the clay-only system.
Conclusions
Our results did not show significant differences in the stability of binary component systems of silver nanoparticle and clays at pH 7 when compared to the single particle systems at the same pH. We attribute this to weakly charged or negatively charged clay edges, as well as permanently negatively charged basal plane surfaces of the clays at pH 7, thus all six combinations between silver nanoparticles and the clays in binary systems (i.e., face-to-face, face-to-edge, edge-to-edge, nanoparticle-to-nanoparticle, face-to-nanoparticle, edge-to-nanoparticle) are barrier-controlled (i.e., high electrolyte concentration is needed to overcome the energy barrier to form aggregates). Our expectation for greater dependence in illite aggregation on solution chemistry was also not evident in our experiments. While we cannot completely neglect possible non-DLVO forces that arise from size asymmetry, such as depletion forces, the lack of differences observed in the single- and binary-particle systems suggests their influence under the conditions studied was negligible. Our results suggest under neutral pH and moderate to elevated electrolyte concentrations approaching the measured CCC values that binary systems of montmorillonite/illite and silver nanoparticles can be treated as single component clay systems. Further research specifically highlighting conditions where the silver nanoparticles interact with clay phases and the role of additional complexities such as natural organic matter are needed in order to better extend our observations to predict the fate of silver nanoparticles in natural systems.Acknowledgements
This study was supported under the research project Environmental Risk Assessment of Manufactured Nanomaterials (KK-1403-02) funded by the Korea Institute of Toxicology (KIT) and done in collaboration with the Department of Civil, Environmental and Geodetic Engineering (CEGE) at The Ohio State University, Columbus, Ohio. The authors gratefully acknowledge the assistance of Ms. Elsa Burrow, Ms. Yen-Ling Liu and Mr. Matthew Noerpel (all CEGE) for their assistance in this research. We also acknowledge Dr. Xuan Li, US EPA, Cincinnati, OH, for his assistance and guidance in the preparation and characterization of the silver nanoparticles. The images presented were generated using instruments and services at The Ohio State University Campus Microscopy and Imaging Facility. Electrophoretic mobility measurements were conducted at the Nanotech West Laboratory at The Ohio State University.References
- M. Auffan, J. Rose, J. Y. Bottero, G. V. Lowry, J. P. Jolivet and M. R. Wiesner, Nat. Nanotechnol., 2009, 4, 634–641 CrossRef CAS PubMed.
- V. L. Colvin, Nat. Biotechnol., 2003, 21, 1166–1170 CrossRef CAS PubMed.
- M. R. Wiesner, G. V. Lowry, P. Alvarez, D. Dionysiou and P. Biswas, Environ. Sci. Technol., 2006, 40, 4336–4345 CrossRef CAS.
- A. Praetorius, M. Scheringer and K. Hungerbuhler, Environ. Sci. Technol., 2012, 46, 6705–6713 CrossRef CAS PubMed.
- D. Rejeski, Nanotechnology and consumer products, http://www.nanotechproject.org/publications/archive/nanotechnology_consumer_products/, (accessed June, 2014).
- T. M. Benn and P. Westerhoff, Environ. Sci. Technol., 2008, 42, 4133–4139 CrossRef CAS.
- B. Nowack and T. D. Bucheli, Environ. Pollut., 2007, 150, 5–22 CrossRef CAS PubMed.
- X. Li and J. J. Lenhart, Environ. Sci. Technol., 2012, 46, 5378–5386 CrossRef CAS PubMed.
- X. Li, J. J. Lenhart and H. W. Walker, Langmuir, 2012, 28, 1095–1104 CrossRef CAS PubMed.
- X. Li, J. J. Lenhart and H. W. Walker, Langmuir, 2010, 26, 16690–16698 CrossRef CAS PubMed.
- A. Islam, B. Chowdhry and M. Snowden, Adv. Colloid Interface Sci., 1995, 62, 109–136 CrossRef CAS.
- D. Zhou, A. I. Abdel-Fattah and A. A. Keller, Environ. Sci. Technol., 2012, 46, 7520–7526 CrossRef CAS PubMed.
- P. D. Yates, G. V. Franks, S. Biggs and G. J. Jameson, Colloids Surf., A, 2005, 255, 85–90 CrossRef CAS PubMed.
- M. Cerbelaud, A. Videcoq, P. Abélard, C. Pagnoux, F. Rossignol and R. Ferrando, Langmuir, 2008, 24, 3001–3008 CrossRef CAS PubMed.
- K. A. Huynh, J. M. McCaffery and K. L. Chen, Environ. Sci. Technol. Lett., 2014, 1, 361–366 CrossRef CAS.
- E. Tombácz and M. Szekeres, Appl. Clay Sci., 2006, 34, 105–124 CrossRef PubMed.
- M. Bentabol, M. D. Ruiz Cruz, F. J. Huertas and J. Linares, Clay Miner., 2003, 38, 161–172 CrossRef CAS PubMed.
- S. Laribi, B. Jouffrey and J.-M. Fleureau, Eur. Phys. J.: Appl. Phys., 2007, 39, 257–265 CrossRef CAS.
- E. Tombácz and M. Szekeres, Appl. Clay Sci., 2004, 27, 75–94 CrossRef PubMed.
- S. Goldberg and R. A. Glaubig, Clays Clay Miner., 1987, 35, 220–227 CAS.
- D. Hesterberg and A. Page, Soil Sci. Soc. Am. J., 1990, 54, 735–739 CrossRef.
- L. Cai, M. Tong, X. Wang and H. Kim, Environ. Sci. Technol., 2014, 48, 7323–7332 CrossRef CAS PubMed.
- H. J. Kim, T. Phenrat, R. D. Tilton and G. V. Lowry, J. Colloid Interface Sci., 2012, 370, 1–10 CrossRef CAS PubMed.
- M. E. Essington, J. Lee and Y. Seo, Soil Sci. Soc. Am. J., 2010, 74, 1577 CrossRef CAS.
- X. Gu and L. J. Evans, J. Colloid Interface Sci., 2007, 307, 317–325 CrossRef CAS PubMed.
- R. Hunter, Foundations of colloid science, Oxford University Press, Oxford, 2001 Search PubMed.
- J. W. Virden and J. C. Berg, J. Colloid Interface Sci., 1992, 149, 528–535 CrossRef CAS.
- A. Panáček, L. Kvitek, R. Prucek, M. Kolar, R. Vecerova, N. Pizurova, V. K. Sharma, T. J. Nevečná and R. Zboril, J. Phys. Chem. B, 2006, 110, 16248–16253 CrossRef PubMed.
- L. L. Schramm and J. C. T. Kwak, Clays Clay Miner., 1982, 30, 40–48 CAS.
- S. Garcia-Garcia, S. Wold and M. Jonsson, J. Colloid Interface Sci., 2007, 315, 512–519 CrossRef CAS PubMed.
- E. Tombácz, J. Balázs, J. Lakatos and F. Szántó, Colloid Polym. Sci., 1989, 267, 1016–1025 Search PubMed.
- A. Delgado, F. Gonzalez-Caballero and J. Bruque, J. Colloid Interface Sci., 1986, 113, 203–211 CrossRef CAS.
- V. Metz, K. Amram and J. Ganor, Geochim. Cosmochim. Acta, 2005, 69, 1755–1772 CrossRef CAS PubMed.
- P. Leroy, C. Tournassat, O. Bernard, N. Devau and M. Azaroual, J. Colloid Interface Sci., 2015, 451, 21–39 CrossRef CAS PubMed.
- E. E. Saka and C. Güler, Clay Miner., 2006, 41, 853–861 CrossRef CAS PubMed.
- Y. Horikawa, R. Murray and J. Quirk, Colloids Surf., 1988, 32, 181–195 CrossRef CAS.
- I. Callaghan and R. Ottewill, Faraday Discuss. Chem. Soc., 1974, 57, 110–118 RSC.
- S. Rossi, P. F. Luckham and T. F. Tadros, Colloids Surf., A, 2002, 201, 85–100 CrossRef CAS.
- I. Sondi, J. Bišćan and V. Pravdić, J. Colloid Interface Sci., 1996, 178, 514–522 CrossRef CAS.
- N. R. O'Brien, Clays Clay Miner., 1971, 19, 353–359 Search PubMed.
- L. B. Williams and R. L. Hervig, Am. Mineral., 2002, 87, 1564–1570 CAS.
- J. Hower and T. C. Mowatt, Am. Mineral., 1966, 51, 825–854 CAS.
- K. A. Huynh and K. L. Chen, Environ. Sci. Technol., 2011, 45, 5564–5571 CrossRef CAS PubMed.
- A. M. El Badawy, K. G. Scheckel, M. Suidan and T. Tolaymat, Sci. Total Environ., 2012, 429, 325–331 CrossRef CAS PubMed.
- B. Derjaguin and L. Landau, Acta Physicochim. URSS, 1941, 14, 633–652 Search PubMed.
- E. J. W. Verwey and J. T. G. Overbeek, Theory of the stability of lyophobic colloids, Courier Dover Publications, 1999 Search PubMed.
- J. Oster, I. Shainberg and J. Wood, Soil Sci. Soc. Am. J., 1980, 44, 955–959 CrossRef CAS.
- H. Van Olphen and P. H. Hsu, Soil Sci., 1978, 126, 59 CrossRef.
- A. Katz, M. Xu, J. C. Steiner, A. Trusiak, A. Alimova, P. Gottlieb and K. Block, Clays Clay Miner., 2013, 61, 1–10 CrossRef CAS.
- H. Arora and N. Coleman, Soil Sci., 1979, 127, 134–139 CrossRef CAS.
- P. Rengasamy, J. Soil Sci., 1983, 34, 723–732 CrossRef CAS PubMed.
- R. Greene, A. Posner and J. Quirk, in Modification of soil structure, ed. W. W. Emerson, R. D. Bond and A. R. Dexter, Wiley, New York, 1978, pp. 35–40 Search PubMed.
- M. Alvarez-Silva, A. Uribe-Salas, M. Mirnezami and J. Finch, Miner. Eng., 2010, 23, 383–389 CrossRef CAS PubMed.
- E. Errais, J. Duplay, M. Elhabiri, M. Khodja, R. Ocampo, R. Baltenweck-Guyot and F. Darragi, Colloids Surf., A, 2012, 403, 69–78 CrossRef CAS PubMed.
- Y. Lan, B. Deng, C. Kim and E. C. Thornton, Geochem. Trans., 2007, 8, 4 CrossRef PubMed.
- M. Muneer and J. Oades, Soil Res., 1989, 27, 411–423 CrossRef CAS.
- Y. Mao, M. Cates and H. Lekkerkerker, Phys. A, 1995, 222, 10–24 CrossRef CAS.
- B. Götzelmann, R. Evans and S. Dietrich, Phys. Rev. E: Stat. Phys., Plasmas, Fluids, Relat. Interdiscip. Top., 1998, 57, 6785 CrossRef.
- M. Elimelech, X. Jia, J. Gregory and R. Williams, Particle deposition & aggregation: measurement, modelling and simulation, Butterworth-Heinemann, 1998 Search PubMed.
- Y. Liang, S. A. Bradford, J. Simunek, M. Heggen, H. Vereecken and E. Klumpp, Environ. Sci. Technol., 2013, 47, 12229–12237 CrossRef CAS PubMed.
- V. G. Pol, D. Srivastava, O. Palchik, V. Palchik, M. Slifkin, A. Weiss and A. Gedanken, Langmuir, 2002, 18, 3352–3357 CrossRef CAS.
Footnote |
| † Electronic supplementary information (ESI) available. See DOI: 10.1039/c5en00130g |
| This journal is © The Royal Society of Chemistry 2015 |

