 Open Access Article
Creative Commons Attribution 3.0 Unported Licence
Platinum and platinum based nanoalloys synthesized by wet chemistry
Caroline
Salzemann
ab,
Farid
Kameche
ab,
Anh-Tu
Ngo
ab,
Pascal
Andreazza
 c,
Monica
Calatayud
def and
Christophe
Petit
*ab
aSorbonne Universités, UPMC Univ Paris 06, UMR 8233, MONARIS, 4 place Jussieu, F-75005, Paris, France. E-mail: christophe.petit@upmc.fr
bCNRS, UMR 8233, MONARIS, 4 place Jussieu, F-75005, Paris, France
cCentre de Recherche sur la Matière Divisée, CRMD, Université d'Orléans, CNRS, 1 bis rue de la Férollerie, F-45071, Orléans Cedex 2, France
dSorbonne Universités, UPMC Univ Paris 06, UMR 7616, Laboratoire de Chimie Théorique, F-75005, Paris, France
eCNRS, UMR 7616, Laboratoire de Chimie Théorique, F-75005, Paris, France
fInstitut Universitaire de France,
First published on 12th February 2015
Abstract
Platinum nanocrystals and their derivatives with palladium and cobalt are of fundamental interest due to their wide field of application in chemistry and physics. Their properties are strongly dependent on their shape and composition. However the chemical route is far from allowing control of both shape and composition. In this paper, we show both experimentally and theoretically the important role of the interaction of small adsorbed molecules on the shape but also on the composition. This has been studied by comparing the case of pure palladium and platinum nanocrystals and the case of PtPd and PtCo nanoalloys synthesized by the liquid–liquid phase transfer method.
A Introduction
Inorganic nanocrystals, NCs, are widely studied and used in chemical, biological and physical devices (i.e. in catalysis, magnetism, optics, etc.). Understanding their properties and exploring their applications are two major driving forces behind the synthesis of a large variety of nanomaterials.1 It is now well known that the fine tuning of structural parameters such as the size, shape and bimetallic composition mainly controls these properties. Nowadays, platinum, palladium and their derivatives appear to be good candidates for applications in nanotechnology.2 However, these resources are scarce, and it is therefore necessary to develop new approaches to optimize their use in the physical and chemical fields. In a sustainable approach, soft chemistry is well adapted to produce such metal nanoparticles and nanoalloys in large amounts. However, on the nanometer scale, as the properties are strongly dependent on the size and the surface state (raw or capped), it is crucial to develop methods where the polydispersity in size and composition is finely controlled. The proper designed wet chemistry synthesis, even in liquid isotropic solutions, offers a suitable means of producing metallic nanoparticles with designed compositions and to control their shapes at the nanoscopic scale.3 These processes are however quite complex as all the physical and chemical parameters could play an important role, and to date there is no clear answer to the control of both the particle nanomorphology and the particle composition. Indeed, many recipes exist without a general framework.2,4–6 In order to provide a quantitative and qualitative response to these problems, we present here the synthesis of platinum and palladium nanocrystals and their nanoalloys PtxPd1−x and PtxCo1−x. On the one hand, in situ growth evolution of platinum and palladium nanocrystals under several chemical conditions have been investigated by Small Angle X-ray Scattering. On the other hand TEM investigation of the crystallinity and shape of the NCs has been performed. Density functional theory (DFT) calculations show the key role of hydrogen in the formation of cubic platinum shapes. These results illustrate, both experimentally and theoretically, the primordial role of the capping agent and of the dissolved gases issued either from air or as a by-product of the reaction, which may strongly influence the shape and the composition of NCs. In particular, platinum nanocubes are obtained only in the presence of an H2 overpressure, due to a preferential adsorption on (100) facets compared to the (111) facets, whereas it is not possible to control the shape of palladium nanocrystals under similar conditions due to a difference in the nature of the interaction of H2 with the palladium surfaces. In the case of nanoalloys it demonstrates the important role of the kinetics of formation of the precursor to control the composition and its influence on the nanomorphology. The present work aims at shedding light on the complexity of the control of the nanomorphology and composition, as it needs a fine tuning of the various physical–chemical parameters to establish a general framework of growth of metallic or bimetallic nanoparticles in solution.B Methods
B.1 Synthesis of metallic nanoparticles
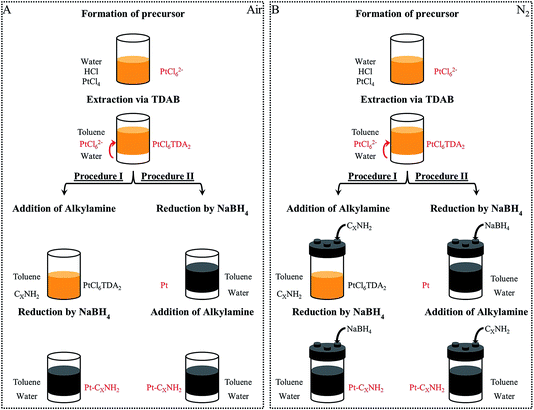
(Fig. 1) Pt, Pd or Co nanocrystals and PtPd or CoPt nanoalloys are synthesized by the phase transfer synthesis method presented by Brust et al.7 Typically, it consists of metal ion transfer from an aqueous phase to an organic phase using an extractant molecule. The nanocrystals are obtained by chemical reduction.![[thin space (1/6-em)]](https://www.rsc.org/images/entities/char_2009.gif) :
:![[thin space (1/6-em)]](https://www.rsc.org/images/entities/char_2009.gif) 1). The two phase mixture is vigorously stirred until all the metallic complexes are transferred into the organic phase (30 min). The colourless water phase is then discarded.
1). The two phase mixture is vigorously stirred until all the metallic complexes are transferred into the organic phase (30 min). The colourless water phase is then discarded.
B.1.2.1 Procedure I: reduction in presence of the capping agent. (Fig. 1) 1.2 × 10⁻² mol octylamine (C8NH2) used as a Capping Agent (CA) is added under stirring to 40 cm3 of the obtained organic solution containing the metallic complexes. A freshly prepared aqueous solution of NaBH4 (10 cm3, 1 mol L−1) is added dropwise under stirring, leading to an emulsion. This induces the reduction of the metallic salt at the interface of the organic and aqueous phases. Both the reducing agent and the capping agent are added in large stoichiometric excess relative to the palladium/platinum/cobalt (for example NaBH4/Pt4+ = 160
![[thin space (1/6-em)]](https://www.rsc.org/images/entities/char_2009.gif) :
:![[thin space (1/6-em)]](https://www.rsc.org/images/entities/char_2009.gif) 1 and CA/Pt = 96
1 and CA/Pt = 96![[thin space (1/6-em)]](https://www.rsc.org/images/entities/char_2009.gif) :
:![[thin space (1/6-em)]](https://www.rsc.org/images/entities/char_2009.gif) 1). The emulsion turns relatively quickly from orange (in the case of platinum) to dark brown. The reaction takes place overnight, after which the stirring is turned off and the organic phase containing the metallic nanoparticles is collected and evaporated using a rotavapor. The black paste obtained is then washed with 40 cm3 ethanol. Then, the turbid solution is centrifuged and the supernatant is discarded. This operation is repeated twice. After the last centrifugation, the precipitate is redispersed in 4 cm3 toluene. The final solution contains the coated C8NH2-nanoparticles in toluene.
1). The emulsion turns relatively quickly from orange (in the case of platinum) to dark brown. The reaction takes place overnight, after which the stirring is turned off and the organic phase containing the metallic nanoparticles is collected and evaporated using a rotavapor. The black paste obtained is then washed with 40 cm3 ethanol. Then, the turbid solution is centrifuged and the supernatant is discarded. This operation is repeated twice. After the last centrifugation, the precipitate is redispersed in 4 cm3 toluene. The final solution contains the coated C8NH2-nanoparticles in toluene.
B.1.2.2 Procedure II: reduction followed by the addition of a capping agent. In this case, the freshly prepared aqueous solution of NaBH4 (10 cm3, 1 mol L−1) is added dropwise under stirring to 20 cm3 of the organic solution containing the metallic complexes. The reduction occurs in the emulsion phase, at the interface of the organic and aqueous phases, which results in a color change from orange to dark brown. After 60 minutes (ripening time τrip), 1.2 × 10⁻² mol octylamine (C8NH2) capping agent is then added. The chemical bath is kept under stirring for one night, then the nanocrystals are extracted following the procedure described above. The final solution contains the coated C8NH2-nanoparticles in toluene.
Hydrogen is naturally produced by the chemical reduction. To perform the reaction under a saturated H2 atmosphere, a closed screw cap with three ports is used and the reducing and capping agents are injected through a silicone septum (see Fig. 1B).
B.2 DFT calculation
The rPBE (revised Perdew–Becke–Erzernhof functional) has been used as implemented in the VASP code.8,9 Projector augmented wave (PAW) pseudopotentials10,11 represent the core electrons, whereas the valence electrons (Pt: 10; H: 1; N: 5; C: 4) are explicitly described by a plane-wave basis set (cutoff 400 eV). In order to investigate the shape of the platinum nanoparticles we assume that cubic NPs exhibit (100) terminations, octahedral NPs exhibit (111) terminations and truncated shapes exhibit both terminations. Then, calculating the relative stability of (100) and (111) slabs gives an indication of the particle morphology. The unit cells have been chosen to have similar surface area and equal composition to the slab so the total energy can be easily compared. The (100) termination was modelled by a c2 × 2 unit cell (dimensions 5.635 × 5.635 × 35 Å3) and the (111) termination by a 2 × 2 unit cell (dimensions 5.628 × 5.628 × 35 Å3), a vacuum of ∼20 Å is included to prevent interaction between successive slabs. A 5 × 5 × 1 k-point scheme is used to sample the Brillouin zone. The thickness of each slab is five atomic layers, each layer containing 4 Pt atoms (20 atoms per slab); the three uppermost layers are allowed to relax with the adsorbates, the two bottom layers were kept fixed in the ideal bulk positions. The ionic loop is converged below 1 meV using the conjugate gradient method. Dispersion forces have been included for all atoms in the slab, as implemented in the Grimme-D2 approach, the parameters used for Pt are C6 = 19.46 J nm6 mol−1, R0 = 1.676 Å.The reaction of adsorption of N molecules of type M on the slab (hydrogen or octylamine) is represented as:
| Slab + NM = [Slab − NM] | (1) |
The reaction energy associated with eqn (1) can be used to estimate the stability of a slab from Gibbs free energies Gi and chemical potential μM:
| ΔGr = G[Slab¬NM] – Gslab – NμM | (2) |
Neglecting volume and entropy changes because they are equal for the two slabs, the Gibbs energy can thus be replaced by the total-energy values, as obtained from the calculations.
B.3 X-ray scattering experiments and analysis
In situ SAXS experiments during nanoparticle growth were carried out on the SAXS station at SWING beamline at the Soleil Synchrotron Radiation Facility (France). The incident X-ray energy was selected to be 11![[thin space (1/6-em)]](https://www.rsc.org/images/entities/char_2009.gif) 264 eV (0.11 nm in wavelength λ) for SAXS experiments by a double-crystal Si (111) monochromator below the Pt L3 edge to avoid the fluorescence effect. The scattering experiments were performed using a two-dimensional AVIEX CCD camera (170 × 170 mm2, 4096 × 4096 pixels), moving in a vacuum detection tunnel in order to optimize the q range of scattering patterns, where q is the scattering vector (q = 4π
264 eV (0.11 nm in wavelength λ) for SAXS experiments by a double-crystal Si (111) monochromator below the Pt L3 edge to avoid the fluorescence effect. The scattering experiments were performed using a two-dimensional AVIEX CCD camera (170 × 170 mm2, 4096 × 4096 pixels), moving in a vacuum detection tunnel in order to optimize the q range of scattering patterns, where q is the scattering vector (q = 4π![[thin space (1/6-em)]](https://www.rsc.org/images/entities/char_2009.gif) sin
sin![[thin space (1/6-em)]](https://www.rsc.org/images/entities/char_2009.gif) θ/λ, where θ is the scattering angle). Thus, the sample–detector distance was set to 1.2 m for the SAXS measurement, and given a q range between 0.01 and 8 nm−1. The particle scattering signal was obtained after signal normalization by two methods: (i) detector sensibility and incident beam (ii) subtraction of the capillary-cell/pure-buffer-solution signal and air signal.
θ/λ, where θ is the scattering angle). Thus, the sample–detector distance was set to 1.2 m for the SAXS measurement, and given a q range between 0.01 and 8 nm−1. The particle scattering signal was obtained after signal normalization by two methods: (i) detector sensibility and incident beam (ii) subtraction of the capillary-cell/pure-buffer-solution signal and air signal.
Particle size and shape analysis are complex to extract from the SAXS pattern, and this typically requires fitting mathematical models of shape and size distribution to the data. This method avoids approximations (e.g. Guinier gyration radius technique12 or by applying some power law with the scattering vector q) commonly used to extract morphological parameters. We used a combination of fitting methods to extract particle dimensions (diameter D) and shape distribution from the SAXS data and cross-checking the methods against each other (TEM and HRTEM). We found, in general, good agreement between the results from SAXS and TEM data.13 The 1-D plot of X-ray scattering intensity patterns versus scattering vector, q, on a log–lin scale provides information about the nanoparticle morphology. The oscillations observed arise from the inherent form-factor scattering from the particles. These oscillations are often ‘washed-out’ by polydispersity in particle size or eventually in shape, requiring simulations with analytical models for the analysis. Because no interference maxima due to correlation between particles (small interparticle distance) were detected, we have considered data taken from the diluted samples. The scattered X-ray intensity becomes, for an assembly of particles of a size distribution,
| N(R): I(q) = 〈Δρ〉2∫V2(R)P(q,R)N(R)dR |
In a first analysis and faceted shape, form factors in a second step14,15 with a Gaussian size distribution
C Result and discussion
C.1 Pure metallic nanocrystals: influence of the metal on the size and shape
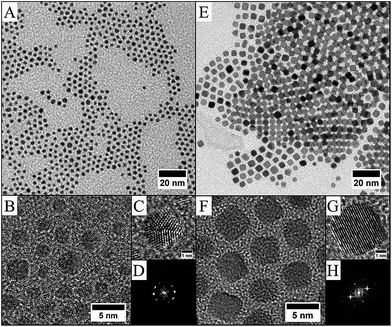
Shape control is often due to a specific poisoning of crystalline facets during the growth process.2,18,19 In our case, competition between amine and H2 adsorption does change depending on the synthesis route. Hence, periodic DFT calculations have been carried out to compute the stability of the terminations of (111) and (100) slabs, the details of the calculations are given above. The bare (111)-terminated slabs are found to be more stable than the (100)-terminated ones, in agreement with the literature,20 and thus in vacuum conditions octahedral or decahedral particles are expected to be formed.21 As for the covered slabs, we have computed the interaction of dihydrogen, which is formed in the synthesis due to the addition of the reducing agent, and of the capping agent octylamine. It is known that H2 dissociates without a barrier at the platinum surfaces,22,23 therefore only atomic hydrogen adsorbed is considered: starting with 1, and increasing the H content up to 8 hydrogen atoms, all the compositions have been calculated. Hydrogen is found to adsorb on bridging sites for the (100) slab, and on a mixture of bridge, top and hollow sites for the (111) slab, in agreement with previous calculations.24Table 1 shows the calculated adsorption energy for each slab. It is found that the (100) slab shows a higher affinity for adsorbing H, with exothermic Eads per H between −0.70 eV (1H) and −0.56 eV (7H), whereas the (111) slab shows Eads ranging between −0.58 eV (1H) and −0.51 eV (4H). Note that the maximum content of atomic hydrogen is 7H for (100) and 4H for (111). Above these values atomic hydrogen recombines to form H2 and desorbs. This behaviour confirms the higher affinity of (100) terminations for hydrogen compared to (111) termination. In order to investigate the role of the capping agent, the adsorption of octylamine is also computed and it is found to adsorb on the top sites on both surfaces, tilted ∼25 deg from the vertical of the slab. The calculated adsorption energies for the two slabs shown in Table 1 are very similar: −1.19 eV (111) and −1.23 eV (100), indicating that octylamine molecules have no preference for a given termination.
| E ads (111) | E ads (100) | E ads (100)/(111) (predicted shape) | |
|---|---|---|---|
| a Molecular H2 is formed. b Total energy. | |||
| 0H | −118.85b | −116.72b | 0.982 (truncated octahedron) |
| 1H | −0.58 | −0.70 | 1.22 (cubic) |
| 2H | −0.55 | −0.70 | 1.27 (cubic) |
| 3H | −0.44 | −0.68 | 1.57 (cubic) |
| 4H | −0.51 | −0.72 | 1.43 (cubic) |
| 5H | −0.39a | −0.63 | 1.61 (cubic) |
| 6H | −0.37a | −0.54 | 1.47 (cubic) |
| 7H | −0.31a | −0.56 | 1.81 (cubic) |
| 8H | −0.28a | −0.49a | 1.75 (cubic) |
| C8NH2 | −1.19 | −1.23 | 1.03 (truncated octahedron) |
The shape of platinum nanoparticles can be qualitatively predicted based on the results presented above. The most exposed planes will be the most stable and will correspond to those growing more slowly. The ratio of the adsorption energies on each slab, Eads(100)/(111) can be taken as a measure of the relative stability of the (100) slab with respect to (111): values higher than 1 indicate a stabilization of (100) termination and thus the particle tends to the cubic shape; values lower than 1 indicate octahedral-shaped particles, and values close to 1 indicate that the two terminations are almost equivalent in energy and will expose the same area, leading to truncated octahedral morphology. Our results explain the experimental procedure: the reducing agent must be introduced before the capping agent to stabilize (100) terminations. The further addition of octylamine will displace hydrogen stabilizing cubic shapes. Moreover, high pressure of hydrogen is needed, otherwise isotropic particles are obtained. This is obtained using closed vessels. If the octylamine is added prior to the reducing agent, it will stabilize both (111) and (100) terminations. Due to the affinity of the octylamine for platinum, it probably blocks the surface sites, making the growth dynamic slower, leading to small isotropic particles.
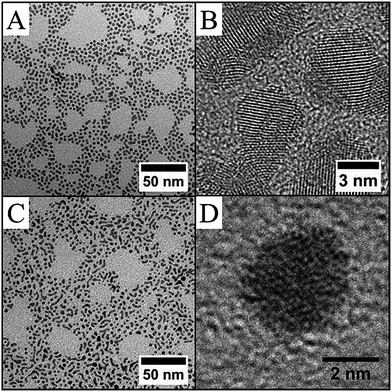 | ||
| Fig. 3 Pd–C8NH2 nanoparticles obtained under overpressure of H2 from procedure I: TEM image (A) and HRTEM image (B) and from procedure II: TEM (C) and HRTEM (D) images. | ||
C.2 Kinetics in situ investigation of the growth process of pure metallic nanoparticles
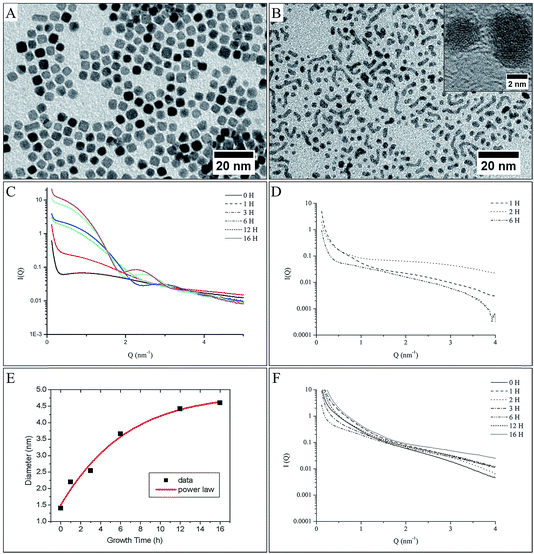
Complementary to the TEM investigation and DFT calculation and in order to give a quantitative and qualitative response, the growth evolution of platinum nanocrystals has been investigated in situ and in real time. We focus here on the complete description of the formation mechanism, which would require measuring the morphological evolution (i.e. size, shape and polydispersity) of nanoparticles with time. In this respect, Small Angle X-ray Scattering (SAXS) is perfectly suited for assessing the particle growth kinetics in terms of the nanomorphology.28–32 Here, we have developed in situ SAXS investigations. A quantitative fitting of the scattering diagram allowed us to determine the size distribution and the shape distribution of the first stage of nanoparticle formation and to follow their subsequent growth. The in situ SAXS investigation is reported for both sample platinum (obtained from procedure II, in the presence of an overpressure of H2, Fig. 4B) and palladium nanoparticles (obtained from procedure II, either in the presence (Fig. 4E) or in the absence (Fig. 4F) of an overpressure of H2, after a ripening time of 60 min. These measurements are made on small aliquots taken directly out of the chemical bath at specific times after adding the capping agent, from 0 to 16 hours. It is clear that the behavior totally differs. In the case of platinum nanocrystals obtained under H2 overpressure, the SAXS patterns (Fig. 4B) show an evolution of the I(q) vs. q curve with more and more pronounced oscillations and with a shorter period, characteristic of a progressive formation of low polydisperse isotropic nanostructures33–36 of increasing size. Finally, platinum nanocubes are obtained due to the H poisoning of the (100) facets (Fig. 4A). The average radius of nanocrystals was extracted from the adjustment of the experimental SAXS pattern by a simulation, using a simple spherical form factor of particles (Fig. 4C) and taking into account a size dispersion effect (see experimental section). Fig. 4C shows the evolution of this radius with the ageing time. There is a monotonic increase of the average size during the ageing process. Compared to the formation of nanocrystals in other liquid systems, the growth process is considerably slowed down: it takes 16 hours, compared to a few seconds for reduction of gold in a homogeneous solution,31,37 or a few minutes for silver in reverse micelles.38 However, this evolution is consistent with a growth process based on the aggregation of the monomer (Pt0) on the surface of the nuclei. In the liquid–liquid phase transfer synthesis developed by Brust et al.,7 the following are assumed: (i) the formation of monomer at the oil/water interface during the adding of the reducing agent, (ii) transfer of the capped TDAB/monomer into the organic phase where the nucleation occurs, (iii) growth process of the nuclei by aggregation of the monomer on the surface of the nuclei. The variation of the average radius in the time gives an indication of the growth process and the reactivity of the surfaces of the nuclei.15,31 Here the average radius varies as t1/2 (solid line on Fig. 4C). This indicates that the growth process is limited by the reactivity at the surface of the nuclei under a high overpressure of H2 (i.e. t0 = 60 min).31This behaviour confirms our assumption of the aggregation of monomers on the surface of the nuclei,31 and not aggregation of the nuclei. However, the presence of H, adsorbed at the platinum surface,22,23 strongly modified the kinetics of the growth process: for this sample, octylamine is added 60 min after completion of the reduction (t0 = 60 min, i.e. with a high enough pressure of H2 to passivate the platinum surface (see above and ref. 17)). This poisoning of the surface induces a slowing down of the aggregation process, as it is the incorporation of the monomer in the crystalline lattice of the nanoparticle that is the limiting step in the growth process. This yields to larger nanocrystals, as there is an accumulation of monomer close to the surface of the nanocrystals. This is reinforced because the interaction between octylamine and the metal particle, which limits the final size, is lower in procedure II due to the H adsorption on the platinum surface (see above). Hence, we experimentally confirm the growth process assumed in the Brust synthesis7 and it is clearly demonstrates the effect of H2 on the kinetic control of the nanocrystal size, as predicted by the DFT calculation.
In the case of palladium nanocrystals obtained by procedure II in the presence of an overpressure of H2, a very different scattering pattern is obtained (Fig. 4E). There is no significant evolution of the SAXS pattern shape with ageing time (the change in intensity between 1 nm−1 < q < 6 nm−1 is only due to a variation in the amount of palladium nanocrystals in the aliquots studied, as some inhomogeneity occurs during the reaction progress). In particular, there is no specific oscillation in a shorter time in the I(q) vs. q curves characteristic of a particle with a specific shape growing by aggregation. However, at a very low angle, below 1 nm−1, a strong increase in the scattered intensity is observed (where I(q) is proportional to q−1), characteristic of the presence of elongated nanoparticles.33,35 These results are in agreement with TEM observation (Fig. 4D), which clearly shows highly polydisperse spherical nanoparticles or nanowires. It should be noticed that this growth process is a consequence of the use of a physisorbed octylamine passivating agent, which allows direct contact between the metal surfaces of the palladium nanocrystals and then crystallographic reconstruction leading to nanowires. As expected from the model discussed above, there is no specific effect of the environment as the interaction of H2 with the Pd surfaces leads to PdHx in the presence or absence of an overpressure of H2. Thus, similar scattering patterns are obtained for palladium nanocrystals synthesized by procedure II, but without maintaining an overpressure of H2 (see Fig. 1A) after the addition of the capping agent (i.e. in open air Fig. 4F). Again the SAXS patterns show a homogenous evolution with time not observed in the case of procedure II, which indicates a homogenous growth process, which could explain the better shape control in case of palladium, where the polydispersity is lower than that observed for palladium NCs obtained by procedure II. This reflects the strong influence of the anchoring of the capping agent on the growth process and finally on the shape control.2,3
Thus, as the shape control and the growth process in liquid–liquid phase transfer synthesis is strongly dependent on the binding of the capping agent on the metallic surfaces, we demonstrate here, with platinum and palladium, different behaviour due to a change of the metal surface state induced by the nature of the interaction of H2 with the metal. Hence, it is demonstrated that the chemical route and the nature of the metal strongly influence the shape and size of the metallic nanocrystals.
C.3 Platinum derived nanoalloys
The liquid–liquid phase transfer method presented above has been used to form either CoxPt1−x or PdxPt1−x nanoalloys. Only a few works deal with nanoalloys obtained by this two-phase synthesis, due to the difficulty of controlling their composition. We have previously reported the case of CoPt synthesis.39,40 Perfect control of the composition can be only achieved if the two precursors are similar in structure and are located in the liquid medium. As a matter of fact, the large difference in reduction potential of platinum (ESHE Pt(II)/Pt = 1.2 V) and cobalt (ESHE Co(II)/Co = −0.28 V) can induce a strong variation in the reduction kinetics. As an example, if the platinum precursor is in the organic phase (complexed by the transfer agent) and the cobalt precursor is in the water phase (as an aqueous salt), the reduction takes place during the emulsification of the solution obtained by stirring when the reducing agent is added. If the reduction of platinum is dominated by the interface, the reduction of cobalt is dominated by the reduction kinetics of the salt in the aqueous phase. Thus, the co-reduction is carried out in two distinct ways. Therefore, a strong discrepancy occurs in the average content of the cobalt in the nanocrystal compared to the expected ratio. Due to the change in the characteristics of the emulsion droplets from one to another, the homogeneity in composition is low. Conversely, if both cobalt and platinum salts are in the organic phase interacting with an interface, only the reaction conditions are predominant and the difference in redox potentials is no longer a problem for this interfacial reaction.41 Thus, the best results are obtained when cobalt is in the same form as the platinum: CoCl2(TDA)2 and PtCl4(TDA)2, i.e. both complexed by the same agent transfer (see Fig. 5A). These two molecules have a similar structure and the composition of the interface where the reduction takes place is directly related to the initial composition of the metallic precursor. Hence, the reduction leads to precise control of the composition.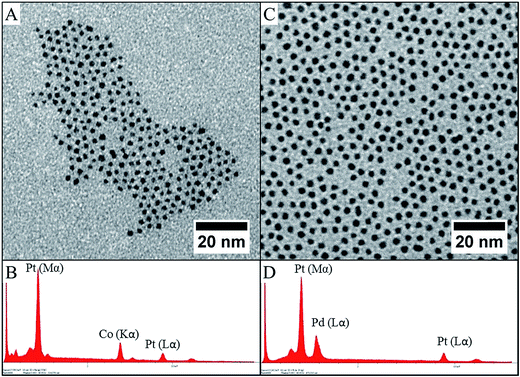 | ||
| Fig. 5 TEM images of CoPt–C8NH2 (A) and PdPt–C8NH2 (C) with their respective EDX analyses (B and D). | ||
A similar procedure has been adapted to the case of PtxPd1−x nanocrystals. Fig. 5C and D shows typical result for Pd50Pt50. Again nanocrystals are spherical in shape with an average diameter of 2.2 nm and low polydisperisty in size and composition. The average composition, as determined by EDX analysis, is maintained at 50![[thin space (1/6-em)]](https://www.rsc.org/images/entities/char_2009.gif) :
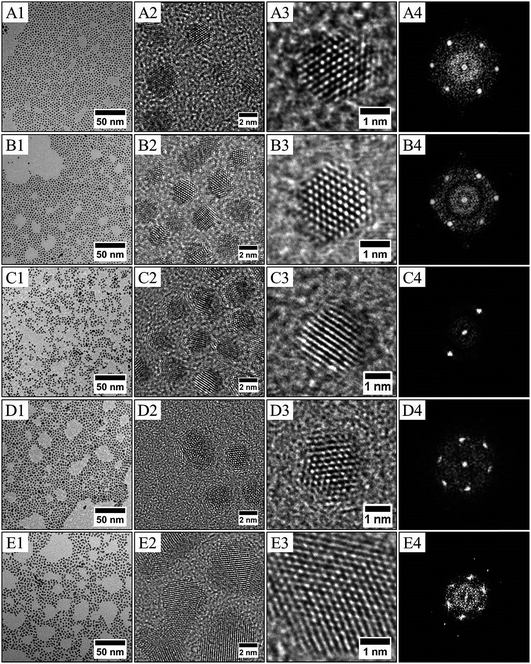
:![[thin space (1/6-em)]](https://www.rsc.org/images/entities/char_2009.gif) 50 ± 2%. To confirm the formation of PdPt alloys, nanocrystals have been synthesized with various compositions by adjusting the initial metallic salt ratio in the synthesis (see method above). Fig. 6 shows the TEM and HRTEM investigation for PtxPd1−x nanocrystals depending on the composition. It can be seen that the nanocrystals are homogeneous in size, shape and electronic contrast, which is consistent with the formation of nanoalloys.39,40 The as-prepared PtxPd1−x nanoparticles have high crystallinity, as evidenced by clearly resolved lattice fringes in HRTEM (Fig. 6), whatever the composition. It is known that PtPd bulk alloys form a complete solid solution,42 as their lattice parameters are very close (aPt = 0.392 nm and aPd = 0.389 nm for a similar fcc structure). Therefore the inter-lattice distance should not vary between Pd (111) fcc and Pt (111) fcc. From the HRTEM pictures and the associated FFT, the lattice parameter of the fcc structure is estimated to be 0.38 ± 0.01 nm for all compositions. The constant stoichiometry observed for each composition, as well as the TEM and HRTEM results, rules out the possibility of nano-phase segregation or core–shell formation. As for CoPt,39 both decahedron and truncated octahedron structures are observed. The structural investigation is in agreement with the formation of PdxPt1−x nanoalloys in the disordered A1 phase as indicated by the FFT, which is characteristic of fcc nanoalloys (Fig. 6).
50 ± 2%. To confirm the formation of PdPt alloys, nanocrystals have been synthesized with various compositions by adjusting the initial metallic salt ratio in the synthesis (see method above). Fig. 6 shows the TEM and HRTEM investigation for PtxPd1−x nanocrystals depending on the composition. It can be seen that the nanocrystals are homogeneous in size, shape and electronic contrast, which is consistent with the formation of nanoalloys.39,40 The as-prepared PtxPd1−x nanoparticles have high crystallinity, as evidenced by clearly resolved lattice fringes in HRTEM (Fig. 6), whatever the composition. It is known that PtPd bulk alloys form a complete solid solution,42 as their lattice parameters are very close (aPt = 0.392 nm and aPd = 0.389 nm for a similar fcc structure). Therefore the inter-lattice distance should not vary between Pd (111) fcc and Pt (111) fcc. From the HRTEM pictures and the associated FFT, the lattice parameter of the fcc structure is estimated to be 0.38 ± 0.01 nm for all compositions. The constant stoichiometry observed for each composition, as well as the TEM and HRTEM results, rules out the possibility of nano-phase segregation or core–shell formation. As for CoPt,39 both decahedron and truncated octahedron structures are observed. The structural investigation is in agreement with the formation of PdxPt1−x nanoalloys in the disordered A1 phase as indicated by the FFT, which is characteristic of fcc nanoalloys (Fig. 6).
It should be noticed that in both cases, nanoalloys could be easily obtained in a large range of compositions, depicting the difference in lattice parameters for Co and Pd compared to palladium. The mismatch is below 1% for Pt and Pd, and 10% for Co and Pt (aCo = 0.355 nm for the fcc structure). This is consistent with a random substitution of platinum atoms by cobalt or palladium atoms in the platinum lattice. Indeed, our procedure allows complete and precise control of the composition over a large range for both CoxPt1−x and PdxPt1−x, and could probably be extended to other types of bimetallic nanoparticles.
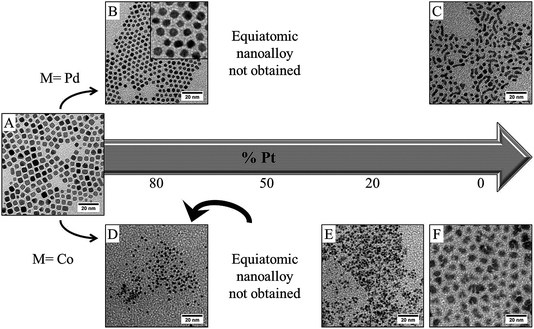
Fig. 7 summarizes the result obtained by TEM investigation for both PdPt (Fig. 7A–C) and CoPt (Fig. 7D–F) if the reducing agent is added before the introduction of the capping agent (procedure II, see Fig. 1). Starting from conditions where platinum nanocubes are obtained (Fig. 7A), it is not possible, by this chemical method, to control both the composition and the shape, even in the case of PtPd where a total solid solution exists in bulk materials.42 For Pt80Pd20, well faceted cubo-octahedrons are obtained (Fig. 7B), which shows the persistent influence of the hydrogen–platinum (which is the main component) interaction. This shape control totally disappears if the amount of palladium increases. Furthermore, it has not been possible to obtain stable nanocrystals starting from an equimolar solution of platinum and palladium salt: the NCs are probably too small to be recovered after the extraction process. Increasing the palladium content allows for stable NCs only for high palladium content (higher than 80%), but in this condition highly polydisperse NCs similar to those obtained for pure palladium (Fig. 7C) are obtained. Thus, only nanoalloys rich in palladium or rich in platinum could be obtained by this procedure. The situation appears more dramatic in the case of CoPt (Fig. 7D–F). By procedure II it is not possible to obtain nanoalloys. In fact at high cobalt content, segregation occurs where both cobalt NCs, poorly crystallized, and small spherical platinum NCs are obtained (Fig. 7E). Decreasing the amount of cobalt (<50%) yields small spherical NCs with an average composition of about 20% cobalt (as determined by EDX analysis). It should be noticed that pure cobalt NCs could be obtained (Fig. 7F), however they are amorphous, unshaped and strongly oxidizible, as amine cannot efficiently protect the cobalt surfaces. These results illustrate the importance of the complexation of the monomer by the capping agent to obtain a perfect control of the composition. In our synthesis, nanoalloys can only be obtained with a large composition control following procedure I, where the capping agent is added before the reducing agent. This is probably due to the fact that a stable composition of the interface during the reduction could only take place in the presence of the passivating agent. As mentioned above, this probably reflects the difference in the kinetics of formation of Pt(0) and Pd(0) or Co(0) starting from metallic salt. It is known that generally the reduction rates correlate with reduction potentials. In the case of palladium and platinum, the reduction potentials are closer than in the case of cobalt and platinum (ESHE Pt(II)/Pt = 1.2 V; ESHE Co(II)/Co = −0.28 V; ESHE Pd(II)/Pd = 0.99 V). Thus, a partial solid solution could be obtained in the case of PdPt synthesized by procedure II, when it is not possible in the case of CoPt. This could also be due to the difference between the stability of the initial nuclei composed either of pure platinum or both cobalt and platinum or palladium and platinum.43 Both effects can be corrected by complexation with the capping agent. This is the reason why, considering the close vicinity of the lattice parameters (see above), it is easier to synthesize nanoalloys by adding a capping agent prior to the reducing agent (procedure I) than the opposite (procedure II).
D Conclusion
Platinum and palladium nanocrystals can be easily obtained by wet chemistry in ambient conditions using metallic salt as a precursor. These materials have diverse applications in chemistry and physics. Control of the shape of the pure metal NCs or platinum based nanoalloys can be very useful to attain new properties for catalysis or magnetic data storage, but the control of both composition and shape is always a challenge. Indeed, as reported here, this is strongly metal dependent and numerous parameters have to be taken into account in order to understand and control the chemical process. We have shown here the role of the dissolved gases and on the capping agent. This study shows us that it is necessary for future development to design the precursor in order to tune the reduction potential and thus the reduction rates of the metallic salt, but also the state of the metallic surfaces of the growing seed, in order to obtain nanoalloys with both specific composition and shape.Acknowledgements
This work was supported by the French ANR within the program ‘‘Nanocrisnet’’ under Contract ANR-11-BS10-018 and by the LabEx MiChem part of French state funds managed by the ANR within the “Investissements d’Avenir” program under reference ANR-11-IDEX-0004-02. We thank SOLEIL for having provided the installations in synchrotron as well as Dr Franck Meneau for the help brought for the use of the line of light “SWING”. Calculations were performed using HPC resources from GENCI-CINES/IDRIS (grants x2011082131, x2012082131, and x2013082131 for 2011–2013) and the CCRE-DSI of the University P. M. Curie. Thanks to SMART-IP2CT (FR UPMC-CNRS 2622) for financial support.References
- T. K. Kau, A. L. Rogach, F. Jäckel, T. A. Klar and J. Feldmann, Adv. Mater., 2009, 1, 21 Search PubMed.
- G. J. Leong, M. C. Schulze, M. B. Strand, D. Maloney, S. L. Frisco, H. N. Dinh, B. Pivovar and R. M. Richards, Appl. Organomet. Chem., 2014, 28, 1–17 CrossRef CAS PubMed.
- C. Petit, C. Salzemann and A. Demortière, in Complex-shaped Metal Nanoparticles : Bottom-up Syntheses and Application, ed. T. K. Sau and A. L. Rogach, Wiley-VCH, 2012 Search PubMed.
- Q. Zhang, J. Xie, Y. Yu and J. Y. Lee, Nanoscale, 2010, 2, 1962 RSC.
- J. Park, J. Joo, S. G. Kwon, Y. Jang and T. Hyeon, Angew. Chem., Int. Ed., 2007, 46, 4630 CrossRef CAS PubMed.
- J. Turkevich, P. C. Stevenson and J. Hilier, Discuss. Faraday Soc., 1951, 11, 55 RSC.
- M. Brust, M. Walker, D. Bethell, D. J. Schiffrin and R. Whyman, J. Chem. Soc., Chem. Commun., 1994, 7, 801–802 RSC.
- G. Kresse and J. Hafner, Phys. Rev. B: Condens. Matter, 1993, 47, 558 CrossRef CAS.
- G. Kresse and J. Hafner, Phys. Rev. B: Condens. Matter, 1994, 49, 14251 CrossRef CAS.
- P. E. Blochl, Phys. Rev. B: Condens. Matter, 1994, 50, 17953–17979 CrossRef.
- G. Kresse and D. Joubert, Phys. Rev. B: Condens. Matter Mater. Phys., 1999, 59, 1758–1775 CrossRef CAS.
- A. Guinier and G. Fournet, Small-Angle Scattering of X-rays, Wiley, New York, 1955 Search PubMed.
- P. Andreazza, in Nanoalloys, ed. D. Alloyeau, C. Mottet and C. Ricolleau, Springer Eds, 2012, pp. 69–112 Search PubMed.
- S. Disch, E. Wetterskog, R. P. Hermann, G. Salazar-Alvarez, P. Busch, T. Brückel, L. Bergströ and S. Kamali, Nano Lett., 2011, 11, 1651–1656 CrossRef CAS PubMed.
- S. Gómez-Graña, F. Hubert, F. Testard, A. Guerrero-Martínez, I. Grillo, L. M. Liz-Marzán and O. Spalla, Langmuir, 2012, 28, 1453–1459 CrossRef PubMed.
- a-A. Demortières, P. Launois, N. Goubet, P.-A. Albouy and C. Petit, J. Phys. Chem. B, 2008, 112, 14583 CrossRef PubMed; B.-C. Salzemann and C. Petit, Langmuir, 2012, 28, 4835–4841 CrossRef PubMed.
- N. Aguilera-Porta, M. Calatayud, C. Salzemann and C. Petit, J. Phys. Chem. C, 2014, 118, 9290–9298 CAS.
- Complex-shaped Metal Nanoparticles : Bottom-up Syntheses and Application, ed. T. K. Sau and A. L. Rogach, Wiley-VCH, 2012 and reference therein Search PubMed.
- Y. Xia, Y. Xiong, B. Lim and S. E. Skrabalak, Angew. Chem., Int. Ed., 2009, 48, 60–103 CrossRef CAS PubMed.
- L. Vitos, A. V. Ruban, H. L. Skriver and J. Kollar, Surf. Sci., 1998, 411, 186–202 CrossRef CAS.
- F. Baletto, R. Ferrando, A. Fortunelli, F. Montanelli and C. Mottet, J. Chem. Phys., 2002, 116, 3856–3863 CrossRef CAS PubMed.
- A. C. Luntz, J. K. Brown and M. D. Williams, J. Chem. Phys., 1990, 93, 5240–5246 CrossRef CAS PubMed.
- R. A. Olsen, G. J. Kroes and E. J. Baerends, J. Chem. Phys., 1999, 111, 11155–11163 CrossRef CAS PubMed.
- D. C. Ford, Y. Xu and M. Mavrikakis, Surf. Sci., 2005, 587, 159–174 CrossRef CAS PubMed.
- M. Johansson, E. Skúlason, G. Nielsen, S. Murphy, R. M. Nielsen and I. Chorkendorff, Surf. Sci., 2010, 604, 718–729 CrossRef CAS PubMed.
- A. Henglein, J. Phys. Chem. B, 2000, 104, 6683 CrossRef CAS.
- F. J. Ibanes and F. P. Zamborini, J. Am. Chem. Soc., 2000, 130, 622 CrossRef PubMed.
- W. Wang, X. Chen, Q. Cai, G. Mo, L. Jiang, K. Zhang, Z. Chen, Z. Wu and W. Pan, Eur. Phys. J. B, 2008, 65, 57–64 CrossRef CAS.
- H. G. Alison, R. J. Davey, J. Garside, M. J. Quale, G. J. T. Tiddy, D. T. Clarke and G. R. Jones, Phys. Chem. Chem. Phys., 2003, 5, 4998–5000 RSC.
- M. Mougenot, P. Andreazza, C. Andreazza-Vignolle, R. Escalier Sauvage, T. O. Lyon and P. Brault, J. Nanopart. Res., 2011, 14, 672 CrossRef.
- B. Abecassis, F. Testard, O. Spalla and P. Barboux, Nano Lett., 2007, 7, 1723 CrossRef CAS PubMed.
- H. K. Kammler, G. Beaucage, D. Kohls, N. Agashe and J. Ilavsky, J. Appl. Phys., 2005, 97, 054309 CrossRef PubMed.
- Neutrons, X-Rays and Light: Scattering Methods Applied to Soft Condensed Matter, ed. P. Lindner and T. Zemb, North Holland, Amsterdam, 2002 Search PubMed.
- O. Glatter and O. Kratky, Small Angle X-ray Scattering, Academic, Press, London, 1982 Search PubMed.
- C. Petit, P. Lixon and M. P. Pileni, Langmuir, 1991, 7, 2620 CrossRef CAS.
- I. Lisiecki, P. André, A. Filankembo, C. Petit, J. Tanori, T. Gulik-Krzywicki, B. W. Ninham and M. P. Pileni, J. Phys. Chem. B, 1999, 103, 9168 CrossRef CAS.
- N. R. Jana, L. Gearheart and C. J. Murphy, Adv. Mater., 2001, 13, 1389–1393 CrossRef CAS.
- C. Petit, P. Lixon and M. P. Pileni, J. Phys. Chem., 1990, 94, 1598 CrossRef CAS.
- A. Demortière and C. Petit, Langmuir, 2007, 23, 8575 CrossRef PubMed.
- A. Demortière, R. Losno, C. Petit and J. P. Quisefit, Anal. Bioanal. Chem., 2010, 397, 1485 CrossRef PubMed.
- Y. Cheng and D. J. Schiffrin, J. Chem. Soc., Faraday Trans., 1996, 92, 3865 RSC.
- L. Bindi, F. Zaccari, G. Garutti and N. Avigli, Mineral. Mag., 2013, 77, 269–274 CrossRef CAS PubMed.
- R. Ferrando, J. Jellineck and R. L. Johnston, Chem. Rev., 2008, 108, 845 CrossRef CAS PubMed.
| This journal is © The Royal Society of Chemistry 2015 |

