Impact of extraneous proteins on the gastrointestinal fate of sunflower seed (Helianthus annuus) oil bodies: a simulated gastrointestinal tract study
Sakunkhun
Makkhun
ab,
Amit
Khosla
b,
Tim
Foster
b,
David Julian
McClements
c,
Myriam M. L.
Grundy
d and
David A.
Gray
*b
aUniversity of Phayao, Division of Food Science and Technology, School of Agriculture and Natural Resources, Muang, Phayao, 56000 Thailand
bUniversity of Nottingham, Division of Food Sciences, School of Biosciences, Sutton Bonington Campus, Leicestershire, England LE12 5RD, UK. E-mail: David.Gray@nottingham.ac.uk; Fax: +44 (0)1159 516142; Tel: +44 (0)1159 516147
cBiopolymers and Colloids Research Laboratory, Department of Food Science, University of Massachusetts, Amherst, MA 01003, USA
dKing's College London, Department of Biochemistry, Diabetes & Nutritional Sciences Division, Franklin-Wilkins Building, London SE1 9NH, UK
First published on 4th September 2014
Abstract
In this study, we examined the physicochemical nature of sunflower seed oil bodies (in the absence and presence of added protein) exposed to gastrointestinal conditions in vitro: crude oil bodies (COB); washed oil bodies (WOB); whey protein isolate-enriched oil bodies (WOB-WPI); and, sodium caseinate enriched-oil bodies (WOB-SC). All oil body emulsions were passed through an in vitro digestion model that mimicked the stomach and duodenal environments, and their physicochemical properties were measured before, during, and after digestion. Oil bodies had a positive charge under gastric conditions because the pH was below the isoelectric point of the adsorbed protein layer, but they had a negative charge under duodenal conditions which was attributed to changes in interfacial composition resulting from adsorption of bile salts. Oil bodies were highly susceptible to flocculation and coalescence in both gastric and duodenal conditions. SDS-PAGE analysis indicated degradation of oleosin proteins (ca. 18–21 kDa) to a greater or lesser extent (dependent on the emulsion) during the gastric phase in all emulsions tested; there is evidence that some oleosin remained intact in the crude oil body preparation during this phase of the digestion process. Measurements of protein displacement from the surface of COBs during direct exposure to bile salts, without inclusion of a gastric phase, indicated the removal of intact oleosin from native oil bodies.
1. Introduction
The seeds of many plants species store oil as food reserves for germination, and for post germination growth of the seedlings, in organelles called oil bodies or oleosomes. Oil bodies are mainly composed of a triacylglycerol (TAG) core surrounded by phospholipids (PL) and alkaline proteins, e.g. oleosins.1 These proteins prevent coalescence of oil bodies in the cytosol of oilseed cells.2–6 Furthermore, at neutral pH they have a net negative charge which prevents coalescence ex vivo when oil bodies are dispersed in a suspension. Oil bodies isolated from plant seeds in aqueous media are therefore a natural emulsion that may represent a vehicle to deliver stable, pre-emulsified oil into a range of food systems. In addition to their physical stability, oil bodies, ex vivo, carry essential fatty acids and a number of lipophilic bioactives, such as vitamin E and oryzanols, depending on the parent seed.7–9 Sunflower seed oil bodies were selected for this study as they have been well characterised by our group.It is important that any delivery system is capable of delivering the encapsulated bioactive components to the appropriate site of action within the human body. Consequently, it is necessary to understand the potential biological fate of delivery systems within the human gastrointestinal tract. Initial screening experiments of delivery systems are usually carried out using in vitro digestion models designed to simulate the human digestive system. These in vitro methods have been used to evaluate the digestibility and bioaccessibility of a range of micro-nutrients from different food matrices.10–12 Recently, in vitro digestion models have been used to better understand the behaviour of oil bodies under gastrointestinal conditions.13–15 These studies have shown that there are appreciable changes in the interfacial composition, aggregation, and structural organization of oil bodies as they pass through different regions of simulated gastrointestinal tracts.
The composition and structure of oil bodies isolated from plant seeds depends on the nature of the isolation procedure used, e.g., temperature, shear, solvent type, and additive type. Oil bodies consist of a triacylglycerol (TAG) core that is coated by a layer of phospholipids and intrinsic proteins (oleosins). However, they may also contain varying amounts of extraneous proteins e.g. seed storage proteins, that are more loosely attached to the oil body surfaces depending on the isolation procedure. Previously, we studied the in vitro digestibility and bioaccessibility of fatty acids and α-tocopherol from sunflower urea-washed oil body suspensions.16 Washing a crude preparation of oil bodies with urea or sodium bicarbonate removes the extraneous proteins that normally surround oil bodies, but leaves the intrinsic proteins in place. If oil bodies were used in food formulations they would probably be in a crude state (i.e. the preparation would contain both intrinsic and extraneous proteins). In addition, food formulations often contain various other proteins that could interact with the surfaces of oil bodies and alter their surface chemistry. Slowing down the rate of oil droplet digestion can promote satiety, a physiological target for reducing total food intake; the rate of digestion of emulsified lipids is known to depend on the presence of proteins adsorbed to their surfaces, since this influences the accessibility of lipase to the droplet surfaces.17,18 The purpose of this study was therefore to establish if some commonly consumed proteins can protect oil bodies under simulated gastrointestinal conditions. The dairy proteins selected for study are common in the diet and have very distinct interfacial properties that represent the behaviour of a range of protein types in aqueous solution.
2. Materials and methods
2.1. Materials
Dehulled sunflower seeds (high oleate) were purchased from Cargill Ltd. (West Fargo, USA). Whey protein isolate was purchased from Myprotein.co.uk (Cheshire, UK). Sodium caseinate was a gift from industry. Both the whey protein and sodium caseinate powders were over 90% protein, and only 0.25% fat, and 0.17% carbohydrate; the rest of the powder was tightly adsorbed water and ash/minerals. Porcine pepsin (#P7125, activity = 650 units mg−1 of protein calculated using haemoglobin as substrate), porcine pancreatic extract (#L3126, lipase activity = 53 units mg−1 of powder calculated using tributyrin as substrate, and trypsin activity = 2.3 units mg−1 of powder calculated using TAME (p-tolune-sulfonyl-L-arginine methyl ester as substrate), porcine co-lipase and porcine bile extract (#B8631, contains glycine, taurine, conjugates of hydroxycholic acid) were purchased from Sigma Chemical Company (Dorset, UK.). Gastric lipase analogue of fungal origin (F-AP15, activity >150 units mg−1) was obtained from Amano Enzyme Inc. (Nagoya, Japan). All chemicals used for SDS-PAGE analysis were purchased from Bio-Rad (Hercules, USA). Unless otherwise stated, all reagents used were of analytical grade.2.2. Recovery and purification of oil bodies
Oil bodies from sunflower seeds were extracted and purified/washed by the method of Beisson et al. (2001)19 with slight modifications. Sunflower seeds (20 g) were kibbled with liquid nitrogen using coffee grinder (DeLonghi KG40, UK) for 30 seconds. The ground seeds were then added to 200 ml of 0.1 M Tris-HCl buffer (pH 8) containing 1 mM EDTA, and immediately homogenised by a Silverson (L5M, Chesham, UK) at 6000 rpm for 40 seconds. The slurry was filtered through 1 layer of Miracloth and the filtrate centrifuged at 10![[thin space (1/6-em)]](https://www.rsc.org/images/entities/char_2009.gif) 400g (Beckman Coulter J2-21M, Buckinghamshire, UK) for 20 min at 4 °C. The oil body pad was removed from the surface and placed into a clean bottle; these oil bodies produced were classed as the crude oil bodies (COB) and stored until use at 4 °C.
400g (Beckman Coulter J2-21M, Buckinghamshire, UK) for 20 min at 4 °C. The oil body pad was removed from the surface and placed into a clean bottle; these oil bodies produced were classed as the crude oil bodies (COB) and stored until use at 4 °C.
Washed oil bodies (WOB) were obtained by re-suspending the crude oil body pad in 200 ml of a 0.1 M NaHCO3, 1 mM EDTA solution by using a Silverson at 6000 rpm for 10 seconds. The mixture was centrifuged as described above. The upper layer was isolated and washed with 200 ml of a 0.1 M NaHCO3, 1 mM EDTA solution as described above. The isolated upper layer was then washed twice with 1 mM Tris-HCl buffer (pH 8) containing 1 mM EDTA. The oil body pad was stored at 4 °C until use.
2.3. Proximate composition of purified oil body preparations
The moisture content of the oil body cream was determined gravimetrically following vacuum drying at 50 °C for 24 h. The lipid content of the dried oil body preparation (ca. 0.5–1 g) was determined gravimetrically using repeated extraction (3 times in total) with isooctane.9 The protein content of the defatted dried oil bodies was determined using the BCA (bichinconinic acid) assay20 following solubilisation of proteins in 2% sodium dodecyl sulfate (SDS) solution at 90 °C. Bovine serum albumin was used as a protein standard.2.4. Preparation of emulsions
2.5. In vitro digestion model
The in vitro digestion model was modified from Beysseriat et al.,21 Mun et al.,22 Mandalari et al.23 and White et al.16The samples were examined every hour during 4 hours of digestion. The ‘before’ and ‘after’ digestion samples were assessed by size analysis, light microscopy, and ζ-potential.
2.6. Particle size analysis
Emulsion droplet diameter were determined by using a laser light scattering instrument (LS 13 320 Laser Diffraction Particle Size Analyzer, Beckman Coulter, Inc., USA). Samples (1 ml) were introduced into the universal liquid module, and obscuration was maintained at 7% for all samples by dilution with dH2O. The diffraction data were analysed using the Fraunhofer diffraction method. Particles with diameters between 0.3 to 2000 μm were detected. The fundamental size distribution derived from this technique is volume based i.e. reported percentage distribution within a given size category infers the percentage of the total volume of particles in the entire distribution. The particle size measurements are hereby reported as the volume mean diameter: d4,3 = ∑nidi4/∑nidi3, where ni is the number of droplets of diameter di. Each individual particle size measurement was determined from the average of three readings made per sample.2.7. Zeta potential measurements
Oil body emulsions were diluted in dH2O to 0.25% (lipid weight). Diluted emulsions were then injected into the measurement chamber of a particle electrophoresis instrument (Delsa Nano C Particle Analyzer, Beckman Coulter, Inc., USA). The instrument settings used were: temperature = 25 °C; refractive index of dispersant = 1.330; viscosity of dispersant = 0.891 mPa s; relative dielectric constant of dispersant = 79.0; electrode spacing = 50.0 mm. The zeta potential (ζ-potential) was then determined by measuring the direction and velocity of the droplets in an applied electric field from which ζ-potential was calculated using Beckman Software. Each ζ-potential measurement was reported as the average of three readings made per sample.2.8. Imaging oil droplets
2.9. Protein analysis
Protein concentration was determined using the BCA method and equal concentrations of protein samples (20 μl) were mixed with 20 μl of sample buffer (Laemmli buffer (Biorad, UK) + 5% β-mercaptoethanol), and heated at 95 °C for 5 min then cooled on ice. Proteins were resolved by SDS-PAGE using 4–20% polyacrylamide gels (Mini-Protean TGX Gels, 15-well, 15 μl, Bio-Rad, Hercules, USA); gels were positioned within a SE 600 BioRad separation unit and suspended in tank buffer (25 mM Tris, 250 mM Glycine, 0.1% SDS, pH 8.3). Electrophoresis was run at 100 V for 40 min. After electrophoresis, the gel was washed (15 min) once with distilled water then stained (1 hour) with the Imperial Protein Stain (Pierce, Rockford, IL, USA) and destained (8 hours) four times with distilled water. Gels were imaged using a BIO-RAD GS-800 densitometer and images were processed using PDQuest Quantity-one (Bio-Rad, Hercules, USA). Incubation samples were centrifuged (as described above) to isolate the oil droplets (buoyant fraction) from the micellar phase, prior to protein extraction and analysis.2.10. Displacement of intrinsic oil body proteins with bile salts
To analyse the displacement of oleosin on the surface of oil bodies with bile salts, a crude oil body emulsion was subjected to in vitro duodenal digestion conditions as described above, but no enzymes, only bile extract was added into the system, and a control was included in this experiment, where 20 ml of crude oil bodies emulsion was incubated at 37 °C for 2 hours. Incubation samples were centrifuged (as described above) to isolate the oil droplets (buoyant fraction) from the micellar phase, prior to protein extraction and analysis.2.11. Calculation and statistical analysis
All experiments were carried out on triplicate emulsion preparations; statistical analysis was performed by one-way ANOVA and Least Significant Different (LSD) using SPSS 15.0. Assessment of significance was based on a 95% confident limit (P < 0.05). Values are expressed as means ± SD.3. Results and discussion
3.1. Characterisation of oil body-based emulsion droplets during digestion
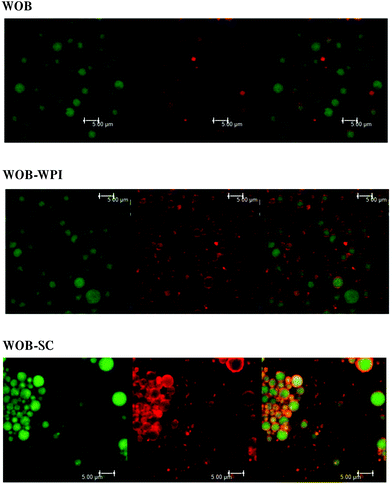
Confocal analysis of WOB and protein enriched WOB preparations, was carried out to make sure that the extra dairy proteins were physically associated with the WOB surface. Fig. 1 shows the location of lipid (green) and that of the proteins (red). Frome these images we can see that WOBs are surrounded by a thin layer of protein, this layer appears to increase in thickness on adding WPI or SC, indicating an association between these added proteins and the surface of the washed oil bodies. Addition of SC appears to generate the thickest protein shell.The composition of the crude oil bodies recovered in this study was approximately 76.2 ± 7.6% lipid and 17.5 ± 0.9% protein (dry weight). The composition of the washed oil bodies was approximately 89.0 ± 9.6% lipid and 3.9 ± 0.8% protein (dry weight). The ζ-potential of crude oil bodies (COB), washed oil bodies (WOB), whey protein isolate-enriched oil bodies (WOB-WPI) and sodium caseinate-enriched oil bodies (WOB-SC) at pH 6.5 were −37.4 ± 8.9, −17.9 ± 4.1, −37.8 ± 1.2 and −59 ± 1.9 mV, respectively (Fig. 2). The negative surface charge on oil bodies can be attributed to the interface consisting of anionic phospholipids24 and protein molecules that were above their isoelectric point at this pH. After adding WPI and SC to WOB, there was a significant increase (P < 0.05) in the negative charge of the oil bodies. This can be explained by WPI and SC adsorbing onto the oil body surfaces thereby increasing their negative charge. Interestingly, the SDS-PAGE profiles of proteins from the protein-enriched washed oil bodies (Fig. 8) show that WPI and SC become associated with WOBs, which is consistent with the our deductions from the surface charge data and from the confocal images.
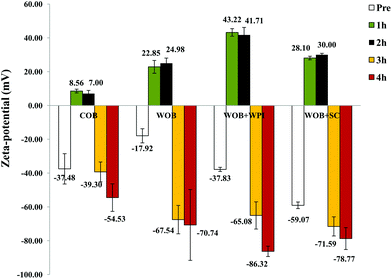 | ||
| Fig. 2 Zeta potential of COB, WOB, WOB-WPI and WOB-SC emulsion; before and during gastrointestinal digestion for 4 hours (1 h and 2 h in gastric condition, 3 h and 4 h in duodenal condition). | ||
The pattern of ζ-potential changes of oil body and protein-enriched oil bodies was similar during digestion. Under gastric conditions (first 2 h) at pH 2.5, the ζ-potential of COB, WOB, WOB-WPI and WOB-SC emulsion droplets changed from negative to positive (+7.0 ± 1.8, +24.9 ± 3.0, +41.7 ± 4.4 and +30.0 ± 0.8 mV, respectively). All emulsion droplets remained positively charged for 2 h during incubation in the gastric model. The charge on the oil droplets after digestion in the small intestine became strongly negative: −54.5 ± 8.1, −70.7 ± 20.9–86.3 ± 3.0 and −78.7 ± 6.4 mV, respectively. Interestingly, the charge associated with the surface of the COB derived droplets in the duodenal conditions was lower than the charge associated with the surface of the droplets in the other oil body-based emulsion preparations. This suggests that the association of bile salts with the surface of the crude oil bodies (and the commensurate displacement of surface proteins) appears less extensive for this case than for the other oil bodies.
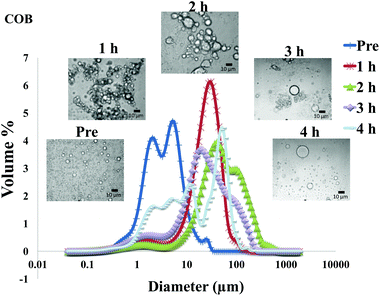
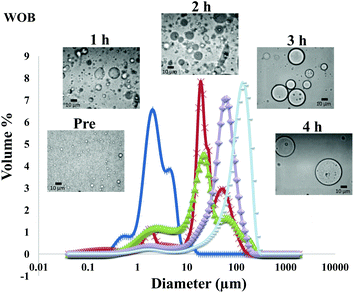
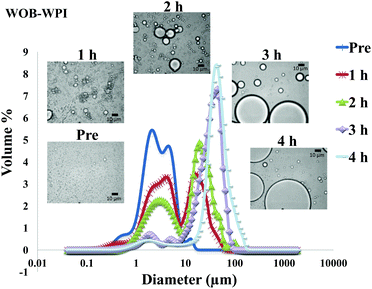
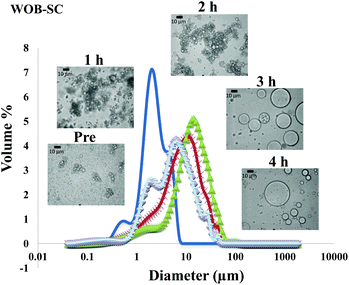
The particle size distribution and optical microscopy images of all oil bodies (COB, WOB, WOB-WPI and WOB-SC) pre- and post-incubation in the in vitro gastric model can be seen in Fig. 3–6. Each oil body emulsion contained droplets of a similar size prior to digestion, but thereafter, significant changes occurred. The mean particle diameters (d4,3) of the WOB, WOB-WPI and WOB-SC emulsion droplets (3.2 ± 0.6, 3.9 ± 1.0 and 2.6 ± 0.1 μm, respectively) were significantly smaller (P < 0.05) than COB (5.6 ± 1.4 μm) prior to incubation in the gastrointestinal model (Fig. 7). During gastric digestion for 2 hours the diameter (d4,3) of all emulsion droplets appeared to increase significantly. After 2 hours digestion in the gastric model followed by two hours incubation in the duodenal model the mean diameter of the particles in the COB emulsions (37.2 ± 26.7 μm) was slightly decreased from gastric model (p > 0.05). However, WOB-SC emulsion droplets (7.8 ± 2.4 μm) decreased significantly (P < 0.05), whereas WOB and WOB-WPI emulsion droplets (104.7 ± 24.3 and 56.9 ± 16.2 μm, respectively) increased significantly in size (P < 0.05). In addition, when digested in duodenal conditions, a shift from a mono-modal distribution to a bi-modal distribution was observed for COB, but not for the other emulsions. The presence of several peaks in the particle size distribution interferes with the measurement of the mean particle diameter of the lipid droplets during digestion. The relatively large standard deviations observed in the particle size distributions are typical of measurements made in highly aggregated emulsion systems and are usually attributed to changes in sample structure induced by dilution and stirring within the light scattering instrument.22
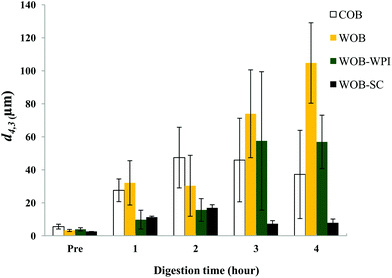 | ||
| Fig. 7 Mean diameter (d4,3) of COB, WOB, WOB-WPI and WOB-SC emulsion before and during gastrointestinal digestion for 4 hours (1 h and 2 h in gastric condition, 3 h and 4 h in duodenal condition). | ||
The particle size analyser cannot distinguish between aggregation and coalescence, and so microscopic observation of the oil body suspensions was carried out to provide further evidence of structural changes. The optical microscopy images revealed changes in system microstructure during incubation in the gastric model. The oil bodies in the COB, WOB-WPI and WOB-SC emulsions were seen to flocculate during the first hour of incubation and then coalesce during the second hour, whereas there was already some coalescence evident during the first hour of incubation in the WOB emulsions. Under duodenal conditions, free oil droplets were clearly observed in WOB and WOB-WPI whereas few free oil droplets were observed in COB and WOB-SC. These observations explain the shift in the particle size data for all emulsions. From these results we can see that in our model system COB behaves similarly to WOB-SC, but there is a marked contrast when compared with WOB and WOB-WPI.
Wu and co-workers (2012)13 demonstrated the partial protective effect of carrageenan at the surface of soybean oil bodies against digestion. Similar to our work, they observed a change in the surface charge of oil bodies during incubation, with a significant negative charge (−70 mV) in the presence of bile salts. This suggests that bile salts associate with the surface of these droplets, either through direct physical association or through displacement of some of the surface material. Their surface area-weighted particle size data (d3,2) suggests that their soybean oil body preparations varied in size that did not change radically during the gastric phase, then developed a broader distribution during the duodenal phase. Micrographs of the same material told a slightly different story with a significant increase in particle size during the gastric phase, this increase being inversely proportional to the amount of carrageenan that was present; the droplets then decreased in size during the duodenal phase. The increase in droplet size under gastric conditions coincided with the loss of oleosin, presumably through the action of pepsin, which was inhibited in the presence of carrageenan.
In a study of the digestion of almond seed oil bodies, Gallier and Singh14 observed that the oil bodies aggregated and coalesced under gastric conditions. During the duodenal phase the measured change in particle size depended on the mode of measurement. The surface area-weighted values d3,2 revealed a reduction in average diameter from 20 μm (immediately after the gastric phase) to 5 μm after 15 minutes and until the endpoint at 120 minutes. On the other hand, d4,3 values revealed an unchanged average diameter for the first 60 minutes of duodenal conditions, followed by a gradual increase to almost 45 μm after a total duodenal incubation of 120 minutes. This is consistent with our data where we used the volume-weighted measure of the average particle size of oil droplets. The change that they have reported in the zeta potential of almond seed oil bodies reflects the change we have seen with our sunflower seed oil bodies. The charge of their almond oil bodies was less than +10 mV after 60 and 120 minutes under gastric conditions, followed by a gradual change in charge to almost −50 mV after 45 minutes, presumably due to the uptake of bile salts under duodenal conditions. Similar effects of bile salts on the surface charge of protein-stabilised emulsion droplets have been reported.25–27 Mun et al.22 studied the changes in the droplet size of emulsions formed with whey proteins compared to an emulsion formed with caseinate after in vitro hydrolysis by pancreatic lipase at pH 7. They reported that in their conditions whey protein isolate emulsions are the least stable. Based on microscopic observations, the caseinate stabilised emulsions were more prone to flocculation rather than coalescence whereas the whey protein stabilised emulsions were highly prone to coalescence, which is consistent with our observations.
WPI and SC are milk proteins commonly used as food ingredients because of their surface active properties. Whey protein and caseinate produce an interfacial film with different properties,28 notably with different adsorption and surface rheological behaviours.29,30 In brief, the globular β-lactoglobulin forms a highly elastic interfacial film, whereas β-casein forms a weaker interfacial film, but the charged N-terminal region provides excellent steric stabilization. In other words, β-casein is a flexible/‘soft’ protein, which changes its conformation more easily than β-lactoglobulin which is a ‘hard’, globular protein.31 As a consequence, β-casein can be displaced from an interface much more readily than β-lactoglobulin. This rule of thumb is clearly less reliable in a system complicated by enzymic action and pH changes.
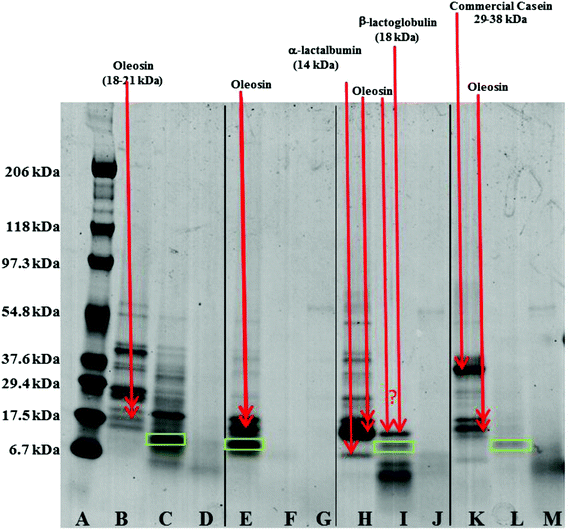
Oil droplets were recovered from the incubation systems by centrifugation, just after the gastric and duodenal phases. The proteins still associated with their surfaces were studied by SDS-PAGE (Fig. 8). Loss of bands indicates removal of proteins from the surface, and/or digestion (full or partial); new bands indicate remnant protein fragments, left behind after partial protein digestion, which remain associated with the droplet surface. For the oil bodies, the loss of the oleosin band (∼18–21 kDa) during digestion in the gastric model, and the appearance of protein fragments either between 6.7 and 17.5 kDa, or less than 6.7 kDa, indicates the breakdown of oleosin into small peptides that appear to remain bound to/associated with the oil droplets. Oleosin has three functional motifs: an amphipathic N-terminal region, a central hydrophobic antiparallel β-strand domain and an amphipathic C-terminal domain with variable length.2 It is likely that the protruding part of the oleosin molecule, which provides a strengthened layer on the surface, is susceptible to enzymatic cleavage and leads to the weakening and consequential coalescence of oil bodies. Pepsin hydrolyses peptide bonds at the N-terminus of aromatic residues.32 Given the amino acid sequence of oleosin protein in sunflower seed, there are eleven potential sites of pepsin action, and 4 of these peptide bonds are within the exposed domains of oleosin on the surface of oil bodies.33–35
Qualitative examination of protein molecular weights in COB reveals a general degradation of proteins resulting in an increase in the number of bands between 6.7 to 17.5 kDa after incubation in the gastric model (lane B and C). The major band in this region has been highlighted with a green box in Fig. 8; this band may represent the hydrophobic domain (and associated residual hydrophilic domain ‘stumps’) of oleosin, left behind securely anchored in the oil phase after the action of pepsin on the exposed hydrophilic domains.
One unique feature of the COB data is that some ‘complete’ oleosin also appears to remain after the initial gastric phase of digestion. Perhaps the extraneous proteins (that we have already suggested shield the surface of the oil bodies and so affect the apparent surface charge), protect exposed oleosin domains from digestion to some extent. It could be argued that a similar protection of oleosin is afforded by extraneous almond proteins during gastric incubation.14 This shielding from enzyme activity is not apparent for WPI and SC enriched WOB material. Interestingly, protein breakdown was much more efficient in the WOB emulsion as no protein bands were seen on the protein gel after the gastric conditions (2 hours). This suggests that all the proteins were degraded and/or removed from the surface of the droplets (compare lane E with lane F). It is worth noting that the WOB material used for this study contained a protein, not observed in the parent COB material, that coincides with the putative ‘oleosin hydrophobic domain’ band. This protein fragment may be present on all the parent COB and WOB samples (or is an artefact of sample preparation for SDS-PAGE analysis), but is only observed when its loading concentration effectively increases through removing extraneous proteins during the oil body washing phase, or some proteolytic activity was present in the sample (perhaps due to an endogenous enzyme). If the latter explanation is correct, then one may speculate that if the COB material is left for any time (even chilled) before washing, then such a transformation may be possible.
For both WOB-WPI and WOB-SC emulsions (lanes H and I and lanes K and L) incubation in the gastric model resulted in a general protein breakdown/loss, but less dramatic compared with WOB, as protein bands are still clearly visible (lanes I and L). This is even more marked in WOB-WPI compared with WOB-SC. As was the case for COB emulsions, there is a suggestion that after the gastric phase, the exposed domains of oleosin in these protein-enriched WOB emulsions have been removed through digestion, leaving a residual protein composed predominantly of the hydrophobic domain. Protein breakdown/loss continued for all the emulsions with a clear reduction in the molecular weight of all the remaining peptides (lane D, G, J and M). In the case of WOB-WPI, it is possible that after 2 hours under gastric conditions some β-lactoglobulin remains intact, but its molecular weight coincides with one of the oleosin isoforms, so it is not possible, with the current data, to stipulate categorically whether at least a proportion of one or the other protein (or both) survive the gastric phase; taken overall, the SDS-PAGE data provides a stronger case for the retention of some of the β-lactoglobulin.
Whey protein is a complex mixture of different proteins: ca. 55% β-lactoglobulin (18.4 kDa), 24% α-lactalbumin (14.2 kDa), 5% serum albumin (66.2 kDa) and 15% immunoglobulins (90 kDa). SDS-PAGE (lane I) of WOB-WPI digested in the gastric model, suggest breakdown/loss of α-lactalbumin but possible retention of the β-lactoglobulin protein under these conditions, implying specificity of the action of the pepsin enzyme. This breakdown of protein in WPI is consistent with previous studies.13,36–38 Beta-lactoglobulin in its native form has indeed been recognised to be resistant to hydrolysis in the gastric phase.39 However, when a change in conformation occurs, such as during adsorption to the oil–water interface, the protein becomes susceptible to pepsin hydrolysis.38 For WOB-SC, sodium caseinate contains the four main caseins; β-casein (23 kDa), αs1-casein (24 kDa), αs2-casein (25 kDa) and κ-casein (19 kDa) in the ratios 3![[thin space (1/6-em)]](https://www.rsc.org/images/entities/char_2009.gif) :
:![[thin space (1/6-em)]](https://www.rsc.org/images/entities/char_2009.gif) 4
4![[thin space (1/6-em)]](https://www.rsc.org/images/entities/char_2009.gif) :
:![[thin space (1/6-em)]](https://www.rsc.org/images/entities/char_2009.gif) 1
1![[thin space (1/6-em)]](https://www.rsc.org/images/entities/char_2009.gif) :
:![[thin space (1/6-em)]](https://www.rsc.org/images/entities/char_2009.gif) 1, respectively. However, the commercial SC was mainly composed of polypeptides with their MW within range of 29.4 to 37.6 kDa (lane K). This was slightly higher than the MW of caseins (19–25 kDa) due to the polymerization of proteins during commercial processing. SDS-PAGE (lane L) of WOB-SC digested in the gastric model, suggest complete breakdown of oleosin in WOB and all polypeptides in SC. This breakdown of caseins by protein hydrolysis in gastric conditions is in agreement with the previous studies.40–42
1, respectively. However, the commercial SC was mainly composed of polypeptides with their MW within range of 29.4 to 37.6 kDa (lane K). This was slightly higher than the MW of caseins (19–25 kDa) due to the polymerization of proteins during commercial processing. SDS-PAGE (lane L) of WOB-SC digested in the gastric model, suggest complete breakdown of oleosin in WOB and all polypeptides in SC. This breakdown of caseins by protein hydrolysis in gastric conditions is in agreement with the previous studies.40–42
Finally, there is a clear reduction in the intensity of protein bands in all emulsions after the duodenal digestion (lane D, G, J and M). This confirms the presence of active proteases in the porcine pancreatic extract. This agrees with Singh et al.43 who reported that commercial pancreatic lipase from Sigma-Aldrich company causes the breakdown of protein in a β-lactoglobulin-stabilised emulsion.
3.2. Protein composition of oil bodies after treatment with bile salts
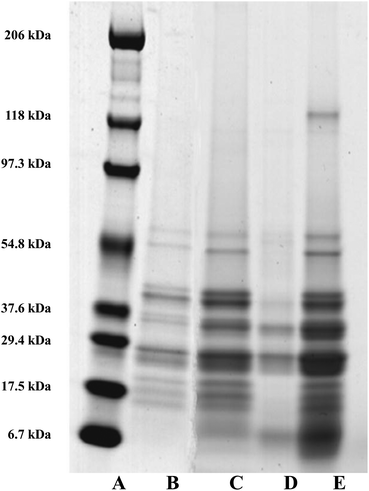
As mentioned earlier, the dominant intrinsic protein associated with the surfaces of the oil bodies are the oleosins.3,44 Oleosins from diverse species range in molecular weight (MW) from approximately 15 to 26 kDa.44 The exact sizes of the different isoforms vary from one plant to another, for example 16 and 18 kDa in maize, 18 and 24 kDa in soybean and 18 and 21 kDa in sunflower seeds.45 Work was carried out to establish if bile salts were capable of displacing oleosin from a preparation of crude oil bodies. Bile salts can absorb onto and remove other materials e.g. proteins and emulsifier from the lipid surface.17 Maldonado-Valderrama et al.18 reported that the bile salts can almost completely displace the intact protein β-lactoglobulin network under duodenal conditions. It is not yet known if intrinsic oil body proteins are displaced by bile salts or not. Fig. 9 shows the protein profile of the micellar phase removed after incubation of crude oil bodies (COB) with bile salts (lane E). This profile is similar to the protein profile of the control COB (no bile salts) after 2 h incubation but before phase separation (lane C); whereas there were only a few proteins in the micellar phase of the COB control after incubation (lane D). These results suggests that almost all the surface proteins of oil bodies, including oleosin, were displaced by bile salts. Interestingly, the data also show that the pattern of protein bands in COB control after incubation is similar to the pre-incubation profile (lane C compared to lane B). However, there are small molecular weight protein bands (between 6.7 and 17.5 kDa) accumulating in the COB control after incubation (lane C). This observation suggests that there is some breakdown of proteins in this sample; the crude oil body preparation may contain some carry-over enzymes with proteolytic activity, but this effect seems almost negligible. These results show the potential of bile salts to displace proteins at the surface of oil bodies, even well-anchored proteins such as oleosin. Whether bile salts could effect this displacement if oleosin was reduced to the hydrophobic domain after gastric digestion is not clear from this work; it has been suggested that such a remnant, if it exists, could affect the rate of lipase digestion in the duodenum.144. Conclusions
Sunflower seed oil bodies have the capacity to associate with extraneous proteins including whey protein isolates and casein proteins. This extraneous protein environment surrounding oil bodies affects the apparent surface charge and stability of oil bodies, which may have important consequences for the commercial application of oil bodies as delivery systems in foods. The proteins associated with the surface of the sunflower oils bodies studied (crude, or washed, or washed and enriched with WPI or casein) are, to a greater or lesser extent, hydrolysed and/or removed from the surface during simulation of gastro-intestinal conditions, causing significant changes in the morphology of the droplets. Sunflower seed proteins not intrinsic to oil bodies (present in COB), and caseinate (present in WOB-SC) both appear to cause flocculation of droplets in the gastric phase, whereas WOB and WOB-WPI display more coalescence than flocculation at this stage. Although it is clear that bile salts dominate the surface of all the droplets in the duodenal phase of digestion, COB and WOB-SC yield smaller droplets in the duodenal phase of the digestion model employed, compared with WOB or WOB-WPI. This may have an effect on the rate of triacylglycerol digestion. The reason for these differences in droplet size is not entirely clear, but is should be pointed out that the competing dynamics of bile salt insertion into the surface of the droplets emerging from the gastric phase, and their tendency to coalesce will affect the size of the droplets throughout that phase. We have evidence that bile salts are able to displace oleosin. It may therefore be possible that the extraneous seed proteins are protecting the oleosin during the gastric phase, thus restricting the droplet size during bile salt insertion. These results may have important implications for the design of functional food products that control the digestion and release of lipids from oil body-based delivery systems.Abbreviations
| BCA | Bichinconinic acid |
| COB | Crude oil bodies |
| dH2O | Deionized water |
| PL | Phospholipids |
| SDS | Sodium dodecyl sulphate |
| SDS-PAGE | Sodium dodecyl sulphate-polyacrylamide gel electrophoresis |
| TAG | Triacylglycerol |
| WOB | Washed oil bodies |
| WOB-SC | Sodium caseinate enriched oil bodies |
| WOB-WPI | Whey protein isolate enriched oil bodies |
| ζ-potential | Zeta potential |
Acknowledgements
The Royal Thai government is acknowledged for the financial support of this research.References
- J. T. C. Tzen, Y. Z. Cao, P. Laurent, C. Ratnayake and A. H. C. Huang, Plant Physiol., 1993, 101, 267–276 CAS.
- J. T. C. Tzen, G. C. Lie and A. H. C. Huang, J. Biol. Chem., 1992, 267, 15626–15634 CAS.
- J. T. C. Tzen and A. H. C. Huang, J. Cell Biol., 1992, 117, 327–335 CrossRef CAS.
- F. Beisson, N. Ferte and G. Noat, Biochem. J., 1996, 317, 955–956 CAS.
- P. J. E. Thoyts, J. A. Napier, M. Millichip, A. K. Stobart, W. T. Griffiths, A. S. Tatham and P. R. Shewry, Plant Sci., 1996, 118, 119–125 CrossRef CAS.
- D. J. Lacey, N. Wellner, F. Beaudoin, J. A. Napier and P. R. Shewry, Biochem. J., 1998, 334, 469–477 CAS.
- I. D. Fisk, D. A. White, A. Carvalho and D. A. Gray, J. Am. Oil Chem. Soc., 2006, 83, 341–344 CrossRef CAS PubMed.
- N. Nantiyakul, S. Furse, I. D. Fisk, T. J. Foster, G. Tucker and D. A. Gray, J. Am. Oil Chem. Soc., 2012, 89(10), 1867–1872 CrossRef CAS.
- D. A. Gray, G. Payne, D. J. McClements, E. A. Decker and M. Lad, Eur. J. Lipid Sci. Technol., 2010, 112(7), 741–749 CrossRef CAS.
- D. A. Garrett, M. L. Failla and R. J. Sarama, J. Agric. Food Chem., 1999, 47, 4301–4309 CrossRef CAS PubMed.
- E. Hedren, V. Diaz and U. Svanberg, Eur. J. Clin. Nutr., 2002, 56, 425–430 CrossRef CAS PubMed.
- D. D. Miller, B. R. Schricker, R. R. Rasmussen and D. Vancampen, Am. J. Clin. Nutr., 1981, 34, 2248–2256 CAS.
- N. Wu, X. Huang, X.-Q. Yang, J. Guo, S.-W. Yin, X.-T. He, L.-J. Wang, J.-H. Zhu, J.-R. Qi and E.-L. Zheng, J. Agric. Food Chem., 2012, 60, 1567–1575 CrossRef CAS PubMed.
- S. Gallier and H. Singh, Food Funct., 2012, 3, 547–555 CAS.
- S. Gallier, H. Tate and H. Singh, J. Agric. Food Chem., 2013, 61, 410–417 CrossRef CAS PubMed.
- D. A. White, I. D. Fisk, S. Makkhun and D. A. Gray, J. Agric. Food Chem., 2009, 57, 5720–5726 CrossRef CAS PubMed.
- J. Maldonado-Valderrama, P. Wilde, A. Macierzanka and A. Mackie, Adv. Colloid Interface Sci., 2011, 165, 36–46 CrossRef CAS PubMed.
- J. Maldonado-Valderrama, N. C. Woodward, A. P. Gunning, M. J. Ridout, F. A. Husband, A. R. Mackie, V. J. Morris and P. J. Wilde, Langmuir, 2008, 24, 6759–6767 CrossRef CAS PubMed.
- F. Beisson, N. Ferte, R. Voultoury and V. Arondel, Plant Physiol. Biochem., 2001, 39, 623–630 CrossRef CAS.
- P. K. Smith, R. I. Krohn, G. T. Hermanson, A. K. Mallia, F. H. Gartner, M. D. Provenzano, E. K. Fujimoto, N. M. Goeke, B. J. Olson and D. C. Klenk, Anal. Biochem., 1985, 150, 76–85 CrossRef CAS.
- M. Beysseriat, E. A. Decker and D. J. McClements, Food Hydrocolloids, 2006, 20, 800–809 CrossRef CAS PubMed.
- S. Mun, E. A. Decker and D. J. McClements, Food Res. Int., 2007, 40, 770–781 CrossRef CAS PubMed.
- G. Mandalari, R. M. Faulks, G. T. Rich, V. Lo Turco, D. R. Picout, R. B. Lo Curto, G. Bisignano, P. Dugo, G. Dugo, K. W. Waldron, P. R. Ellis and M. S. J. Wickham, J. Agric. Food Chem., 2008, 56, 3409–3416 CrossRef CAS PubMed.
- G. Payne, M. Lad, T. Foster, A. Khosla and D. A. Gray, Colloids Surf., B, 2014, 116, 88–92 CrossRef CAS PubMed.
- A. Sarkar, K. K. T. Goth, R. P. Singh and H. Singh, Food Hydrocolloids, 2009, 23, 1563–1569 CrossRef CAS PubMed.
- M. Golding, T. J. Wooster, L. Day, M. Xu, L. Lundin, J. Keogh and P. Clifton, Soft Matter, 2011, 7, 3513–3523 RSC.
- J. Li, A. Ye, S. J. Lee and H. Singh, Food Funct., 2012, 3, 320–326 CAS.
- J. N. de Wit, J. Dairy Sci., 1998, 81, 597–608 CrossRef CAS.
- M. Bos and T. van Vliet, Adv. Colloid Interface Sci., 2001, 91, 437–471 CrossRef CAS.
- J. R. Mitchell, Dev. Food Proteins, 1986, 4, 291–338 CAS.
- T. Arai and W. Norde, Colloids Surf., 1990, 51, 1–15 CrossRef CAS.
- J. S. Fruton, S. Fujii and M. H. Knappenberger, Proc. Natl. Acad. Sci. U. S. A., 1961, 47, 759–761 CrossRef CAS.
- J. C. F. Chen and J. T. C. Tzen, Plant Cell Physiol., 2001, 42, 1245–1252 CrossRef CAS PubMed.
- M. Li, D. J. Murphy, K. H. K. Lee, R. Wilson, L. J. Smith, D. C. Clark and J. Y. Sung, J. Biol. Chem., 2002, 277, 37888–37895 CrossRef CAS PubMed.
- S. Vandana and S. C. Bhatla, Plant Physiol. Biochem., 2006, 44, 714–723 CrossRef CAS PubMed.
- D. G. Schmidt and B. W. Vanmarkwijk, Neth. Milk Dairy J., 1993, 47, 15–22 CAS.
- N. Kitabatake and Y. I. Kinekawa, J. Agric. Food Chem., 1998, 46, 4917–4923 CrossRef CAS.
- A. Malaki Nik, A. J. Wright and M. Corredig, J. Colloid Interface Sci., 2010, 344, 372–381 CrossRef CAS PubMed.
- I. M. Reddy, N. K. D. Kella and J. E. Kinsella, J. Agric. Food Chem., 1988, 36(4), 737–74138 CrossRef CAS.
- A. Macierzanka, A. I. Sancho, E. N. C. Mills, N. M. Rigby and A. R. Mackie, Soft Matter, 2009, 5, 538–550 RSC.
- M. R. Guo, P. F. Fox, A. Flynn and P. S. Kindstedt, J. Dairy Sci., 1995, 78, 2336–2344 CrossRef CAS.
- M. Defernez, G. Mandalari and E. N. C. Mills, Electrophoresis, 2010, 31, 2838–2848 CrossRef CAS PubMed.
- H. Singh, A. Ye and D. Horne, Prog. Lipid Res., 2009, 48, 92–100 CrossRef CAS PubMed.
- A. H. C. Huang, Annu. Rev. Plant Physiol., 1992, 43, 177–200 CrossRef CAS.
- J. T. C. Tzen, Y. K. Lai, K. L. Chan and A. H. C. Huang, Plant Physiol., 1990, 94, 1282–1289 CrossRef CAS PubMed.
| This journal is © The Royal Society of Chemistry 2015 |

