 Open Access Article
Ecotoxicity studies of glycerol ethers in Vibrio fischeri: checking the environmental impact of glycerol-derived solvents†
J. I.
García
*a,
E.
Pires
ab,
L.
Aldea
c,
L.
Lomba
c,
E.
Perales
c and
B.
Giner
*c
aInstituto de Síntesis Química y Catálisis Homogénea (ISQCH). Facultad de Ciencias. CSIC-Universidad de Zaragoza, C/Pedro Cerbuna, 12, E-50009 Zaragoza, Spain. E-mail: jig@unizar.es
bDept. Organic Chemistry, Facultad de Ciencias, Univ. de Zaragoza, Pedro Cerbuna, 12, E-50009 Zaragoza, Spain
cFacultad de Ciencias de la Salud, Universidad San Jorge, Villanueva de Gállego, E-50830, Zaragoza, Spain
First published on 15th June 2015
Abstract
The toxicities of a series of glycerol mono-, di-, and trialkyl ethers against Vibrio fischeri bacteria have been determined. A systematic study has been carried out and the possible structure–toxicity relationships have been discussed using different QSAR models. Inhibition of bioluminescence after 30 minutes of exposure shows relatively low toxicity of many of the glycerol derived chemicals studied. Results indicate that, as a general rule, the ecotoxicity increases with the length and number of substituents. However, if the size of the molecule increases, an extra substituent at position 2 makes the toxicity lower than that of the corresponding analogues.
Introduction
The search for new solvents, coming from new sources and/or able to provide special features (often known as neoteric solvents), is a field of growing interest, especially in connection with the possibility of using renewable raw materials to produce harmless solvents, more respectful with the environment than those derived from petroleum (the so-called green solvents).1 In this context, biomass-derived chemicals have attracted a great deal of attention in the last few years, in connection with the development of the biorefinery concept. Agricultural and some industrial activities are able to generate huge amounts of raw materials, capable of being used to produce commodity and fine chemicals.2 In this sense, glycerol is one of the platform molecules that has received much attention in recent years.3–5 Glycerol appears as a concomitant product in the production of biodiesel, amounting to ca. 10% weight of the total output. At present, the world production of glycerol coming from vegetable oil transformations surpasses 2 million metric tons, so it constitutes a valuable starting point to obtain bio-based chemicals, useful as, for instance, solvents.6–9Our research group10–14 and others15–18 have described the synthesis and application as solvents of glycerol ethers. These kinds of solvents have the additional advantage of being much more chemically inert than other glycerol-derived solvents, such as esters, acetals or carbonates. Some of these glycerol ethers, namely those bearing fluoroalkyl chains, exhibited special physical–chemical features, in some way similar to those displayed by some ILs: high polarity, low vapour pressure at room temperature, and immiscibility with both hydrocarbons and water. The most prominent example of these compounds is 1,3-bis(2,2,2-trifluoroethoxy)propan-2-ol, which can be efficiently prepared from trifluoroethanol and epichlorohydrin (a commodity chemical currently produced from glycerol using the Solvay procedure).12 Other authors have also recognized the special characteristics of these new fluorinated solvents.19
Apart from this particular case, glycerol ethers have a high potential for chemical diversity, given that mono-, di, and trialkylation, either symmetrical or unsymmetrical at positions 1 and 3, leads to 1,2-diols, alcohols and trialkyl ethers. These possibilities allow tuning important solvent properties, such as polarity, hydrogen-bonding ability, hydrophobicity or viscosity. Some QSPR studies have been conducted to develop models able to predict some key physical–chemical properties of glycerol ethers, prior to their synthesis.20
Concerning the greenness of glycerol-derived solvents, not only their renewable origin must be taken into account, but also other aspects of their life cycle, including their fate and the consequences on the environment. Being solvents coming from glycerol and short chain alkyl alcohols, which can in turn be obtained from biomass to a large extent, the low toxicity of glycerol ethers is generally taken for granted. The pertinent question arises, however, as to whether this family of solvents can be considered environmentally benign or not, given the lack of systematic experimental evidence for its toxicity and ecotoxicity.
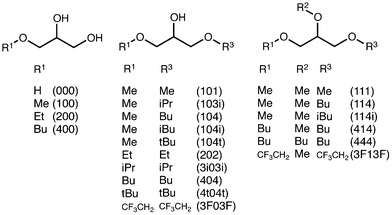
In this paper, we present our first results on the ecotoxicity of a series of glycerol-derived ethers. In this case, we have studied the inhibition of the bioluminescence of Vibrio fischeri (V. fischeri) bacteria. This bioindicator has been frequently used,21,22 since it is a well-known organism and operating protocols are standardized. Inhibition bioluminescence tests offer robust, easy handling and cost-effective responses.23 Finally, this study provides some clues to the structure–toxicity relationships found in the studied solvent set (Fig. 1). This solvent set, though not quite large, has been chosen to cover a wide range of structural and physical–chemical features, such as the number of free hydroxyl groups, length and ramification of the alkyl chains, hydrophobicity, solubility in water, and the presence of fluorinated groups, among others.
Results and discussion
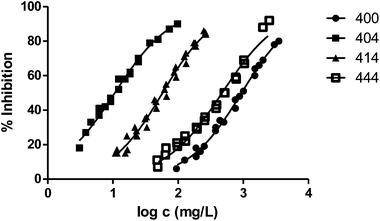
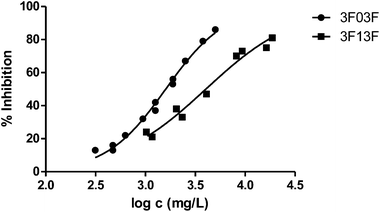
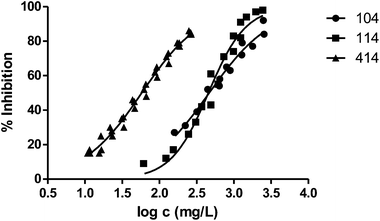
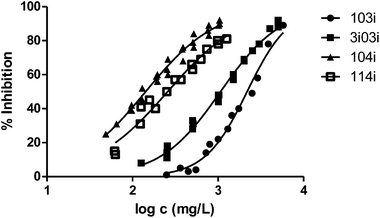
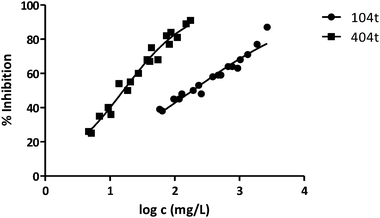
EC50 values obtained in the biotests using V. fischeri, with their respective adjustable parameters and standard deviations, are gathered in Table 1. Furthermore, results are graphically represented in Fig. 2–9.‡| Solvent code | EC50 (mg L−1) | a | b | SD |
|---|---|---|---|---|
| 000 | 108![[thin space (1/6-em)]](https://www.rsc.org/images/entities/char_2009.gif) 421 421 |
0.01544 | 0.09568 | 4.791 |
| 100 | 21![[thin space (1/6-em)]](https://www.rsc.org/images/entities/char_2009.gif) 052 052 |
0.01698 | 0.05195 | 3.587 |
| 200 | 4240 | 0.01333 | 0.05534 | 3.910 |
| 400 | 941 | 0.00873 | 0.02610 | 1.839 |
| 101 | 13![[thin space (1/6-em)]](https://www.rsc.org/images/entities/char_2009.gif) 702 702 |
0.01795 | 0.10270 | 3.798 |
| 111 | 969 | 0.01655 | 0.10070 | 4.003 |
| 202 | 1215 | 0.02520 | 0.07998 | 4.082 |
| 404 | 11 | 0.00777 | 0.01893 | 1.831 |
| 114 | 453 | 0.01967 | 0.13460 | 5.365 |
| 104 | 464 | 0.02099 | 0.06516 | 3.468 |
| 414 | 58 | 0.01066 | 0.03351 | 2.937 |
| 444 | 473 | 0.01796 | 0.04461 | 3.564 |
| 103i | 2188 | 0.01553 | 0.10940 | 3.764 |
| 104i | 142 | 0.01280 | 0.03896 | 2.876 |
| 3i03i | 1064 | 0.00980 | 0.03596 | 2.523 |
| 114i | 258 | 0.02083 | 0.05875 | 3.905 |
| 104t | 189 | 0.03629 | 0.03283 | 3.391 |
| 404t | 16 | 0.02154 | 0.04298 | 3.544 |
| 3F03F | 1597 | 0.01006 | 0.05688 | 2.375 |
| 3F13F | 4033 | 0.02849 | 0.06963 | 3.845 |
As far as we know, there is no previous experimental ecotoxicological information on any of the studied glycerol derivatives. Regarding glycerol itself (000), there are no experimental data of ecotoxicity in V. fischeri. However, previous studies indicate that glycerol is of low toxicity towards microorganisms; in a 16 hour test with Pseudomonas putida no inhibition of bacterial growth was found at concentrations between 100 and 10![[thin space (1/6-em)]](https://www.rsc.org/images/entities/char_2009.gif) 000 mg L−1 (ref. 24 and 25) and similar results are found for other microorganisms such as Entosiphon sulcatum or Clostridium sp.26,27 This information supports the conclusion that, overall, glycerol is of low toxicity to microorganisms. In this study, EC50 of glycerol for V. fischeri is higher than 100
000 mg L−1 (ref. 24 and 25) and similar results are found for other microorganisms such as Entosiphon sulcatum or Clostridium sp.26,27 This information supports the conclusion that, overall, glycerol is of low toxicity to microorganisms. In this study, EC50 of glycerol for V. fischeri is higher than 100![[thin space (1/6-em)]](https://www.rsc.org/images/entities/char_2009.gif) 000 mg L−1, indicating the low toxicity of this chemical for this bioindicator.
000 mg L−1, indicating the low toxicity of this chemical for this bioindicator.
In view of the results, ecotoxicity of the studied solvents is higher than that of glycerol in all the cases. However, taking into account the results obtained for the bioindicator V. fischeri, only a few solvents can be considered hazardous for the environment. According to the Passino and Smith classification,28 just 404, 404t and 414 are slightly harmful, while 111, 104, 114, 444, 104i, 114i and 104t can be considered practically harmless. The rest of the studied solvents (100, 200, 400, 101, 202, 103i, 3i03i, 3F03F, 3F13F) are clearly harmless for the environment.
Although the action mechanism is still unidentified, it is known that bacterial bioluminescence reactions are coupled to the electron transport system in cellular respiration. Consequently, bioluminescence reactions are indicative of cellular metabolism; i.e., lower bioluminescence implies a decreased cellular respiration. Thus, the presence of the studied solvents in the culture medium affects, to a greater or lesser extent, the cellular respiration by the modification of both lipid and protein biosynthetic pathways and therefore alters the bioluminescence emission.29
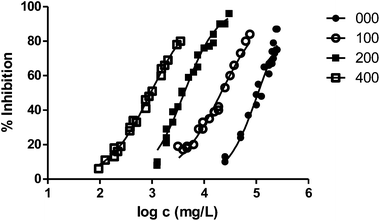
In general, the alteration of the bioluminescence emission and thus the ecotoxicity increases with the length of the radical. This trend can be easily observed in Fig. 2, where we show the results obtained for the series 000–100–200–400 and the ecotoxicity for V. fischeri increases substantially with the length of the substituent at position 1.
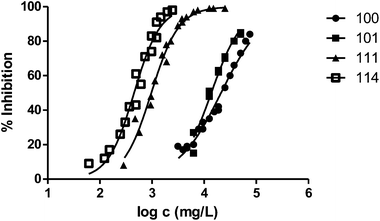
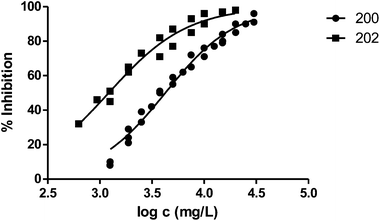
The presence of a substituent at position 3 makes toxicity for V. fischeri higher compared with the corresponding analogous solvent. This is the case of the pairs 100–101, 200–202 and 400–404, whose behaviour is illustrated in Fig. 3–5 respectively.
Fig. 3 shows the representation of the 100–101–111–114 series. Results indicate that toxicity increases with the length of the alkyl chain and also with the number of substituents, independently of the position of the radical. However, if the size of the molecule increases, an extra substituent at position 2 makes the toxicity lower than the corresponding analogues. Fig. 5, 6 and 8 exemplify this behaviour. For example, the toxicity for 404 is ca. 5 times higher than 414, while for 3F03F is ca. 2.5 times higher than 3F13F.‡ It is worth mentioning that in the case of the pairs 104–114 and 104t–114t when the molecular size is between that of 101–111 and 404–414, the ecotoxicological behaviour is quite similar and the extra radical at position 2 seems to affect only slightly the toxicity (Fig. 7 and 8).
Finally, to analyse the effect of the structure of the substituents, we have studied derivatives with branched radicals. The obtained results are graphically represented in Fig. 8 and 9. Once again, the higher the size of radicals, the higher the ecotoxicity, in the case of both iso- and tert-substituents.
In Table 2, V. fischeri ecotoxicity data of a selection of some conventional solvents and ionic liquids (ILs) are shown for comparative purposes.30–33 Ecotoxicity of most of the studied glycerol derivatives is smaller than that of some traditional solvents, such as toluene or phenol. Smaller compounds (100, 200 or 101) show values of EC50 similar to those of low molecular weight alcohols (methanol, ethanol or propan-2-ol) or acetone, known for being innocuous for V. fischeri. Only glycerol derivatives with large substituents (404, 414 and 404t) are as ecotoxic as o-xylene or phenol, which are solvents traditionally known for being toxic for the environment.
| Ionic liquids | |
|---|---|
| 1-Methyl-3-propylimidazolium tetrafluoroborate | 185032 |
| 1-Pentyl-3-ethylimidazolium tetrafluoroborate | 35033 |
| 1-Butyl-3-ethylimidazolium tetrafluoroborate | 15132 |
| 1-Butylpyridinium dicyanamide | 9833 |
| 1-Heptyl-3-methylimidazolium tetrafluoroborate | 7432 |
| 1-Ethyl-3-hexylimidazolium tetrafluoroborate | 3832 |
| 1-Methyl-3-octylimidazolium tetrafluoroborate | 732 |
| 1-Hexyl-3-methylpyridinium bromide | 233 |
Regarding the comparison with ILs, it is interesting to note that ionic liquids have been catalogued as “green solvents” in several occasions,34,35 although the toxicity of a number of them is quite high to V. fischeri and many other bioindicators.36 Our solvents are generally very eco-friendly from the ecotoxicity point of view than the selected ILs, independently of the cation (Table 2); only in the case of ILs with small substituents, toxicity is comparable to the vast majority of the studied glycerol-derived solvents.
However, it should be mentioned that the comparison made regarding the toxicity of glycerol-derived chemicals and some other solvents is limited to only one bioindicator, V. fischeri, in this case. Furthermore, to completely assess the greenness of the studied compounds, not only ecotoxicity data have to be taken into account; the analysis and evaluation of some other important properties such as bioavailability or biodegradability would change this first approach. Finally, the whole lifecycle of the product: production processes, uses and applications, removal rate in depuration processes, the final fate and toxicity of degradation products, are some parameters that should also be taken into account to determine definitively the environmental properties of the solvents.
Quantitative structure–activity relationships
To carry out a deeper analysis of the quantitative relationships between the molecular structure and the measured ecotoxicity, we use the same QSAR approaches previously applied to some physical–chemical properties of a larger family of glycerol-derived solvents.20The first part of a QSAR study is to choose the quantitative description of the molecular structure. To this end, we used two different approaches: local structure descriptors and global structure descriptors. In the first ones, each descriptor indicates the presence or absence of a group of atoms at a given molecular position. As in our previous study, we used the DARC-PELCO approach,37 following the definition shown in Fig. 10.
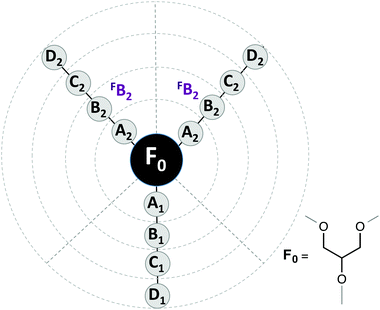 | ||
| Fig. 10 DARC/PELCO scheme used to describe the molecular structures of the glycerol-derived solvents. | ||
The DARC/PELCO method is particularly suitable for studying families of compounds with a common chemical substructure, and is based on the exhaustive generation of all possible substitution sites around the reference structure (F0)—corresponding to the glycerol skeleton common to all ethers—and the evaluation of their contribution to the property. In this definition we have incorporated the symmetry of the glycerol derivatives used, by assuming that the contributions of groups occupying equivalent positions (i.e. those linked to carbons 1 and 3 of the glycerol moiety) will display the same influence on the property under study. Previous studies have demonstrated that this simplification does not alter the results of the regression analyses.20
The second approach to molecular codification is the use of topological parameters,38,39 which are easily derived from the connectivity and adjacency matrices of each compound. The number of connected components of a graph is a topological invariant that measures the number of structurally independent or disjoint subnetworks. These parameters are excellent descriptors of molecular size, shape and flexibility. They are global parameters in the sense that the whole molecular structure is condensed in a single number. The full list of DARC-PELCO and topological descriptors used in the QSAR analyses is available in the ESI.†
The second part of the QSAR analysis consists in relating the dependent variable (ecotoxicity) with the independent ones (the molecular descriptors), through a quantitative model, derived in most cases from a least-squares fit. In our case, we used Multiple Linear Regression (MRL) analysis, whose detailed description has already been given elsewhere.20
We started by applying the MLR analysis to the DARC-PELCO model. Given that not all the molecular descriptors have to be statistically relevant to the final equation, we used a stepwise procedure for variable selection. The final regression equation derived was the following:
 | (1) |
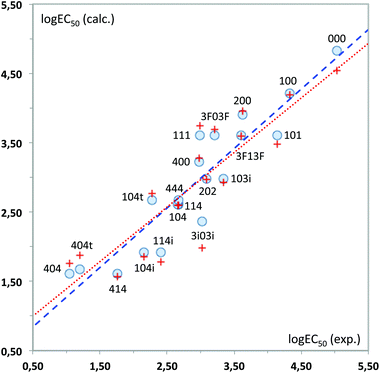
As can be seen, the model fits fairly well the experimental data of ecotoxicity (86% of the experimental variance is explained by the model, as indicated by the R2 determination coefficient), with a ratio of observations/adjustable parameters = 5, which is quite reasonable. The standard error of the model (0.42) is also close to the experimental value (0.54). However, to have a better knowledge of the true predictive ability of this equation, a cross-validation procedure was applied. In this procedure, the toxicity value of each solvent is predicted by the regression equation derived without using the experimental data of that solvent, so that it becomes a pure prediction. In the case of eqn (1), the toxicity of solvent 444 could not be predicted by this procedure, as the B1 coefficient cannot be calculated without this toxicity value. Using the remaining 19 solvents a RCV = 0.83 was obtained, still quite reasonable for a biological response. Fig. 11 plots the experimental values vs. those calculated with the MLR models.
From the QSAR point of view, a positive sign of the regression coefficient in eqn (1) means that the presence of an atom in the corresponding position leads to a decrease in toxicity, whereas the converse is true for negative coefficients. Thus, enlargement of the substituents at positions 1 and 3 results in a progressive increase of toxicity, which is easier to see by looking at the standardized regression coefficients for A2, B2 and C2 (−0.342, −0.399 and −0.600, respectively). On the other hand, substitution at the central oxygen atom tends to decrease the toxicity of these compounds, although in a less clear manner (standardized coefficient for B1 = 0.241).
The application of the stepwise MLR procedure to the same data set, using the topological descriptors as structural variables, led to the following equation:
 | (2) |
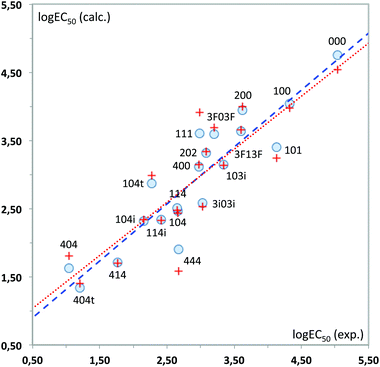
Again, a fairly good fit is obtained (84% of the total experimental variance explained), which is mostly kept in the cross-validation analysis (RCV = 0.85). Fig. 12 plots the experimental values vs. those calculated with these MLR models. As can be seen, 444 displays the highest deviation in the predicted toxicity, a fact undoubtedly related to being the sole structure studied with a long alkyl chain at position 2.
The interpretation of results is not straightforward in this case, due to the global character of the topological descriptors. The positive coefficient of the hydrogen bond donor count reflects the fact that the more free hydroxyl groups the solvent has, the lower its toxicity. The other two topological indices are mostly related to the molecular size, with some corrections to atom electronegativities and valence, which mainly affect the fluorinated compounds. Looking at the standardized coefficients for BalJX and χ2v (1.157 and −1.513, respectively) it can be seen that molecular size increase roughly results in an increase of toxicity, too.
We finally tested a classical approach in QSAR studies, i.e., the correlation between the measured toxicity and the hydrophobicity of the compounds, as expressed by log![[thin space (1/6-em)]](https://www.rsc.org/images/entities/char_2009.gif) P, the logarithm of the octanol/water partition coefficient.40,41Fig. 13 plots both sets of values. As can be seen, there are clear deviations from a linear behaviour in three solvents, namely 444 and the two fluorinated solvents. This indicates that hydrophobicity alone cannot account for the variations in toxicity obtained. In fact, it has also been shown that there is not always a direct correlation between lipophilicity and the adsorption, biodegradation rates and therefore toxicity; the persistence of the substance appears to be a key factor when correlating the bioavailability of the substance and the biological effect.42–45 Leaving aside these three solvents, the remaining seventeen show a good linear response:
P, the logarithm of the octanol/water partition coefficient.40,41Fig. 13 plots both sets of values. As can be seen, there are clear deviations from a linear behaviour in three solvents, namely 444 and the two fluorinated solvents. This indicates that hydrophobicity alone cannot account for the variations in toxicity obtained. In fact, it has also been shown that there is not always a direct correlation between lipophilicity and the adsorption, biodegradation rates and therefore toxicity; the persistence of the substance appears to be a key factor when correlating the bioavailability of the substance and the biological effect.42–45 Leaving aside these three solvents, the remaining seventeen show a good linear response:
log![[thin space (1/6-em)]](https://www.rsc.org/images/entities/char_2009.gif) EC50 = 3.243(±0.112) − 0.992(±0.110)log EC50 = 3.243(±0.112) − 0.992(±0.110)log![[thin space (1/6-em)]](https://www.rsc.org/images/entities/char_2009.gif) P P | (3) |
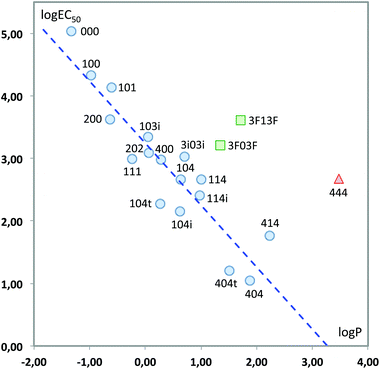 | ||
Fig. 13 Plot of log![[thin space (1/6-em)]](https://www.rsc.org/images/entities/char_2009.gif) EC50vs. log EC50vs. log![[thin space (1/6-em)]](https://www.rsc.org/images/entities/char_2009.gif) P. Only the solvents represented with circles have been used to obtain the least-squares fitting line. P. Only the solvents represented with circles have been used to obtain the least-squares fitting line. | ||
In any case, it is always dangerous to use this kind of correlation to drive conclusions about causality, because of the cross-correlations that exist among different molecular properties. For instance, in the case of log![[thin space (1/6-em)]](https://www.rsc.org/images/entities/char_2009.gif) P in a rather homogeneous molecular set as that considered in this work, there are strong correlations of this property with other molecular properties mainly related with molecular size, such as molar volume (0.984) or solvent accessible surface (0.977). It is clear that a deep knowledge of the mechanisms responsible for the toxicity measured in V. fischeri, as well as of the bioavailability of the aqueous solutions of the glycerol derivatives, would be necessary before assigning a clear causality in the SAR analyses. Studies in this direction, as well as the enlargement of the ecotoxicity studies to other bioindicators, are currently in progress in our groups and will be reported in due course.
P in a rather homogeneous molecular set as that considered in this work, there are strong correlations of this property with other molecular properties mainly related with molecular size, such as molar volume (0.984) or solvent accessible surface (0.977). It is clear that a deep knowledge of the mechanisms responsible for the toxicity measured in V. fischeri, as well as of the bioavailability of the aqueous solutions of the glycerol derivatives, would be necessary before assigning a clear causality in the SAR analyses. Studies in this direction, as well as the enlargement of the ecotoxicity studies to other bioindicators, are currently in progress in our groups and will be reported in due course.
Concerning the predictive ability of the QSAR equations presented in this work in real-world situations, we have tried to provide some clues in this direction by synthesizing and testing a new compound, namely that coded as 114t (1-tert-butoxy-2,3-dimethoxypropane). First results obtained in the ecotoxicity measurements of this compound indicate a value of 1735 ± 3.64 mg L−1, which fits well in the equations derived with the 20 original solvents. Furthermore, if a new solvent is included in the QSAR analyses, the derived equations show little difference with the original ones, indicating their robustness against the inclusion of new data. The corresponding plots and equations can be found in the ESI.†
Experimental
Synthesis of the glycerol derivatives
Monoalkylated glycerol derivatives were obtained by ring opening of glycidol using the appropriate alcohol and catalytic amounts of potassium hydroxide. Non-symmetric dialkylated glycerol derivatives were obtained by reaction of glycidol ethers with the appropriate alkoxide. Symmetric dialkylated glycerol derivatives were obtained by reaction of epichlorohydrin with the appropriate potassium alkoxide. Finally, trialkylated glycerol derivatives were obtained from the corresponding dialkylated derivatives, by alkylation of the central free hydroxyl group. Full experimental details on the synthetic procedures are available in the ESI.†Ecotoxicity experiments
The evaluation of the ecotoxicity was based on the determination of the inhibition of luminescence of V. fischeri bacteria. The experiments were carried out in accordance with the test conditions and the operating protocol of the V. fischeri acute toxicity test (UNE-EN-ISO 11348-3 2007).‡ Details of the experiments can be found elsewhere.46Trend analysis and quantitative structure–activity relationship (QSAR) models were applied with the software QSAR Toolbox 2.3 to determine the solvent concentrations to be tested. Once the range of EC50 was narrowed, at least 10 dilutions for each of the studied solvents were prepared using 2% NaCl as a stock solution. The pH of the solutions was adjusted to 7–7.5. Additionally, positive controls (phenol 42.5 mg L−1 and zinc sulphate, 2.2 mg L−1) and negative controls were also tested.47 The lyophilized V. fischeri (strain NRRL-B-11177) used were provided by Macherey-Nagel (ref. 945 006). Bacteria were exposed to the toxicants for 30 min at 15 °C.
Luminescence measurements were taken with a Biofix® Lumi-10 luminometer (Macherey-Nagel) using Biotox B mode (for acute measurements).
The obtained results have been fitted using the least-squares method using eqn (4) to obtain the corresponding EC50 values and standard deviations (SD):
%I = 100/(1 + 10(a−log![[thin space (1/6-em)]](https://www.rsc.org/images/entities/char_2009.gif) c)b) c)b) | (4) |
Conclusions
We have described for the first time the ecotoxicity of a series of glycerol alkyl ether solvents (including glycerol itself), using the bacteria Vibrio fischeri as a bioindicator. Although all the glycerol-derived structures display higher ecotoxicities than glycerol, half of them can be considered harmless for the environment on the basis of this bioindicator, and only three are clearly harmful following the Passino–Smith classification. These results support the often assumed greenness of these bio-based solvents, as far as potential environmental damage is concerned, although more ecotoxicity studies representing different trophic levels are necessary to have a whole view on this topic.A comparison of the ecotoxicity towards V. fischeri between several traditional solvents and glycerol ethers indicates that EC50 of some of our solvents is similar to low molecular weight alcohols, traditionally known to be not harmful for these bacteria. Furthermore, in general terms, the ecotoxicity of ionic liquids seems to be higher than that of glycerol derived solvents, especially when the length of substituents increases.
The QSAR studies point to a dependence of the toxicity on the alkyl chain size, manifest in the case of substitution at 1 and 3 positions of glycerol, but less clear in the case of substitution at the central 2 position. An enlargement of the solvent set seems necessary to establish with certainty the latter effect.
Acknowledgements
Financial support from the Spanish MINECO (project CTQ2011-28124-C02-01), the European Social Fund (ESF) and the Gobierno de Aragón (Grupo Consolidado E11) is gratefully acknowledged. GreenLife acknowledges financial support from MINECO (CTQ2013-44867-P), FEDER and EEE53 SL. business groups: Pinares de Venecia División Energética and Brial (ENATICA) for support. Both business groups are committed to sustainable development through environmental respect.Notes and references
- Handbook of Green Chemistry, 3 Volume Set, Green Solvents, ed. P. T. Anastas, W. Leitner and P. G. Jessop, Wiley-VCH Verlag GmbH, 2010 Search PubMed.
- R. A. Sheldon, Green Chem., 2014, 16, 950–963 RSC.
- M. Pagliaro, R. Ciriminna, H. Kimura, M. Rossi and C. Della Pina, Angew. Chem., Int. Ed., 2007, 46, 4434–4440 CrossRef CAS PubMed.
- C.-H. Zhou, J. N. Beltramini, Y.-X. Fan and G. Q. Lu, Chem. Soc. Rev., 2008, 37, 527–549 RSC.
- B. Katryniok, H. Kimura, E. Skrzyńska, J.-S. Girardon, P. Fongarland, M. Capron, R. Ducoulombier, N. Mimura, S. Paul and F. Dumeignil, Green Chem., 2011, 13, 1960–1979 RSC.
- Y. Gu and F. Jérôme, Green Chem., 2010, 12, 1127–1138 RSC.
- A. E. Díaz-Álvarez, J. Francos, B. Lastra-Barreira, P. Crochet and V. Cadierno, Chem. Commun., 2011, 47, 6208–6227 RSC.
- A. E. Díaz-Álvarez and V. Cadierno, Appl. Sci., 2013, 3, 55–69 CrossRef PubMed.
- J. I. García, H. García-Marín and E. Pires, Green Chem., 2014, 16, 1007–1033 RSC.
- H. Garcia-Marin, J. C. van der Toorn, J. A. Mayoral, J. I. Garcia and I. W. C. E. Arends, Green Chem., 2009, 11, 1605–1609 RSC.
- L. Aldea, J. M. Fraile, H. Garcia-Marin, J. I. Garcia, C. I. Herrerias, J. A. Mayoral and I. Perez, Green Chem., 2010, 12, 435–440 RSC.
- J. I. Garcia, H. Garcia-Marin, J. A. Mayoral and P. Perez, Green Chem., 2010, 12, 426–434 RSC.
- L. Aldea, J. I. Garcia and J. A. Mayoral, Dalton Trans., 2012, 41, 8285–8289 RSC.
- M. De Torres, I. W. C. E. Arends, J. A. Mayoral, E. Pires and G. Jimenez-Oses, Appl. Catal., A, 2012, 425, 91–96 CrossRef PubMed.
- S. Queste, P. Bauduin, D. Touraud, W. Kunz and J.-M. Aubry, Green Chem., 2006, 8, 822–830 RSC.
- M. Sutter, W. Dayoub, E. Métay, Y. Raoul and M. Lemaire, ChemCatChem, 2013, 5, 2893–2904 CrossRef CAS PubMed.
- M. Sutter, L. Pehlivan, R. Lafon, W. Dayoub, Y. Raoul, E. Métay and M. Lemaire, Green Chem., 2013, 15, 3020–3026 RSC.
- M. Sutter, W. Dayoub, E. Métay, Y. Raoul and M. Lemaire, Green Chem., 2013, 15, 786–797 RSC.
- L. Moity, M. Durand, A. Benazzouz, C. Pierlot, V. Molinier and J.-M. Aubry, Green Chem., 2012, 14, 1132–1145 RSC.
- J. I. García, H. García-Marín, J. A. Mayoral and P. Pérez, Green Chem., 2013, 15, 2283–2293 RSC.
- W. B. Arbuckle and J. E. Alleman, Water Environ. Res., 1992, 64, 263–267 CrossRef CAS.
- M. Salizzato, V. Bertato, B. Pavoni, A. V. Ghirardini and P. F. Ghetti, Environ. Toxicol. Chem., 1998, 17, 655–661 CrossRef CAS PubMed.
- M. Farré, F. Arranz, J. Ribó and D. Barceló, Talanta, 2004, 62, 549–558 CrossRef PubMed.
- Henkel KGaA, Rep. No. 9400063, 1994.
- OECD SIDS Initial Assessment Report, 2002.
- G. Bringmann and R. Kühn, Water Res., 1980, 14, 231–241 CrossRef CAS.
- B. Dabrock, H. Bahl and G. Gottschalk, Appl. Environ. Microbiol., 1992, 58, 1233–1239 CAS.
- D. R. M. Passino and S. B. Smith, Environ. Toxicol. Chem., 1987, 6, 901–907 CrossRef CAS PubMed.
- F. Onorati and M. Mecozzi, Chemosphere, 2004, 54, 679–687 CrossRef CAS PubMed.
- K. M. Docherty, J. Charles and F. Kulpa, Green Chem., 2005, 7, 185–189 RSC.
- A. Romero, A. Santos, J. Tojo and A. Rodríguez, J. Hazard. Mater., 2008, 151, 268–273 CrossRef CAS PubMed.
- J. Ranke, K. Mölter, F. Stock, U. Bottin-Weber, J. Poczobutt, J. Hoffmann, B. Ondruschka, J. Filser and B. Jastorff, Ecotoxicol. Environ. Saf., 2004, 58, 396–404 CrossRef CAS.
- M. Alvarez-Guerra and A. Irabien, Green Chem., 2011, 13, 1507–1516 RSC.
- H. Zhao, S. Xia and P. Ma, J. Chem. Technol. Biotechnol., 2005, 80, 1089–1096 CrossRef CAS PubMed.
- S. Keskin, D. Kayrak-Talay, U. Akman and Ö. Hortaçsu, J. Supercrit. Fluids, 2007, 43, 150–180 CrossRef CAS PubMed.
- R. J. Bernot, M. A. Brueseke, M. A. Evans-White and G. A. Lamberti, Environ. Toxicol. Chem., 2005, 24, 87–92 CrossRef CAS.
- J. E. Dubois, Computer Representation and Manipulation of Chemical Information, John Wiley & Sons, New York, 1974 Search PubMed.
- L. B. Kier and L. H. Hall, Molecular Connectivity in Structure–Activity Analysis, Ed. Research Studies Press Ltd, New York, 1985 Search PubMed.
- A. R. Katritzky and E. V. Gordeeva, J. Chem. Inf. Comput. Sci., 1993, 33, 835–857 CrossRef CAS.
- A. Leo, C. Hansch and D. Elkins, Chem. Rev., 1971, 71, 525–616 CrossRef CAS.
- A. K. Ghose and G. M. Crippen, J. Chem. Inf. Comput. Sci., 1987, 27, 21–35 CrossRef CAS.
- A. J. Hendriks, A. van der Linde, G. Cornelissen and D. T. H. M. Sijm, Environ. Toxicol. Chem., 2001, 20, 1399–1420 CrossRef CAS PubMed.
- A. J. Hendriks and A. Heikens, Environ. Toxicol. Chem., 2001, 20, 1421–1437 CrossRef CAS PubMed.
- S. Bayen, T. L. ter Laak, J. Buffle and J. L. M. Hermens, Environ. Sci. Technol., 2009, 43, 2206–2215 CrossRef CAS.
- L. S. McCarty, Regul. Toxicol. Pharmacol., 2012, 63, 353–362 CrossRef CAS PubMed.
- L. Lomba, S. Muñiz, M. R. Pino, E. Navarro and B. Giner, Ecotoxicology, 2014, 23, 1484–1493 CrossRef CAS PubMed.
- V. L. K. Jennings, M. H. Rayner-Brandes and D. J. Bird, Water Res., 2001, 35, 3448–3456 CrossRef CAS.
Footnotes |
| † Electronic supplementary information (ESI) available: Tables with the molecular descriptors used and additional QSAR analyses. Analyses of the predictive ability of the QSAR equations. Experimental details of the synthesis of the compounds tested. See DOI: 10.1039/c5gc00857c |
| ‡ Concentration units in the UNE-EN-ISO 11348-3 2007 acute toxicity test used are expressed in mg L−1. Given the different molar masses (M) of the solvents studied, this could be an issue when comparing relative toxicities. Of course, in the case of compounds with similar M, these differences tend to be negligible. However, for the sake of completeness, we have repeated all the QSAR analyses with EC50 toxicities expressed in mM units, without noticeable changes in the conclusions reached. The results of these analyses are available as the ESI.† |
| This journal is © The Royal Society of Chemistry 2015 |

