 Open Access Article
Creative Commons Attribution 3.0 Unported Licence
Sustainable wastewater treatment and recycling in membrane manufacturing†
Mayamin
Razali‡
a,
Jeong F.
Kim‡
b,
Martin
Attfield
c,
Peter M.
Budd
c,
Enrico
Drioli
bd,
Young Moo
Lee
b and
Gyorgy
Szekely
*a
aSchool of Chemical Engineering & Analytical Science, The University of Manchester, The Mill, Sackville Street, Manchester M13 9PL, UK. E-mail: gyorgy.szekely@manchester.ac.uk; Fax: +44 (0)161 306 4366; Tel: +44 (0)161 306 4366
bWCU Department of Energy Engineering, Hanyang University, Republic of Korea
cSchool of Chemistry, The University of Manchester, M13 9PL, UK
dInstitute on Membrane Technology (ITM-CNR), Via P. Bucci 17/C, 1-87030 Rende, CS, Italy
First published on 10th September 2015
Abstract
It is widely accepted that membrane technology is a green and sustainable process; however, it is not well known that the membrane fabrication process itself is quite far from green, with more than 50 billion liters of wastewater being generated every year contaminated with toxic solvents such as DMF and NMP. This urgent challenge is often overlooked and recent attempts to improve the sustainability of membrane fabrication have been limited to the replacement of toxic solvents with greener alternatives. Our recent survey from membrane industries indicates that such wastewater contributes to more than 95% of the total waste generated during the membrane fabrication process, and their disposal is considered cumbersome. Hence, recycling wastewater in the membrane industry is a pressing challenge to be resolved to augment the rapidly growing membrane market. In this work, a continuous wastewater treatment process is proposed and the quality of the recycled water was validated through membrane fabrication and performance tests. Seven different classes of adsorbents—graphene, polymers with intrinsic microporosity, imprinted polymers, zeolites, metal organic frameworks, activated carbon, and resins—were evaluated. The isotherm and kinetic behaviors of the best adsorbents have been fully characterized and the adsorbent regenerability without any performance loss has been confirmed for up to 10 wastewater treatment cycles. It has been demonstrated that over 99% of the organic impurities in the wastewater can be successfully removed and the recycled water can be reused without adverse effects on the final membrane performance. The proposed wastewater treatment technique can reduce the process mass intensity (PMI) of membrane fabrication by 99.9% per m2 of the membrane produced. The required energy duty for different regeneration methods and wastewater treatment methods revealed that the adsorption technology is the most effective method, with the lowest energy requirement of about 1200 kJ per m2 of the membrane produced.
1. Introduction
Membrane technology has been recognized as the key technology to tackle the global water shortage challenge. Membrane-based technology now accounts for more than 70% of the world desalination capacity1 and membrane bioreactor technology is now becoming a dominant player in the field of wastewater treatment.2 In addition, microfiltration and ultrafiltration technologies are now commonly found in a wide range of applications, such as pretreatment of saline water, and in food, textile, and pharmaceutical industries.3Membrane processes are generally considered a green technology, with their unique characteristics such as low energy consumption and convenient compact operation.4,5 Although membranes certainly have improved the sustainability of chemical processes,6 it is not widely known that membrane fabrication itself is quite far from being a green process. Membrane fabrication typically employs toxic, dipolar aprotic solvents such as N-methyl-2-pyrrolidone (NMP) and N,N-dimethylformamide (DMF) for phase inversion.7 These solvents mix with water during polymeric membrane formation and consequently significant quantities of solvent-containing wastewater are generated. Due to the waste-intensive nature of membrane fabrication, it has been shown that downstream processing via membrane technology only becomes greener than distillation when more than 100 L m−2 of solvent has been processed.5
The membrane application market is currently growing at a fast rate of 9% and the overall market size is expected to reach ca. $26 billion by 2017.8 Consequently, the membrane manufacturing industry is expanding rapidly to meet the growing global market demand. There are currently about 4–5 million units of spiral-wound modules (40 m2 per module) just for the seawater desalination plants, and the number is growing at 10% each year.9 The amount of wastewater generated to produce 5 million spiral-wound modules can be approximated as 20–100 billion liters, and the generation rate is growing at 10 billion liters per year (see the ESI† for calculations). Note that this figure is just for the desalination membrane market (ca. $1100 million in 2013)10 alone. Combined with other fast-growing sectors such as gas separation (ca. $150 million in 2002),11 battery separator (ca. $800 million in 2014),12 pharmaceutical and artificial kidney application (50% of all the polymeric membranes produced),13 membrane bioreactor, and micro/ultrafiltration market, the figure is likely to be several times higher.
The amount of wastewater generated from membrane manufacturing plants can be estimated to be approximately 100–500 L of wastewater per square meter of membranes produced (see the ESI† for calculations). As illustrated in Fig. 1, the solvent contamination in the membrane wastewater always exceeds the minimum allowable level of 100 ppm,5 requiring appropriate treatment prior to disposal (note the wastewater concentration is a function of the coagulation bath size). The regulations for wastewater threshold levels have been getting tough in the US and particularly in Europe,14 promoting much interesting research to minimize solvent consumption by employing ionic liquids,15 supercritical CO2,16 and environmentally benign solvents.17,18 Unfortunately, at the moment, economic feasibility and altered membrane performance are among the factors inhibiting their commercial implementation. On the other hand, direct reuse of the water bath is not possible because the solvent in the coagulation bath affects the membrane morphology during phase inversion. For instance, NMP concentration as low as 3 wt% can decrease the membrane permeability by 25%.19 Hence, it is vital to maintain solvent concentration in the coagulation bath constant or as low as possible to obtain uniform membranes. This is particularly important for a continuous membrane fabrication process, where the coagulation bath concentration needs to be adequately controlled to produce uniform membranes.
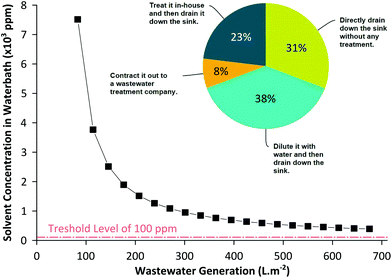 | ||
| Fig. 1 Calculated solvent concentration in the wastewater during a typical membrane fabrication process. The solvent concentration is above the allowable 100 ppm organic impurity range in wastewater, requiring an appropriate treatment prior to disposal or reuse. The pie chart shows the outcome of our survey how membrane manufacturing companies dispose off the coagulation bath wastewater. Please refer to the ESI† for all survey questions and answers. | ||
Our recent survey analysis based on the responses of 13 membrane manufacturing companies has confirmed that membrane wastewater is a serious and urgent challenge to be resolved (see the ESI† for full survey details). The survey revealed that the wastewater generated during membrane fabrication (i) contributes to more than 95% of the total waste; (ii) on a scale from 1–10, the average difficulty level of wastewater treatment scored 8.6; and (iii) more than 69% of the companies drained the wastewater without any treatment and only 31% treated the wastewater prior to disposal. Since the wastewater needs special treatment prior to disposal, industries typically dilute the solution using excess water or subcontract it out offsite as shown in Fig. 1. However, it should be emphasized that the wastewater generated from membrane production is relatively clean compared to the wastewater generated from textile or pharmaceutical industries. The current trend in wastewater treatment technology, apart from abating contamination, is to design a sustainable process that does not require high energy consumption and operating costs.20–22 Hence, the present article examines the practicality and viability of purifying the membrane wastewater in situ and recycling it continuously during membrane production using adsorption technology.
Various high performance adsorbents are now available for water purification ranging from state-of-the-art graphene,23 polymers with intrinsic microporosity (PIM),24 molecularly imprinted polymers (MIPs),25 metal organic frameworks (MOFs),26 to commercial resins,27 zeolites28 and charcoal (activated carbon).27 Thirty-five adsorbents from seven different classes of materials were prepared or purchased and screened for the adsorption of the two most common solvent contaminants13 in membrane industrial wastewater: NMP and DMF. In search for sustainable wastewater treatment and recycling in membrane manufacturing, the adsorbents’ sorption and kinetic behaviors, regenerability, and feasibility for continuous treatment of membrane wastewater in terms of energy savings and waste minimization were critically assessed.
The membrane manufacturing industry, leading universities, research funding agencies and governments are all in agreement that water treatment is one of the grand engineering challenges of today. Only when the wastewater challenge is resolved should the membrane technology be considered green and sustainable.
2. Results and discussion
2.1 In search for the ideal adsorbent
The three most important criteria for adsorbent selection are high capacity, fast kinetics, and easy regenerability. Among the 35 adsorbents tested from 7 different classes of materials, Fig. 2 summarizes the adsorption capacity for the best performing 6 adsorbents. See Fig. S5 in the ESI† for the full screening results. The screening data revealed that acidic adsorbents generally exhibited higher binding capacity than neutral or basic adsorbents from the same class, likely due to the basic nature of the DMF and NMP molecules (pKa = 16 and 24, respectively). Particularly, the imprinted polymers featuring the most acidic functional monomers, namely methacrylic acid (MIP6), 3-vinylphenylboronic acid (MIP7), and itaconic acid (MIP8), showed the best performance within the MIP class. Similarly, the acidic PHO adsorbent from the charcoal class showed superior performance compared to neutral SAC6 adsorbent from the same class.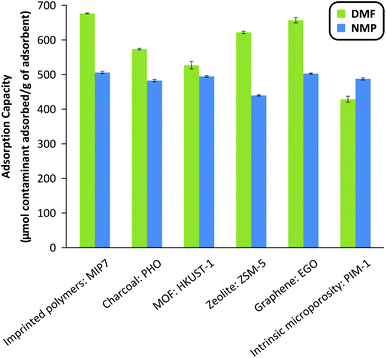 | ||
| Fig. 2 Adsorption capacity of the best adsorbent from the different classes of materials investigated: imprinted polymers, charcoals, metal–organic frameworks, zeolites, graphene-based materials and polymers of intrinsic microporosity. The adsorbent mass to system volume ratio was fixed at 20 g L−1. See Fig. S5 in the ESI† for the full screening results. MIP, HKUST-1, ZSM-5, EGO and PIM stand for molecularly imprinted polymer, Hong Kong University of Science, Zeolite Socony Mobil, exfoliated Graphene Oxide and Polymers of intrinsic microporosity. PHO is part of the internal nomenclature of Eurocarb®. | ||
Although both DMF and NMP are dipolar aprotic solvents with similar polarity indexes (6.4 and 6.7, respectively), the majority of adsorbents showed higher adsorption capacity towards DMF than NMP, likely due to the smaller size and flexible conformation of DMF. The resin-class adsorbents showed relatively poor performance hence were not investigated further.
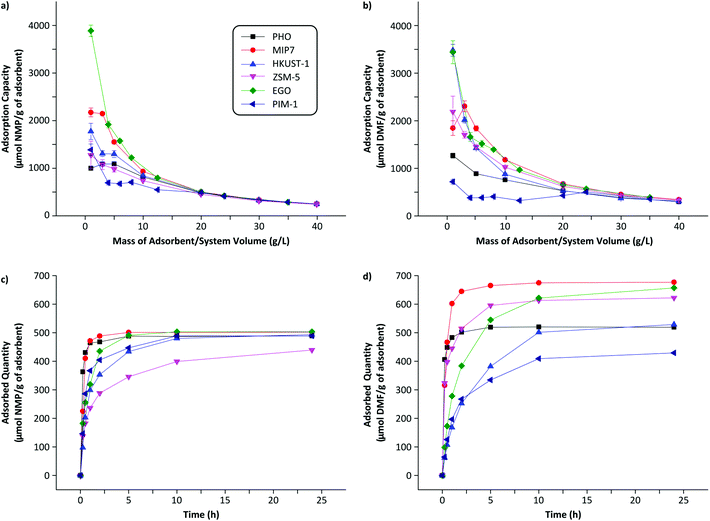
The best adsorbent from each class was further characterized for its full adsorption isotherm and kinetic behaviors. Each material shows different adsorption behavior as a function of the mass–volume ratio as depicted in Fig. 3(a and b). Analyzing such adsorption behavior can elucidate its adsorption mechanisms by fitting to different isotherm models.29 See Table S1 in the ESI† for full isotherm data. Several trends can be deduced from the data. PHO (charcoal class) adsorption data are the best described by the two-parameter Freundlich model, indicating the surface of charcoal is highly heterogeneous and stronger binding sites are occupied first followed by weaker binding sites.30 On the other hand, solute-specific adsorbents such as MIP7 (MIP class) are better characterized by the three-parameter models such as Redlich–Peterson isotherm, indicating more homogeneous and specific binding sites as expected.31 The imprinted polymers were prepared in the presence of DMF and NMP as a template which formed target specific binding sites in the polymer framework. It is notoriously difficult to imprint small and low functionality templates and examples are scarce.32,33 Graphene is a fascinating new member of carbon materials with honeycomb and one-atom-thick structures which has excited interest in the field adsorption due to its exceptional properties. EGO (graphene-based class) adsorption capacities were among the highest for NMP (503 μmol g−1) and DMF (657 μmol g−1), and are the best fitted by the Langmuir model, indicating the formation of a single adsorption layer on identical and equivalent binding sites.
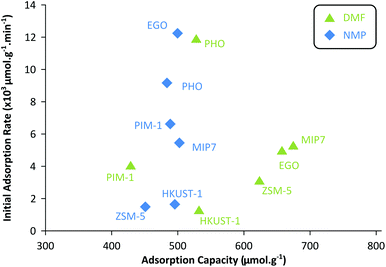
Fig. 4 shows that the adsorption capacities for DMF are generally higher than those of NMP. On the other hand, the adsorption rates are generally higher for NMP than those of DMF. The heterogeneous adsorption behavior (Freundlich isotherm) of PHO (charcoal class) is clearly visible as the sorption profiles for DMF and NMP are quite similar – nonselective adsorption occupying the highest binding sites first. Although PHO showed excellent kinetics for both adsorbents, DMF adsorption capacity was one of the lowest among the tested adsorbents. Fig. 4 summarizes that MIP7, EGO, and ZSM-5 showed the highest adsorption capacities for DMF, whereas the NMP adsorption capacities were relatively similar among the tested adsorbents.
Apart from the adsorption capacity and rate it is essential to evaluate the regenerability of adsorbents. Used adsorbents are typically discarded as solid waste posing an environmental issue, and the current trend is to maximize the adsorbent regenerability to improve the process sustainability.34 Hence, the regeneration efficiency as well as operation lifetime are now two key factors in designing an effective adsorption process. Adsorbents can be regenerated using several different ways such as thermal swing, vacuum swing, pressure swing, steam treatment, and/or chemical treatment methods. The economics of the regeneration method could be a deciding factor when choosing the right adsorbent. For instance, although charcoal is an excellent adsorbent material with low cost, high surface area, and high binding capacity, charcoal can only be regenerated with significant energy input, and typically results in large volumes of solid waste contaminated with toxic pollutants.14
To characterize the regenerability of the adsorbents in this work, three different regeneration methods (solvent washing, vacuum swing, and thermal treatment) were evaluated for each adsorbent, summarized in Table 1. Please note thermal regeneration experiments were not performed in the lab and the data were deduced from the literature. It was reported that thermal regeneration of charcoal typically results in 5–15% reduction of the adsorption capacity due to attrition.34 In addition, on-site thermal regeneration is not cost-effective for adsorbent usage less than 910 kg per day, rendering the thermal regeneration option unsuitable for the membrane fabrication industry. Each adsorbent requires different treatments for regeneration, as summarized in Table 1. For instance, MIP7 can be fully regenerated using 4 ml of MeOH![[thin space (1/6-em)]](https://www.rsc.org/images/entities/char_2009.gif) :
:![[thin space (1/6-em)]](https://www.rsc.org/images/entities/char_2009.gif) H2O (10
H2O (10![[thin space (1/6-em)]](https://www.rsc.org/images/entities/char_2009.gif) :
:![[thin space (1/6-em)]](https://www.rsc.org/images/entities/char_2009.gif) 90) mixture per gram of adsorbent, whereas PIM-1 requires more than 10 ml of pure MeOH per gram of adsorbent (see Fig. S6 in the ESI† for details). The HKUST-1 (MOF class) adsorbent was also best regenerated using solvent wash with even lower efficiency. On the other hand, EGO (graphene class), ZSM-5 (zeolite class), and PIM-1 adsorbents could not be regenerated using solvent wash but were effectively regenerated under vacuum.
90) mixture per gram of adsorbent, whereas PIM-1 requires more than 10 ml of pure MeOH per gram of adsorbent (see Fig. S6 in the ESI† for details). The HKUST-1 (MOF class) adsorbent was also best regenerated using solvent wash with even lower efficiency. On the other hand, EGO (graphene class), ZSM-5 (zeolite class), and PIM-1 adsorbents could not be regenerated using solvent wash but were effectively regenerated under vacuum.
| Adsorbent | Regeneration method efficiency | ||
|---|---|---|---|
| Washing | Vacuum | Thermal | |
| MIP7 | High | High | Low |
| PHO | Low | Low | Moderate |
| EGO | Low | High | Low |
| PIM-1 | Moderate | High | Low |
| ZSM-5 | High | High | High |
| HKUST-1 | Moderate | Low | Low |
Fig. 5 summarizes the regenerability of each adsorbent up to 10 cycles. It can be seen that MIP7, EGO, PIM-1, and ZSM-5 adsorbents were fully regenerated 10 times without any performance degradation. On the other hand, HKUST-1 adsorption performance slowly decayed with subsequent usage, losing approximately 15% by the 10th cycle. This is likely due to an irreversible decomposition of the HKUST-1 framework due to the partial displacement of organic linkers from the copper centers by either water molecules or the solvents.35 Nijem et al. demonstrated a photo-reduction based modification of the metal center which mitigated such decomposition caused by water.36 Although it is out of the scope of the present work such approach could increase the potential of HKUST-1 in wastewater treatment.
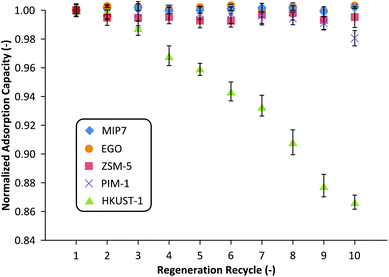 | ||
| Fig. 5 Regeneration of adsorbents saturated with NMP. MIP7 and PIM-1 were regenerated using solvent washing, ZSM-5, EGO and HKUST-1 were regenerated under vacuum. | ||
Among the tested adsorbents, MIP7 and EGO showed the best performance. The adsorbent regenerability and cost are related, as an expensive adsorbent with high regenerability may be more cost effective than a low-cost adsorbent with low regenerability. To demonstrate the impact of membrane wastewater treatment, MIP7 was tested for a continuous water treatment process. However, as will be shown in the subsequent section, adopting an adsorptive wastewater treatment unit using any of the adsorbents can significantly improve the sustainability of the membrane fabrication process.
2.2 Continuous wastewater purification and recycling
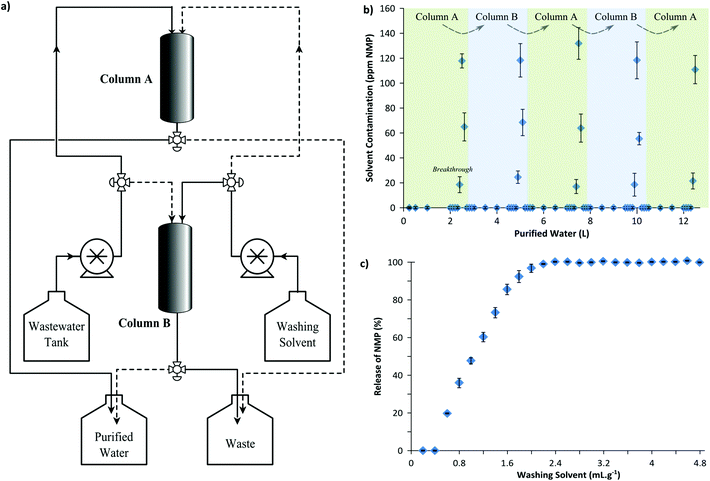
In order to demonstrate the feasibility of a continuous adsorptive wastewater treatment process, membrane wastewater was continuously treated using two parallel columns in an alternating sequence as illustrated in Fig. 6(a). Each adsorption column was wet-packed with 50 g of MIP7 adsorbent. Fig. 6(b) shows that a breakthrough of NMP occurred approximately at every 2.5 L wastewater processed, after which the column had to be regenerated (see Fig. S7 in the ESI† for the breakthrough curve). Fig. 6(c) illustrates the regeneration profile: 2.4 mL of 1![[thin space (1/6-em)]](https://www.rsc.org/images/entities/char_2009.gif) :
:![[thin space (1/6-em)]](https://www.rsc.org/images/entities/char_2009.gif) 9 v/v methanol–water washing solution per gram of adsorbent was used to fully regenerate the column.
9 v/v methanol–water washing solution per gram of adsorbent was used to fully regenerate the column.
Hence, after processing 2.5 L wastewater using Column A, the feed was routed to Column B while Column A was simultaneously regenerated using the washing solvent. Five cycles of adsorption–regeneration were carried out in a continuous process to purify 12.5 L water to reduce the NMP concentration from 887 ± 90 ppm to only 7.6 ± 0.8 ppm (99.1 ± 0.2% removal). Note that a more stringent breakthrough volume of 2.3 L could achieve 100% NMP removal. Nevertheless, 7.6 ppm NMP contamination is already one magnitude lower than the 100 ppm requirement for the safe disposal of wastewater.
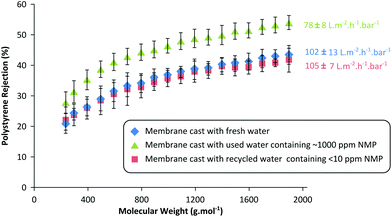
To validate the recyclability of the purified wastewater for membrane fabrication, three different batches of membranes were prepared using three different coagulation baths: (i) fresh water without any NMP contamination, (ii) used wastewater contaminated with 887 ± 90 ppm NMP, and (iii) purified wastewater containing 7.6 ± 0.8 ppm NMP. The performances of the resulting membranes were compared for acetone flux and solute rejection (polystyrene oligomer) as shown in Fig. 7.
In line with the expectation,19 the membranes fabricated in a NMP-contaminated coagulation bath exhibit 23% lower permeance and 5–10% higher solute rejection compared to the membranes cast in fresh water. This phenomenon is due to the fact that solvent contamination in the coagulation bath affects the membrane formation kinetics by slowing the dope demixing process, resulting in tighter membranes with lower flux. In fact there are two concentration-dependent mechanisms in action when the coagulation bath contains the dope solvent. First, when the solvent concentration in the coagulation bath is high, it dilutes the surface polymer concentration and creates pores.37,38 On the other hand, lower dope solvent concentration in the coagulation bath slows the diffusion rate of the solvent outflow, ultimately tightening the membranes by delaying the demixing process.19,39 In this work, 1000 ppm solvent concentration is approximately 0.1 vol% in the bath, which is not high enough to dilute the surface polymer concentration to create pores. Instead, the presence of the solvent in the coagulation bath has rather a stronger effect on the demixing rate as illustrated in Fig. 7.
Furthermore, the membranes prepared using the purified water showed almost identical performance to the membranes prepared using fresh water. This result undoubtedly validates the recyclability of the membrane wastewater, and the feasibility of the proposed continuous adsorptive purification unit. The results obtained reiterate the importance of maintaining a constant coagulation bath composition during a continuous membrane fabrication process in order to obtain uniform membranes. Implementing an adsorption unit operation to recycle membrane wastewater is a simple and effective solution not only to maintain constant membrane performance, but also to significantly improve the sustainability of the membrane fabrication process.
2.3 Sustainability assessment of the wastewater treatment process
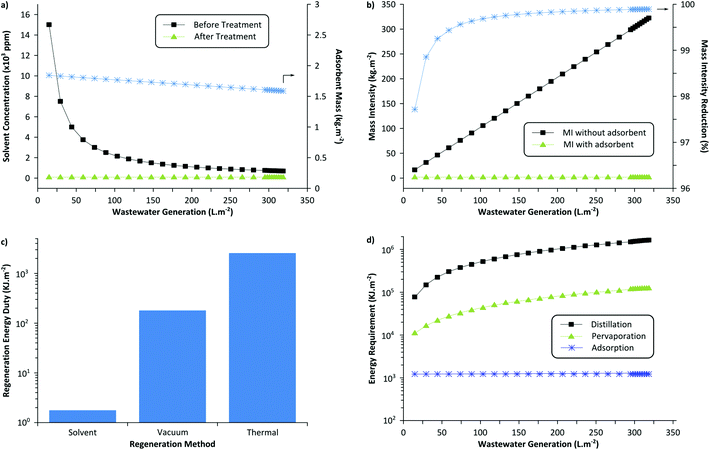
The sustainability of the wastewater treatment process was analyzed by employing green metrics in order to assess its realistic impact (see the ESI† for detailed calculations). Fig. 8(a) illustrates the required adsorbent amount (MIP7) to reduce the solvent concentration below the threshold value. It can be seen that approximately 1.5 to 1.8 kg of the adsorbent is required per m2 of membrane fabricated. For this calculation, adsorbent regeneration was not taken into account. If the adsorbents were to be regenerated for 10 cycles, approximately 0.15 to 0.18 kg of the adsorbent would be required per m2 of membrane fabricated. Note that with more wastewater generated per membrane area (higher L m−2), the longer is the purification time required using the same amount of adsorbent. Hence, to maintain uniform coagulation bath concentration throughout the membrane production process, it is necessary to size the adsorption equipment appropriately considering the membrane production scale and production rate.Fig. 8(b) shows the process mass intensity of membrane fabrication with and without an adsorption unit. The mass intensity is one of the commonly used metrics to evaluate the sustainability of processes, defined as follows:
 | (1) |
Since the coagulation bath water is the major contributor to the waste generated during membrane fabrication (see survey question 3 in the ESI†), the implementation of the developed adsorptive unit reduces the mass intensity by >99.9% and subsequently transforms the membrane processes to a sustainable technology. On the other hand, approximately 1.67 kg of the MIP7 adsorbent is required to purify 221 kg of wastewater (contaminated with 1000 ppm solvent). Considering the solvent required to fabricate the MIP particles and the washing solvent for adsorbent regeneration, approximately 31 kg of wastewater can be purified per kg of total waste generated (see detailed calculations in the ESI†). Given the robust nature of imprinted polymers due to a high crosslinking degree, they can be regenerated about 50 times,40 improving the ratio up to 54 kg kg−1.
Fig. 8(c) shows the required energy duty for the three different adsorbent regeneration methods discussed in this work: solvent wash, vacuum swing, and thermal treatment. The solvent washing method consumes the least amount of energy and the thermal treatment consumes the most. However, it should be noted that the solvent washing method generates more solvent waste compared to the other two methods. Nevertheless, the solvent volume fraction is negligible relative to the overall process mass intensity and still drastic MI reduction can be achieved. In addition, the solvent washing method is the most convenient and simple method to continuously regenerate the adsorption column, as it simply requires a pump to flow in the washing solvent. Considering the ease of operation and the effectiveness of the method, it is the preferred method to treat membrane wastewater.
Fig. 8(d) compares the required energy duty for the three different wastewater treatment methods: distillation, pervaporation, and adsorption. The most widespread potential competitors of adsorption in water purification (with low organic impurities) are distillation and pervaporation. Distillation consumes the most energy as both DMF and NMP have considerably higher boiling points (Tb = 153 °C and 204 °C, respectively) than water. On the other hand, pervaporation is an emerging technology with a promising potential that can selectively discriminate solvent over water, as commonly used in the bioethanol upgrading plants.41 In theory, a suitable pervaporation membrane can selectively permeate NMP over water to purify the wastewater. Other membrane technologies like organic solvent nanofiltration can also be employed to recover organic solvents.42 It can be seen that the energy duty is in between that of adsorption and distillation. The calculation assumed equi-volume permeate concentration. Distillation or pervaporation units would become competitive for a very large membrane production scale, as these technologies can handle large volumes of wastewater effectively.
In summary, considering the ease of operation, feasibility, and energy requirement, it can be concluded that installing an adsorption unit with the solvent-washing regeneration method is the preferred way to recycle wastewater generated by membrane production industries.
3. Conclusions
Membrane technology will only become green and sustainable when the wastewater generated during the membrane fabrication process is minimized. In this work, we demonstrated and validated for the first time a practical and effective way to continuously recycle the membrane wastewater, reducing the waste generation by 99%. Seven different classes of adsorbent materials—charcoal, MIPs, zeolites, MOFs, graphene, PIMs, and resins—have been thoroughly screened using membrane fabrication wastewater contaminated with DMF and NMP. The adsorption isotherm and kinetic profile of each adsorbent have been fully elucidated and characterized. Most of the tested adsorbents showed feasible performance to treat the membrane wastewater. Particularly, one of the MIP adsorbents functionalized with phenylboronic acid (MIP7) showed superior performance capable of adsorbing 677 ± 2 and 502 ± 5 mmol DMF and NMP per kg adsorbent, respectively. Regenerability of each adsorbent has been demonstrated up to 10 times without any performance degradation. The proposed continuous adsorptive wastewater treatment is an effective solution to mitigate solvent contamination down to <10 ppm level, allowing safe disposal. In addition, the in-house recyclability of the purified wastewater was validated by crosschecking membrane performances, which revealed the importance of water purity during a continuous membrane fabrication process. The membranes fabricated in a NMP-contaminated coagulation bath exhibited 23% lower permeance and 5–10% higher solute rejection compared to the membranes cast in fresh or recycled water. The process mass intensity of the membrane fabrication process can be reduced by 99.9% with the continuous adsorption unit. Our conservative estimation predicts that the wastewater generation can be reduced by at least 50 billion liters per year. In short, the proposed adsorption process can truly make the membrane processes greener and more sustainable starting from its very fabrication step.4. Experimental
4.1 General
Reagents (reagent grade) and solvents (analytical grade) were purchased from Sigma-Aldrich and Fisher Scientific, respectively. Charcoal, zeolites, graphene and resins were obtained from Eurocarb, VWR, Sigma-Aldrich and Dow, respectively. MIP, PIM, and MOF were prepared in-house (procedures described below). Acetonitrile porogen was dried over 4 Å molecular sieves. Millipore Type II water was used for all experiments. Polyimide (P84) powder was purchased from HP Polymer GmbH. 5,5′,6,6′-Tetrahydroxy-3,3,3′,3′-tetramethyl-1,1′-spirobisindane (TTSBI, 98%, Synthon Chemicals) was dissolved in methanol, re-precipitated from dichloromethane and dried under vacuum at room temperature before use. Tetrafluoroterephthalonitrile (TFTPN, 98%, Chemos) was used as received. Anhydrous K2CO3 (99%, Fisher) was ground to a fine powder and dried in a vacuum oven at 110 °C overnight before use. Anhydrous dimethylacetamide (DMAc), toluene and methanol were purchased from Sigma Aldrich and used as received. An Agilent 6890N GC system equipped with a Variant Factor 4 VF-5 ms (28 m × 0.25 mm DI × 1 μm DF) column and an Agilent 5973 MS detector was used for NMP and DMF analysis.4.2 Preparation of imprinted polymers
MIP microspheres were prepared by a suspension polymerization method according to our reported procedure.43 Briefly, in a typical MIP fabrication procedure the 3-vinylphenylboronic acid functional monomer (1 mmol), either NMP or DMF template (1 mmol), EDMA cross-linker (20 mmol), AIBN initiator (0.1 wt%), perfluoro polymeric surfactant (PFPS) emulsifier (100 mg), perfluoro methylcyclohexane (PMC) dispersing phase (80 mL) and acetonitrile porogen (15 mL) were stirred at 300 rpm. The imprinted polymers were obtained by polymerization involving irradiation of the stirred mixture with UV light for 6 hours at a wavelength of 365 nm at room temperature under an inert atmosphere. The resulting beads were filtered and the remaining template and unreacted molecules were extracted by sequential washing with methanol. The MIPs were dried under reduced pressure for 24 h at room temperature. Please refer to the ESI† for detailed synthesis and characterization of the imprinted polymers.4.3 Preparation of polymers of intrinsic microporosity
PIM-1 was prepared by the method of Du et al.44 To a dry 100 mL three-neck round-bottom flask, equipped with a Dean-Stark trap, mechanical stirrer and nitrogen inlet, 5,5′,6,6′-tetrahydroxy-3,3,3′,3′-tetramethyl-1,1′-spirobisindane (TTSBI) (3.404 g, 0.01 mol), tetrafluoroterephthalonitrile (TFTPN) (2.001 g, 0.01 mol), anhydrous potassium carbonate (4.146 g, 0.03 mol), dimethylacetamide DMAc (20 mL), and toluene (10 mL) were added under an atmosphere of nitrogen gas. The monomers were allowed to dissolve before the reaction mixture was refluxed at 160 °C for 20 min. The viscous solution was then poured into methanol to precipitate the product. The sample was refluxed overnight in deionized water, washed with acetone (150 mL) and dried in a vacuum oven at 110 °C overnight. GPC: Mn = 48![[thin space (1/6-em)]](https://www.rsc.org/images/entities/char_2009.gif) 800, Mw = 128
800, Mw = 128![[thin space (1/6-em)]](https://www.rsc.org/images/entities/char_2009.gif) 000, Mp = 87
000, Mp = 87![[thin space (1/6-em)]](https://www.rsc.org/images/entities/char_2009.gif) 700, Mw/Mn = 2.6. 1H NMR(400 MHz, CDCl3): δ 6.74 (br, s, 2H), 6.35 (br, s, 2H), 2.25 (br, s, 2H), 2.08 (br, s, 2H), 1.29 (br, s, 6H), 1.24 (br, s, 6H). BET surface area: 705 m2 g−1. Elemental analysis calculated for C29H20N2O4 (wt%): C, 75.65 H, 4.35 N, 6.09. Found C, 73.29 H, 4.15 N, 5.74.
700, Mw/Mn = 2.6. 1H NMR(400 MHz, CDCl3): δ 6.74 (br, s, 2H), 6.35 (br, s, 2H), 2.25 (br, s, 2H), 2.08 (br, s, 2H), 1.29 (br, s, 6H), 1.24 (br, s, 6H). BET surface area: 705 m2 g−1. Elemental analysis calculated for C29H20N2O4 (wt%): C, 75.65 H, 4.35 N, 6.09. Found C, 73.29 H, 4.15 N, 5.74.
4.4 Preparation of a HKUST-1 metal–organic framework
HKUST-1 was synthesised by immersing two Cu foil electrodes (∼16 cm2), approximately 2 cm apart, into a 1![[thin space (1/6-em)]](https://www.rsc.org/images/entities/char_2009.gif) :
:![[thin space (1/6-em)]](https://www.rsc.org/images/entities/char_2009.gif) 1 ethanol
1 ethanol![[thin space (1/6-em)]](https://www.rsc.org/images/entities/char_2009.gif) :
:![[thin space (1/6-em)]](https://www.rsc.org/images/entities/char_2009.gif) deionised water solution containing a 48 mM 1,3,5-benzenetricarboxylic acid linker and 64 mM methyltributylammonium methyl sulphate supporting electrolyte.45 The solution was maintained at 55 °C and deaerated with N2 (g) whilst a PGSTAT302N potentiostat (Metrohm Autolab B.V., The Netherlands) was used to apply a fixed potential difference of 2.5 V between the two Cu foil electrodes for one hour. This generated HKUST-1 in solution was collected by centrifugation. The HKUST-1 was then re-suspended in methanol, stirred and collected again by centrifugation before being left to dry. Please refer to the ESI† for MOF preparation protocols and characterisation.
deionised water solution containing a 48 mM 1,3,5-benzenetricarboxylic acid linker and 64 mM methyltributylammonium methyl sulphate supporting electrolyte.45 The solution was maintained at 55 °C and deaerated with N2 (g) whilst a PGSTAT302N potentiostat (Metrohm Autolab B.V., The Netherlands) was used to apply a fixed potential difference of 2.5 V between the two Cu foil electrodes for one hour. This generated HKUST-1 in solution was collected by centrifugation. The HKUST-1 was then re-suspended in methanol, stirred and collected again by centrifugation before being left to dry. Please refer to the ESI† for MOF preparation protocols and characterisation.
4.5 Kinetic and adsorption isotherms
In a typical procedure 10 mL of 1000 ppm NMP or DMF contaminated water was loaded on 10, 30, 50, 100, 200, 300 and 400 mg adsorbents, the container was sealed, and placed in an incubator shaker at 25 °C and 300 rpm for 24 hours. Samples from the supernatants were taken in order to quantify NMP and DMF. Samples were taken at 0.25, 0.5, 1, 2, 5, 12 and 24 hours to obtain kinetic data.4.6 Adsorbent recovery
Washing and drying methods were evaluated for adsorbent recovery. In a typical washing protocol 200 mg adsorbent saturated with NMP was placed in an SPE cartridge and washed with 2.25 mL of a washing solvent. 150 μL fractions were collected with a flow of 10 mL min−1. The washing solvents were either methanol, water, 50 vol% or 10 vol% methanol in water. In a typical drying or vacuum regeneration procedure 200 mg adsorbent saturated with NMP was placed under 0.01 mbar vacuum at 25 °C for approximately 12 hours. The weight of the adsorbent was measured at given intervals until no more change was observed. Note that using the Cox chart it can be estimated that the boiling points of NMP and DMF are −5 °C and −20 °C, respectively.464.7 Membrane fabrication
Polymer membranes were produced via phase inversion based on the protocol by Campbell et al.47 Dope solutions were formed by dissolving 25 wt% of polyimide P84 in NMP followed by casting on to polypropylene non-woven sheets using a casting knife set to a thickness of 250 μm at a temperature of 20 °C and a humidity of 35–45%. Membranes were cast using an automatic film applicator Elcometer 4340. The polymer membranes were then precipitated from solution via immersion into a water bath (coagulation tank). The membranes were then placed in isopropyl alcohol (IPA) to remove water from the polymer matrix followed by crosslinking with 30 g L−1 solutions of hexane-1,6-diamine in IPA at 50 °C for 24 hours. The crosslinked membranes were subsequently washed with IPA to remove the excess crosslinking agent. To avoid pore collapse, the membranes were conditioned with a PEG400![[thin space (1/6-em)]](https://www.rsc.org/images/entities/char_2009.gif) :
:![[thin space (1/6-em)]](https://www.rsc.org/images/entities/char_2009.gif) IPA (50
IPA (50![[thin space (1/6-em)]](https://www.rsc.org/images/entities/char_2009.gif) :
:![[thin space (1/6-em)]](https://www.rsc.org/images/entities/char_2009.gif) 50 v/v) solution for 4 hours and then dried in air.
50 v/v) solution for 4 hours and then dried in air.
4.8 Membrane performance test
All filtration experiments were carried out at 10 bar using a cross-flow filtration system with an effective membrane area of 52 cm2. The permeance of each membrane was calculated by dividing the acetone flux by the applied pressure. The model system for the solute rejection experiments comprised a mixture of 1 g L−1 PS580 and PS1300 polystyrene markers as well as 0.1 g L−1 of methyl styrene dimer solution in acetone. The rejection (R) of markers was obtained by measuring the concentration of each polystyrene oligomer in the permeate and the feed, and calculating the ratio of the molecules retained by the membrane.4.9 Continuous water treatment
Schematic representation of the continuous adsorption system is shown in Fig. 6A. The system consists of two high pressure pumps (Gilson 305), a feed tank containing the wastewater from the coagulation bath; a wash tank containing methanol![[thin space (1/6-em)]](https://www.rsc.org/images/entities/char_2009.gif) : water (10
: water (10![[thin space (1/6-em)]](https://www.rsc.org/images/entities/char_2009.gif) :
:![[thin space (1/6-em)]](https://www.rsc.org/images/entities/char_2009.gif) 90 v/v) for column regeneration; and a vessel for the purified water and the waste solution; and two adsorption columns wet-packed with 50 g of MIP7. High pressure pumps were used to feed the wastewater and the washing solution at a speed of 25 mL min−1 to the columns in an alternating manner. After the collection of 2.5 L purified water the columns were regenerated using 120 mL washing solution. In total 12.5 L wastewater was purified continuously.
90 v/v) for column regeneration; and a vessel for the purified water and the waste solution; and two adsorption columns wet-packed with 50 g of MIP7. High pressure pumps were used to feed the wastewater and the washing solution at a speed of 25 mL min−1 to the columns in an alternating manner. After the collection of 2.5 L purified water the columns were regenerated using 120 mL washing solution. In total 12.5 L wastewater was purified continuously.
Acknowledgements
We want to thank Elisabeth Davenport, Dr Jozsef Kupai, Luca Szabo and Christos Didaskalou, all from the School of Chemical Engineering & Analytical Science, Manchester for their technical help. The authors thank Peter Halasz from the School of Mechanical, Aerospace and Civil Engineering for his artistic help. We would also like to acknowledge the help of Dr Wayne Harrison from the School of Chemistry, Manchester with the preparation of PIM-1, Stephen Worrall, Raghidah Wagia and Samaila Jovial from the School of Chemistry, Manchester, for provision of the MOF samples and Eurocarb Ltd for providing activated carbon samples. The work described in this paper was partially supported by EPSRC under grant number EP/K016946/1. The authors would also like to thank financial support from the Nano Material Technology Development Program (2012M3A7B4949745), the National Research Foundation of the Korean Ministry of Science, ICT and Future Planning.References
- C. Fritzmann, J. Löwenberg, T. Wintgens and T. Melin, Desalination, 2007, 216(1–3), 1–76 CrossRef CAS PubMed.
- N. S. A. Mutamim, Z. Z. Noor, M. A. A. Hassan and G. Olsson, Desalination, 2012, 305, 1–11 CrossRef CAS PubMed.
- Handbook of membrane separations: chemical, pharmaceutical, food, and biotechnological applications, ed, A. K. Pabby, S. S. H. Rizvi and A. M. S. Requena, CRC press, 2015 Search PubMed.
- C. Jiménez-González, P. Poechlauer, Q. B. Broxterman, B. S. Yang, D. am Ende, J. Baird, C. Bertsch, R. E. Hannah, P. Dell'Orco, H. Noorman, S. Yee, R. Reintjens, A. Wells, V. Massonneau and J. Manley, Org. Process Res. Dev., 2011, 15, 900–911 CrossRef.
- G. Szekely, M. F. Jimenez-Solomon, P. Marchetti, J. F. Kim and A. G. Livingston, Green Chem., 2014, 16, 4440–4473 RSC.
- P. Marchetti, M. F. Jimenez-Solomon, G. Szekely and A. G. Livingston, Chem. Rev., 2014, 114(21), 10735–10806 CrossRef CAS PubMed.
- G. R. Guillen, Y. Pan, M. Li and E. M. V. Hoek, Ind. Eng. Chem. Res., 2011, 50, 3798–3817 CrossRef CAS.
- World Membrane Separation Technologies to 2017 – Demand and Sales Forecasts, Market Share, Market Size, Market Leaders, The Freedonia Group, 2015 (http://www.freedoniagroup.com/World-Membrane-Separation-Technologies.html).
- T. Fane, TCE, July 2013.
- Global Water Intelligence Report, Volume 49, Issue 18, 2013.
- R. W. Baker, Ind. Eng. Chem. Res., 2002, 41, 1393–1411 CrossRef CAS.
- Yano Research Institute, Lithium ion battery material market perspective – four key materials (C54104000), 2012.
- Membrane Technology and Applications, ed. R. W. Baker, Wiley, 2012 Search PubMed.
- T. Schiestel, Membr. Technol., 2015, 2015(6), 1–7 CrossRef.
- D. Y. Xing, S. Y. Chan and T. S. Chung, Chem. Eng. Sci., 2013, 87, 194–203 CrossRef CAS PubMed.
- M. Temtem, D. Pompeu, T. Barroso, J. Fernandes, P. C. Simões, T. Casimiro, A. M. Botelho do Rego and A. Aguiar-Ricardo, Green Chem., 2009, 11, 638–645 RSC.
- N. T. Hassankiadeh, Z. Cui, J. H. Kim, D. W. Shin, S. Y. Lee, A. Sanguineti, V. Arcella, Y. M. Lee and E. Drioli, J. Membr. Sci., 2015, 479, 204–212 CrossRef CAS PubMed.
- A. Figoli, T. Marino, S. Simone, E. Di Nicolo, X.-M. Li, T. He, S. Tornaghi and E. Drioli, Green Chem., 2014, 16, 4034–4059 RSC.
- A. K. Ghosh, B. H. Jeong, X. F. Huang and E. M. V. Hoek, J. Membr. Sci., 2008, 311(1–2), 34–45 CrossRef CAS PubMed.
- W. W. Li, H. Q. Yu and Z. He, Energy Environ. Sci., 2014, 7, 911–924 CAS.
- I. Carra, J. A. S. Pérez, S. Malato, O. Autin, B. Jefferson and P. Jarvis, Chem. Eng. J., 2015, 264, 690–696 CrossRef CAS PubMed.
- L. Fabrizi, B. Jefferson, S. Parsons, A. Wetherill and P. Jarvis, Environ. Sci. Technol., 2010, 44, 6443–6449 CrossRef CAS PubMed.
- J. Wang and B. Chen, Chem. Eng. J., 2015, 281, 379–388 CrossRef CAS PubMed.
- N. B. McKeown and P. M. Budd, Macromolecules, 2010, 43(12), 5163–5176 CrossRef CAS.
- A. Murray and B. Ormeci, Environ. Sci. Pollut. Res. Int., 2012, 19(9), 3820–3830 CrossRef CAS PubMed.
- B. V. de Voorde, B. Bueken, J. Denayer and D. De Vos, Chem. Soc. Rev., 2014, 43, 5766–5788 RSC.
- Handbook of Water and Wastewater Treatment Technology, ed. N. P. Cheremisinoff, CRC Press, 1994 Search PubMed.
- S. Wang and Y. Peng, Chem. Eng. J., 2010, 156, 11–24 CrossRef CAS PubMed.
- K. Y. Foo and B. H. Hameed, Chem. Eng. J., 2010, 156, 2–10 CrossRef CAS PubMed.
- F. Haghseresht and G. Lu, Energy Fuels, 1998, 12, 1100–1107 CrossRef CAS.
- F. Gimbert, N. Morin-Crini, F. Renault, P. M. Badot and G. Crini, J. Hazard. Mater., 2008, 157, 34–46 CrossRef CAS PubMed.
- Y. Luk, C. J. Allender and T. Wirth, Tetrahedron Lett., 2010, 51, 5883–5885 CrossRef CAS PubMed.
- G. Szekely, E. Fritz, J. Bandarra, W. Heggie and B. Sellergren, J. Chromatogr., A, 2012, 1240, 52–58 CrossRef CAS PubMed.
- I. K. Shah, P. Pre and B. J. Alappat, Chem. Sci. Trans., 2013, 2(4), 1078–1088 Search PubMed.
- N. Al-Janabi, P. Hill, L. Torrente-Murciano, A. Garforth, P. Gorgojo, F. Siperstein and X. Fan, Chem. Eng. J., 2015, 281, 669–677 CrossRef CAS PubMed.
- N. Nijem, H. Bluhm, M. L. Ng, M. Kunz, S. R. Leone and M. K. Gilles, Chem. Commun., 2014, 50, 10144–10147 RSC.
- S. Bonyadi and T. S. Chung, J. Membr. Sci., 2009, 331(1–2), 66–74 CrossRef CAS PubMed.
- T. He, M. H. V. Mulder and M. Wessling, J. Appl. Polym. Sci., 2003, 87(13), 2151–2157 CrossRef CAS PubMed.
- Basic Principles of Membrane Technology, ed. M. Mulder, Springer, 1996 Search PubMed.
- B. Sellergren, Molecularly Imprinted Polymers: Man-made Mimics of Antibodies and their Applications in Analytical Chemistry, Elsevier, Amsterdam, 1st edn, 2001 Search PubMed.
- B. Van der Bruggen and P. Luis, Curr. Opin. Chem. Eng., 2014, 4, 47–53 CrossRef PubMed.
- J. F. Kim, G. Szekely, M. Schaepertoens, I. B. Valtcheva, M. F. Jimenez-Solomon and A. G. Livingston, ACS Sustainable Chem. Eng., 2014, 2(10), 2371–2379 CrossRef CAS.
- J. Kupai, E. Rojik, P. Huszthy and G. Szekely, ACS Appl. Mater. Interfaces, 2015, 7, 9516–9525 CAS.
- N. Du, G. P. Robertson, J. Song, I. Pinnau, S. Thomas and M. D. Guiver, Macromolecules, 2008, 41, 9656–9662 CrossRef CAS.
- S. S. Y. Chiu, S. M. F. Lo, J. P. H. Charmant, A. G. Orpen and I. D. Williams, Science, 1999, 283, 1148–1150 CrossRef.
- E. R. Cox, Ind. Eng. Chem., 1923, 15(6), 592–593 CrossRef CAS.
- J. Campbell, G. Szekely, R. P. Davies, D. C. Braddock and A. G. Livingston, J. Mater. Chem. A, 2014, 2(24), 9260–9271 CAS.
Footnotes |
| † Electronic supplementary information (ESI) available. See DOI: 10.1039/c5gc01937k |
| ‡ Authors contributed equally. |
| This journal is © The Royal Society of Chemistry 2015 |

