 Open Access Article
Creative Commons Attribution 3.0 Unported Licence
Size-optimized galactose-capped gold nanoparticles for the colorimetric detection of heat-labile enterotoxin at nanomolar concentrations†
Vivek
Poonthiyil
ab,
Vladimir B.
Golovko
*ab and
Antony J.
Fairbanks
*a
aDepartment of Chemistry, University of Canterbury, Private Bag 4800, Christchurch, 8140, New Zealand. E-mail: vladimir.golovko@canterbury.ac.nz; antony.fairbanks@canterbury.ac.nz
bThe MacDiarmid Institute for Advanced Materials and Nanotechnology, Wellington, 6140, New Zealand
First published on 31st March 2015
Abstract
The development of a galactose-capped gold nanoparticle-based colorimetric sensor for the detection of the lectin heat-labile enterotoxin is reported. Heat-labile enterotoxin is one of the pathogenic agents responsible for the intestinal disease called ‘traveller's diarrhoea’. By means of specific interaction between galactose moieties attached to the surface of gold nanoparticles and receptors on the B-subunit of heat-labile enterotoxin (LTB), the gold nanoparticles reported here act as an efficient colorimetric sensor, which can detect the toxin at nanomolar concentrations. The effect of gold nanoparticle size on the detection sensitivity was investigated in detail. Amongst the various sizes of gold nanoparticles studied (2, 7, 12, and 20 nm), the 12 nm sized gold nanoparticles were found to be the most efficient, with a minimum heat-labile enterotoxin detection concentration of 100 nM. The red to purple colour change of the gold nanoparticle solution occurred within two minutes, indicating rapid toxin sensing.
Introduction
Gold nanoparticle (AuNP) based colorimetric assays have attracted significant interest over the past decade due to their simplicity and potentially wide applicability.1 Facile methods established for binding AuNPs to a wide variety of ligands, their high extinction coefficients, and the distinctive colour changes of AuNP solutions upon aggregation (red to purple/blue) or redispersion of the aggregates (purple/blue to red), make AuNPs an ideal choice as the basis of a colorimetric sensor for a plethora of analytes.2 To date, AuNP based colorimetric sensors have been used to detect alkali and alkaline earth metal ions, heavy metal ions, lanthanides, anions, organic molecules, oligonucleotides and proteins.3Lectins are carbohydrate-binding proteins that are highly specific for sugar moieties. Colorimetric sensors based on glycogold nanoparticles (gAuNPs) [“water-soluble three-dimensional polyvalent model systems based on sugar-modified nanoclusters”]4,5 have been used to detect some toxic lectins such as concanavalin A (ConA),6Ricinus communis agglutinin (RCA120),7,8 cholera toxin,9 and viral hemagglutinin (HA).10
gAuNPs are typically synthesised by attaching saccharides or glycoconjugates to the surface of AuNPs via thiol-terminated linkers. Previous studies have shown that both the length of the linker and the density of the ligands on the gAuNP surface can affect the efficacy of subsequent colorimetric sensing assays.7,8,11–17 Although there have been some reports on the influence of the size of other AuNPs on their performance in colorimetric sensing, there has been no specific study into the effect of gAuNP size on the colorimetric sensing of toxic lectins.18–21
Heat-labile enterotoxin (LT), a lectin secreted by enterotoxigenic Escherichia coli, is one of the pathogenic agents responsible for a form of intestinal disease, commonly called ‘traveller's diarrhoea’, which affects almost all populations worldwide.22 It is a member of the AB5 bacterial toxin family, which also includes cholera toxin, shiga toxin, shiga-like toxin, and pertussis toxin.23 All the AB5 toxins contain a disease causing A subunit, which is symmetrically surrounded by five carbohydrate binding B-subunits.22 The B-subunits of heat-labile enterotoxin (LTB) bind to the ganglioside GM1, which is present on the surface of mammalian intestinal cells. In the GM1 ganglioside, ceramide is linked to the branched pentasaccharide Galβ(1 → 3)GalNAcβ(1 → 4)[Neu5Acα(2 → 3)]Galβ(1 → 4)Glcβ-ceramide (Gal = galactose, Glc = glucose; GalNAc = N-acetylgalactosamine; Neu5Ac = N-acetylneuraminic acid).22 Binding of this pentasaccharide to the carbohydrate recognition domains of LTB is the first step in the entry of the heat-labile enterotoxin into gut cells.22
Crystallographic studies have shown that interaction between GM1 and LTB occurs mainly through the terminal galactose residues of GM1; only minimal interactions have been observed between the N-acetylneuraminic acid of GM1 and LTB.24 The significant contact between LTB and galactose, 79% of which is buried in the binding pocket, explains the high selectivity of LTB for GM1, as compared to other gangliosides.25 X-Ray crystallographic studies of the interaction of LTB with lactose revealed that the high specificity for galactose arises from the fact that every hydrogen-bond acceptor and donor of the galactose unit, other than the ring and anomeric oxygens, is involved in hydrogen bonding.26,27 We, like others in their work on other AB5 toxins,9,28,29 therefore chose galactose as the LTB binding motif in our colorimetric sensing system.
Several methods have already been developed for the detection of heat-labile enterotoxin, with varying minimum detection levels. These include phenotypic assays based on recognition of monoclonal antibodies (MAbs),30–36 genotypic methods based on DNA/DNA hybridization,37 and the use of the polymerase chain reaction (PCR), or real-time PCR techniques.38–40 In particular Yokota et al. have reported that the automatic latex agglutination test is capable of measuring heat-labile enterotoxin at concentrations as low 1 ng mL−1,41 whilst Young et al. have shown that the minimum amount of toxin that could be detected by GM1-ELISA was 7 ng mL−1.42 Piazza et al. reported that either 25 μg mL−1 of an anti-rabbit heat-labile toxin IgG enriched fraction or 10 μg mL−1 of an IgG2B monoclonal antibody allowed the detection of less than 10 ng mL−1 of the toxin.43 Tyler et al. used the Spreeta® surface plasmon resonance sensor and a quartz crystal microbalance, and reported that the minimal amount of toxin that could be detected in this manner was 3 to 6 μg mL−1;44 a level of detection similar to that obtained in this study. However although these methods have high levels of sensitivity and specificity, the majority of them require complex instrumentation and involve protracted operating procedures. More recently, colorimetric sensing of the heat-labile enterotoxin gene was reported by Jyoti et al.45 using thiol-modified oligonucleotide capped AuNPs, indicating the desirability of an operationally straightforward colorimetric assay. To the best of our knowledge, there have been no previous reports on the use of AuNPs stabilized with sugars for the colorimetric detection of heat-labile enterotoxin.
Herein we report the development of a simple and rapid colorimetric sensing system for LTB detection based on thiol-modified galactose capped glycogold nanoparticles (Gal-gAuNPs). We synthesized Gal-gAuNPs of various sizes, containing AuNP metal cores of 2, 7, 12, and 20 nm, using the same linker (thiol-terminated triethylene glycol). These Gal-gAuNPs did not contain additional ‘spectator’ or ‘filler’ ligands, i.e. there was 100% coverage of the gAuNPs with the same ligand, so that the effect of the gAuNP size alone on the performance of these systems in colorimetric sensing could be specifically and systematically studied. Interestingly, we found that 12 nm sized Gal-gAuNPs were more efficient for colorimetric sensing of LTB, a result which indicates that the size of gAuNPs is also an important parameter that should be considered, alongside those of linker-length and the percentage of ligand coverage, in order to construct efficient and optimised colorimetric sensors for toxic lectin detection. The study presented here opens new avenues for the development of an optimised, easy to use, cheap, selective, highly sensitive and rapid sensing platform for the detection of heat-labile enterotoxin.
Results and discussion
Synthesis of the thiol-terminated galactose ligand
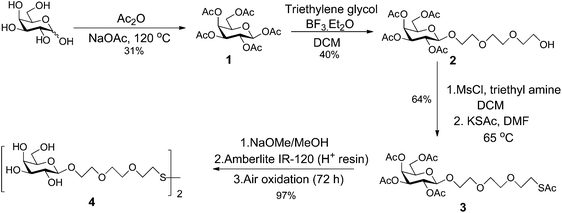
D-Galactose was acetylated by reaction with acetic anhydride (Ac2O) and sodium acetate to give penta-O-acetyl-β-D-galactopyranose 1 (Scheme 1).46,47 Reaction of 1 with triethyleneglycol in the presence of the Lewis acid, BF3·Et2O, afforded the β-triethylene glycol glycoside 2.7 Introduction of sulfur at the terminus of the linker was achieved by reaction of alcohol 2 with mesylchloride (MsCl) and triethylamine in dichloromethane (DCM), to form an intermediate mesylate, that was then reacted with potassium thioacetate in dimethyl formamide (DMF) to afford the thioacetate 3.7 Global deacetylation of 3 by reaction with sodium methoxide, followed by air oxidation afforded the disulfide 4.7 Full experimental details for the synthesis of the ligand, including compound characterisation, are provided in the ESI.†Synthesis and characterization of different sized Gal-gAuNPs
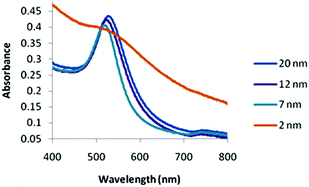
The 2 nm diameter Gal-gAuNPs (Gal-gAuNP-2) were synthesized directly by use of the disulfide 4 as the capping ligand during the reduction of HAuCl4 with sodium borohydride.48,49 The 7 nm (Gal-gAuNP-7), 12 nm (Gal-gAuNP-12) and 20 nm (Gal-gAuNP-20) diameter Gal-gAuNPs were obtained by ligand exchange reactions of citrate-capped AuNPs of 7, 12 and 20 nm respectively.6 Ligand exchange is driven by the higher binding affinity of gold for the thiol than for citrate,14 and the complete disappearance of the characteristic IR bands for citrate (1400 and 1600 cm−1 for the carboxylate and carbonyl groups, see ESI†)50 confirmed that all the citrates were successfully replaced. Whilst the 12 and 20 nm citrate capped AuNPs were synthesized using the standard Turkevich reaction,51 the 7 nm citrate capped AuNPs were synthesized by a modified Turkevich process, involving the reverse addition of a solution of HAuCl4 to a solution of citrate (full details of the synthesis of the Gal-gAuNPs are provided in the experimental section).52 Particle size and size distributions (as demonstrated by TEM) and the UV-Vis absorption spectra of the AuNPs were essentially the same both before and after ligand exchange, indicating that the AuNP cores had not been affected.Analysis of the TEM images of the Gal-gAuNPs (in each case at least 200 particles were measured) revealed the particle sizes to be 2.3 ± 0.5, 7.3 ± 0.9, 12.0 ± 1.7, and 20.3 ± 1.8 nm for Gal-gAuNP-2, Gal-gAuNP-7, Gal-gAuNP-12 and Gal-gAuNP-20 respectively (Fig. 1). It is known that as AuNPs increase in size, the corresponding surface plasmon resonance (SPR) peaks in the UV-Vis absorption spectra shift toward longer wavelengths.53 Here, the absorption maxima for Gal-gAuNP-7, Gal-gAuNP-12 and Gal-gAuNP-20 were found to be 518, 523 and 527 nm respectively (Fig. 2) whilst Gal-gAuNP-2 had an absorption shoulder at 506 nm. ESI-MS and FT-IR analysis (see ESI†) also confirmed that the galactose ligands were successfully incorporated. The average molecular formula of the Gal-gAuNPs was determined through TGA, and was also confirmed by elemental analysis (ESI†). The average molecular formulae were found to be Au377(C12H24O8S)162, Au12060(C12H24O8S)2181, Au53568(C12H24O8S)3074, and Au259328(C12H24O8S)9761 for Gal-gAuNP-2, Gal-gAuNP-7, Gal-gAuNP-12 and Gal-gAuNP-20 respectively.4,54 Details of the average molecular formulae calculations are provided in the ESI.†
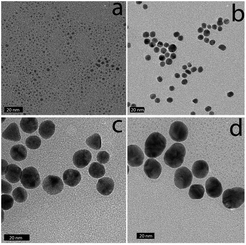 | ||
| Fig. 1 Representative TEM images of Gal-gAuNPs: (a) Gal-gAuNP-2, (b) Gal-gAuNP-7, (c) Gal-gAuNP-12, and (d) Gal-gAuNP-20. The scale bar is 20 nm. | ||
Gal-gAuNP aggregation in the presence of LTB
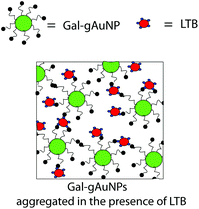
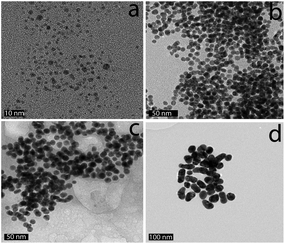
A pictoral representation of the LTB-induced aggregation of Gal-gAuNPs, based on previous reports on related analyte-induced aggregation-effected sensors,2,9 is depicted in Fig. 3. The performance of a gAuNP-based colorimetric sensing system depends on how efficiently the gAuNP dispersion is converted to gAuNP aggregates by the analyte of interest. In general, gAuNPs are stabilized against attractive van der Waals forces by the steric effects of the surface capping ligands; in this study the thiol-terminated galactose ligands.1 Aggregation of gAuNPs can be achieved in two ways – either via interparticle crosslinking or via non-crosslinking.1Interparticle crosslinking aggregation can be postulated as the basis of the sensing response reported here; controlled aggregation of the Gal-gAuNPs occurs because of binding of the multiple galactose recognition domains present in LTB, to the galactose moieties present on the Gal-gAuNPs.22 TEM analysis (Fig. 4b–d) clearly shows that, following the addition of LTB, the Gal-gAuNPs were no longer present as individual particles, but had assembled into networks of aggregated NPs, except in the case of Gal-gAuNP-2 (Fig. 4a). LTB detection is possible with the naked eye as the colour of the colloidal solution changes from ruby red to purple upon Gal-gAuNP aggregation (Fig. 5).
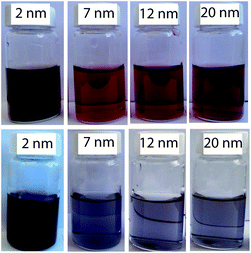 | ||
| Fig. 5 Gal-gAuNPs of various sizes before (top row) and after (bottom row) the addition of LTB (600 nM). | ||
The effect of Gal-gAuNP size on the efficacy of colorimetric detection of LTB
To investigate the effect of the size of the Gal-gAuNPs on the colorimetric detection of LTB, experiments were carried out using a series of Gal-gAuNPs with particle sizes 2, 7, 12 and 20 nm. Interestingly, it was found from both TEM and UV-Vis studies that Gal-gAuNP-2 did not undergo any aggregation upon the addition of LTB; hence Gal-gAuNP-2 is not suitable for the colorimetric sensing of LTB. However in the cases of the 7, 12, and 20 nm diameter Gal-gAuNPs a correlation was observed between the concentration of the LTB that was added, and the degree of Gal-gAuNP aggregation. In these cases both the red-shift and the intensity of the SPR peak increased with increasing amounts of LTB due to the formation of larger Gal-gAuNP aggregates.6As shown in Fig. 6a, the original SPR peak of Gal-gAuNP-7, centred at 518 nm, did not undergo a significant shift when LTB was added to give final LTB concentrations of either 150 or 300 nM. However when the final LTB concentration was increased to 450 nM, the SPR peak shifted to 536 nm and the solution turned purple, indicating significant aggregation of the Gal-gAuNPs. When the LTB concentration was increased further to 600 nM, an even more pronounced red-shift was observed, and the SPR maximum moved to 542 nm. Kinetic studies of these reactions were also carried out by monitoring the time dependence of changes in the absorption at 620 nm (Fig. 6b).7,9 At final LTB concentrations of 450 and 600 nM, 95% of the total increase in absorbance (I95) occurred within two minutes, whilst 99% of the total increase (I99) occurred within 5 minutes, indicating that aggregation of the Gal-gAuNPs is relatively fast, and that rapid detection of LTB is possible by this method.
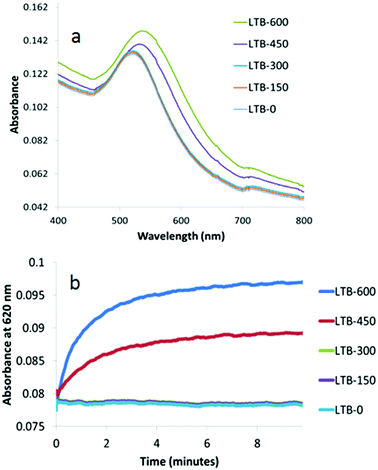 | ||
| Fig. 6 UV-Vis absorption spectra of Gal-gAuNP-7: (a) with varying nM concentrations of LTB (each spectrum was recorded 10 min after mixing with LTB) and (b) time dependence of absorbance at 620 nm. | ||
With Gal-gAuNP-12 (Fig. 7a), aggregation was even observed after the addition of only 150 nM LTB. Therefore even lower LTB concentrations were applied in order to determine the minimum detection limit of LTB by Gal-gAuNP-12. Although no SPR peak shift was observed using 50 nM LTB, at 100 nM a shift in the SPR peak was observed from 523 to 528 nm. These results indicate that Gal-gAuNP-12 is more effective than the Gal-gAuNP-7 for the colorimetric detection of LTB. With Gal-gAuNP-12, when the LTB concentration was increased from 150 to 600 nm, the SPR maxima shifted gradually from 533 to 557 nm, indicating increased aggregation. Kinetic studies of Gal-gAuNP-12 aggregation (Fig. 7b), again involving monitoring the absorbance at 620 nm, revealed that I95 occurred within 2 minutes and that I99 occurred within 4.5 minutes at all LTB concentrations investigated (100–600 nM).
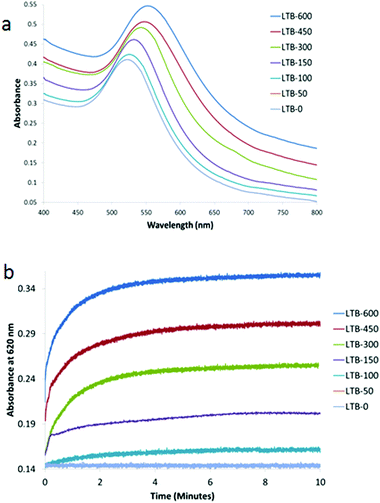 | ||
| Fig. 7 UV-Vis absorption spectra of Gal-gAuNP-12: (a) with varying nm concentrations of LTB (each spectrum was recorded 10 min after mixing with LTB) and (b) time dependence of absorbance at 620 nM. | ||
When the size of the Gal-gAuNPs was further increased to 20 nm, the minimum concentration of LTB required to produce a red-shift of the SPR maximum was found to be 300 nM, i.e. a higher LTB concentration than was required for Gal-gAuNP-12, but lower than for Gal-gAuNP-7 (Fig. 8a). Kinetic data obtained for Gal-gAuNP-20 are shown in Fig. 8b; similarly to the cases of both Gal-gAuNP-7 and Gal-gAuNP-12, I95 occurred within two minutes, and I99 occurred within 5 minutes.
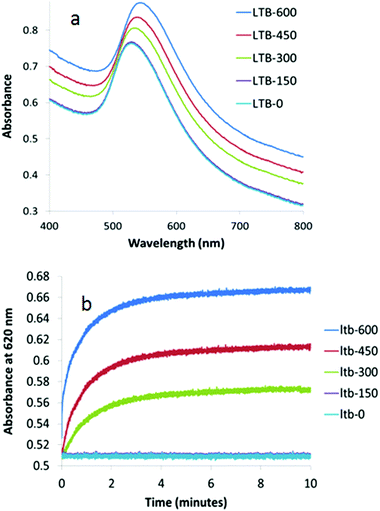 | ||
| Fig. 8 UV-Vis absorption spectra of Gal-gAuNP-20: (a) with varying nm concentrations of LTB (each spectrum was recorded 10 min after mixing with LTB) and (b) time dependence of absorbance at 620 nM. | ||
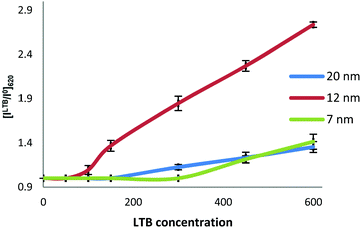
To further understand the size-dependence of LTB detection by the Gal-gAuNPs, the ratio of the absorbance intensity measured at 620 nm with and without LTB ([ILTB/I0]620) was plotted against the LTB concentration for all of the Gal-gAuNPs (Fig. 9). These data show that Gal-gAuNP-12 is not only capable of detecting LTB at much lower concentrations, but also that the increase in absorbance intensity that is observed as the LTB concentration is increased is much higher for Gal-gAuNP-12 as compared to the other Gal-gAuNPs.
In the cases of the 7, 12, and 20 nm Gal-gAuNPs the NP concentration used for the colorimetric study was 10 nM. In the case of Gal-gAuNP-2 a much higher NP concentration (1 μM) was required because at a AuNP concentration of 10 nM absorption by the colloid was too low to be detected by the UV-Vis spectrometer; this is due to a combination of the significantly lower total amount of Au present, and a low extinction coefficient, which decreases as particle size decreases.55,56 At the much higher concentration of 1 μM, it was anticipated that a higher concentration of LTB would be required to aggregate Gal-gAuNP-2. However even with a correspondingly higher concentration of LTB (10 μM, i.e. the same overall molar ratio which caused the onset of the SPR shift for Gal-gAuNP-12), no shift in the SPR peak was observed, and TEM (Fig. 4a) confirmed that the Gal-gAuNP-2 had not aggregated in the presence of LTB. Moreover the 2 nm Gal-gAuNPs nanoparticles are not ideally suited to colorimetric sensing since they fall at the borderline of non-metallic/metallic nanoparticles; as a result they have a shoulder peak instead of a prominent SPR peak in their UV-Vis spectrum (Fig. 2).57,58 The precise reason why Gal-gAuNP-12 is more effective at detecting LTB than either Gal-gAuNP-7 or Gal-gAuNP-20 is not yet clear, and further investigations are required in order to adequately explain this finding. Furthermore, whether this size-related phenomenon (see ESI†) is specific to this particular toxin, or is dependent on the spatial arrangement of the different carbohydrate-binding sub-units of the toxin, also remains to be demonstrated.
Stability and selectivity of nanoparticles
In order to demonstrate the selectivity of toxin detection aliquots of a Gal-gAuNP-12 solution were mixed with Bovine Serum Albumin (BSA, aqueous solutions of 300–1200 nM), the lectins Concanavalin A and Hemagglutinin (aqueous solutions of 600 nM), and a variety of metal ions and anions (K+, Na+, Ca2+, Mg2+, Cl−, NO3−, HCO3−, SO42−, PO43−, all at a concentration of 100 μM). It was found that none of these species had any effect on either the UV-Vis absorption spectrum or the colour of the Gal-gAuNP-12 solution, confirming that the Gal-gAuNPs did not undergo non-specific aggregation, and that amongst the species investigated the detection was selective for LTB. Furthermore the Gal-gAuNPs were found to be stable in an electrolyte solution (a solution containing Cl− at 100 mM, Na+ at 135 mM, K+ at 15 mM, and HCO3− at 45 mM) that was selected to mimic the typical ‘watery stool’ of diarrhoea patients.59–61Gal-gAuNP-12 was then used to detect LTB in this electrolyte solution. A plot of the absorbance intensity at 620 nm vs. LTB concentration (Fig. 10) shows that in the electrolyte solution the minimum concentration required for the change in the absorbance at 620 nm was also found to be 100 nM; a similar result to that shown in Fig. 7. Thus the AuNP sensor developed here was also effective in an ionic environment that was deemed typical of a clinical sample. Finally Gal-gAuNPs were found to be stable at least for three months at 4 °C; they gave essentially indistinguishable results when used for the detection of LTB after being stored for this time period.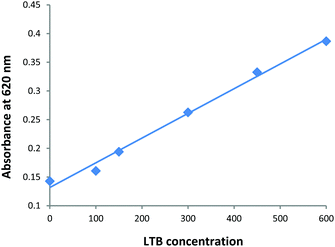 | ||
| Fig. 10 Plot of the absorbance intensity at 620 nm vs. LTB concentration (nM) for Gal-gAuNP-12 in an electrolyte solution selected to mimic the watery stool of diarrhea patients. | ||
Conclusions
It has been demonstrated that Gal-gAuNPs can be used for the simple and rapid colorimetric detection of LTB at nanomolar concentrations. A series of Gal-gAuNPs of different sizes (2, 7, 12, and 20 nm) were synthesized and assayed for their ability to detect LTB. The presence of multiple binding sites on LTB, together with the specific binding of these receptors to galactose units attached to the Gal-gAuNPs, caused nanoparticle aggregation as the basis for LTB detection. The 2 nm Gal-gAuNPs did not aggregate in the presence of LTB, and did not show any shift in the surface plasmon band. However, as the size of the nanoparticles was increased from 7 to 12 and then to 20 nm, the colorimetric detection level of LTB at first improved from 450 nM down to 100 nM and then declined to 300 nM, indicating that the optimal size for Gal-gAuNPs for the colorimetric detection of LTB is 12 nm. Kinetic studies revealed that the response developed within 2 minutes after the addition of LTB. Furthermore the Gal-gAuNPs did not undergo any non-specific aggregation in the presence of bovine serum albumin, the lectins concanavalin and hemagglutinin, or various ions. The Gal-gAuNP-based colorimetric sensor reported here should allow the development of a size-optimised, easy to use, cheap, selective, highly sensitive and fast sensing platform for the detection of heat-labile enterotoxin.Experimental section
Reagents
Water used throughout this study was purified by a Milli-Q system (Millipore). Au metal (99.99%), trisodium citrate, NaBH4 and Concanavalin A (isolated from jack bean, Canavalia ensifromis) were purchased from Sigma-Aldrich. The heat-labile enterotoxin B-subunit was purchased from Reagent Proteins (San Diego, USA). Recombinant influenza A virus H1N1 hemagglutinin (A/California/04/2009) was purchased from Sino Biological Inc. (Beijing, China). Tetrachloroauric(III) acid trihydrate (HAuCl4·3H2O) was prepared following literature procedures.62 All other reagents and solvents were analytical grade, and were used without further purification.Instrumentation
Infrared spectra were recorded on a Perkin-Elmer Spectrum One. Proton nuclear magnetic resonance (δH) spectra were recorded on Agilent Technologies 400 MR (400 MHz) or Varian VNMR500 (500 MHz) spectrometers. All chemical shifts are quoted on the δ-scale in ppm using residual solvent as an internal standard. High-resolution mass spectra were recorded with a BrukermaXis 3G UHR-TOF mass spectrometer. Thermogravimetric analysis (TGA) was performed with an Alphatech SDT Q600 TGA/DSC apparatus, on 6–8 mg of purified, dry materials (the sample holder used was alumina crucible), under N2 (with a flow rate of 50 mL min−1), recording data from 25 to 1000 °C at a heating rate of 10 °C min−1. Elemental analyses were performed by the Campbell Microanalytical Laboratory at the University of Otago. TEM images of AuNPs were obtained using a Philips CM200 TEM operating at 200 kV. Samples for TEM imaging were prepared by dropping 2 μL of a freshly prepared solution of nanostructured Au onto a carbon-coated copper grid (300 mesh) and drying at room temperature. UV-Vis absorption spectra and kinetic measurements were performed using a Varian Cary 100 UV-Vis spectrophotometer.Colorimetric bioassay for LTB using Gal-gAuNPs
Purified Gal-gAuNPs were freeze-dried, and then re-suspended in phosphate buffer (10 mM, pH 7.2) to give a nanoparticle concentration of 10 nM. A series of solutions with a range of LTB concentrations (300, 600, 900 and 1200 nM) were prepared separately in Milli-Q water. Then, an aliquot of each of the LTB solutions (150 μl) was added (with mixing) to an aliquot of the Gal-gAuNP solution (150 μl), and the progress of the reaction was monitored by UV-Vis spectroscopy, recording the absorption at 620 nm prior to recording of the whole UV-vis absorbance spectrum. Aliquots of the Gal-gAuNP solution were also mixed with bovine serum albumin (BSA, aqueous solutions of 300–1200 nM) and a variety of metal ions and anions (K+, Na+, Ca2+, Mg2+, Cl−, NO3−, HCO3−, SO42−, PO43−, all at a concentration of 100 μM) to confirm that the Gal-gAuNPs did not undergo non-specific aggregation and also with Con A and Hemagglutinin (each 600 nM) to confirm that the particles were selective only towards LTB. Additionally, an electrolyte that mimicked the typical watery stool of diarrhea patients, namely a solution containing Cl− at 100 mM, Na+ at 135 mM, K+ at 15 mM, and HCO3− at 45 mM,59–61 was prepared to test the stability and the efficiency of toxin detection of the Gal-gAuNPs.Synthesis of thiol-modified galactose stabilized gold nanoparticles (Gal-gAuNPs) of various sizes
![[thin space (1/6-em)]](https://www.rsc.org/images/entities/char_2009.gif) 000, 1 h, 5000 rpm). The addition of 10 mL of Milli-Q water and centrifugal filtration was repeated until the NPs were free of salts and starting material (as seen by the absence of signals arising from disulfide 4 in the 1H NMR spectrum). The residue was then dissolved in water (2 mL) and lyophilized to obtain Gal-gAuNP-2. TEM: 2.3 ± 0.5 nm; IR (KBr): 3300 (broad band), 2933, 2873, 1062 cm−1; UV: 508 nm; TGA: ligand 41.6%, Au 58.4%; elemental analysis found: C, 18.23; H, 3.31; S, 4.32. Calc. for Au377(C12H24O8S)162: C, 18.3; H, 3.08; S, 4.08%; HRMS (ESI) Calcd For C24H46O16S2 (MNa+) 677.2119. Found 677.2133.
000, 1 h, 5000 rpm). The addition of 10 mL of Milli-Q water and centrifugal filtration was repeated until the NPs were free of salts and starting material (as seen by the absence of signals arising from disulfide 4 in the 1H NMR spectrum). The residue was then dissolved in water (2 mL) and lyophilized to obtain Gal-gAuNP-2. TEM: 2.3 ± 0.5 nm; IR (KBr): 3300 (broad band), 2933, 2873, 1062 cm−1; UV: 508 nm; TGA: ligand 41.6%, Au 58.4%; elemental analysis found: C, 18.23; H, 3.31; S, 4.32. Calc. for Au377(C12H24O8S)162: C, 18.3; H, 3.08; S, 4.08%; HRMS (ESI) Calcd For C24H46O16S2 (MNa+) 677.2119. Found 677.2133.
![[thin space (1/6-em)]](https://www.rsc.org/images/entities/char_2009.gif) 000, 1 h, 5000 rpm). The residue was then dissolved in water (2 mL) and lyophilized to obtain Gal-gAuNP-7. TEM: 7.3 ± 0.9 nm; IR (KBr): 3300 (broad band), 2933, 2873, 1062 cm−1; UV: 517 nm; TGA: ligand 23.1%, Au 76.9%; elemental analysis found: C, 10.21; H, 1.49; S, 2.37. Calc. for Au12060(C12H24O8S)2181: C, 10.16; H, 1.62; S, 2.26%; HRMS (ESI) Calcd For C24H46O16S2 (MNa+) 677.2119. Found 677.2121.
000, 1 h, 5000 rpm). The residue was then dissolved in water (2 mL) and lyophilized to obtain Gal-gAuNP-7. TEM: 7.3 ± 0.9 nm; IR (KBr): 3300 (broad band), 2933, 2873, 1062 cm−1; UV: 517 nm; TGA: ligand 23.1%, Au 76.9%; elemental analysis found: C, 10.21; H, 1.49; S, 2.37. Calc. for Au12060(C12H24O8S)2181: C, 10.16; H, 1.62; S, 2.26%; HRMS (ESI) Calcd For C24H46O16S2 (MNa+) 677.2119. Found 677.2121.
![[thin space (1/6-em)]](https://www.rsc.org/images/entities/char_2009.gif) 000, 1 h, 5000 rpm). The residue was then dissolved in water (2 mL) and lyophilized to obtain Gal-gAuNP-12. TEM: 12.0 ± 1.7 nm; IR (KBr): 3300 (broad band), 2933, 2873, 1062 cm−1; UV: 523 nm; TGA: ligand 8.70%, Au 91.3%; elemental analysis found: C, 4.06; H, 0.64; S 0.97. Calc. for Au53568(C12H24O8S)3074: C, 4.15; H, 0.64; S, 0.92%; HRMS (ESI) Calcd For C24H46O16S2 (MNa+) 677.2119. Found 677.2121.
000, 1 h, 5000 rpm). The residue was then dissolved in water (2 mL) and lyophilized to obtain Gal-gAuNP-12. TEM: 12.0 ± 1.7 nm; IR (KBr): 3300 (broad band), 2933, 2873, 1062 cm−1; UV: 523 nm; TGA: ligand 8.70%, Au 91.3%; elemental analysis found: C, 4.06; H, 0.64; S 0.97. Calc. for Au53568(C12H24O8S)3074: C, 4.15; H, 0.64; S, 0.92%; HRMS (ESI) Calcd For C24H46O16S2 (MNa+) 677.2119. Found 677.2121.
![[thin space (1/6-em)]](https://www.rsc.org/images/entities/char_2009.gif) 7 (81 mg, 0.12 mmol) was added. The reaction was then stirred for 48 h at rt. The reaction mixture was concentrated in vacuo, the residue was dissolved in Milli-Q water (10 mL), and then purified by centrifugal filtering (Amicon Ultra 10K, Millipore, MWCO = 10
7 (81 mg, 0.12 mmol) was added. The reaction was then stirred for 48 h at rt. The reaction mixture was concentrated in vacuo, the residue was dissolved in Milli-Q water (10 mL), and then purified by centrifugal filtering (Amicon Ultra 10K, Millipore, MWCO = 10![[thin space (1/6-em)]](https://www.rsc.org/images/entities/char_2009.gif) 000, 1 h, 5000 rpm). The residue was then dissolved in water (2 mL) and lyophilized to obtain Gal-gAuNP-20. TEM: 20.3 ± 1.8 nm; IR (KBr): 3300 (broad band), 2933, 2873, 1062 cm−1; UV: 527 nm; TGA: ligand 5.90 wt%, Au 94.10 wt%; elemental analysis found: C, 2.58; H, 0.41; S, 0.58. Calc. for Au53568(C12H24O8S)3074: C, 2.58; H, 0.42; S, 0.57%; HRMS (ESI) Calcd For C24H46O16S2 (MNa+) 677.2119. Found 677.2118.
000, 1 h, 5000 rpm). The residue was then dissolved in water (2 mL) and lyophilized to obtain Gal-gAuNP-20. TEM: 20.3 ± 1.8 nm; IR (KBr): 3300 (broad band), 2933, 2873, 1062 cm−1; UV: 527 nm; TGA: ligand 5.90 wt%, Au 94.10 wt%; elemental analysis found: C, 2.58; H, 0.41; S, 0.58. Calc. for Au53568(C12H24O8S)3074: C, 2.58; H, 0.42; S, 0.57%; HRMS (ESI) Calcd For C24H46O16S2 (MNa+) 677.2119. Found 677.2118.
Acknowledgements
The authors thank Professor Milo Kral, Mike Flaws (TEM), and Alistair Duff (AAS) for technical assistance. Financial support is gratefully acknowledged from the University of Canterbury (PhD scholarship to VP), and the MacDiarmid Institute.Notes and references
- W. Zhao, M. A. Brook and Y. Li, ChemBioChem, 2008, 9, 2363–2371 CrossRef CAS PubMed.
- M. J. Marin, C. L. Schofield, R. A. Field and D. A. Russell, Analyst, 2015, 140, 59–70 RSC.
- K. Saha, S. S. Agasti, C. Kim, X. Li and V. M. Rotello, Chem. Rev., 2012, 112, 2739–2779 CrossRef CAS PubMed.
- J. de La Fuente, A. Barrientos, T. Rojas, J. Rojo, J. Canada, A. Fernandez and S. Penades, Angew. Chem., Int. Ed., 2001, 40, 2257 CrossRef.
- D. Horton, Advances in Carbohydrate Chemistry and Biochemsitry, Academic Press, 2010 Search PubMed.
- D. C. Hone, A. H. Haines and D. A. Russell, Langmuir, 2003, 19, 7141–7144 CrossRef CAS.
- C. L. Schofield, B. Mukhopadhyay, S. M. Hardy, M. B. McDonnell, R. A. Field and D. A. Russell, Analyst, 2008, 133, 626–634 RSC.
- H. Otsuka, Y. Akiyama, Y. Nagasaki and K. Kataoka, J. Am. Chem. Soc., 2001, 123, 8226–8230 CrossRef CAS PubMed.
- C. L. Schofield, R. A. Field and D. A. Russell, Anal. Chem., 2007, 79, 1356–1361 CrossRef CAS PubMed.
- J. Wei, L. Zheng, X. Lv, Y. Bi, W. Chen, W. Zhang, Y. Shi, L. Zhao, X. Sun and F. Wang, ACS Nano, 2014, 8, 4600–4607 CrossRef CAS PubMed.
- J. J. Storhoff, A. A. Lazarides, R. C. Mucic, C. A. Mirkin, R. L. Letsinger and G. C. Schatz, J. Am. Chem. Soc., 2000, 122, 4640–4650 CrossRef CAS.
- A. J. Reynolds, A. H. Haines and D. A. Russell, Langmuir, 2006, 22, 1156–1163 CrossRef CAS PubMed.
- X. Wang, O. Ramström and M. Yan, Anal. Chem., 2010, 82, 9082–9089 CrossRef CAS PubMed.
- M. Marradi, F. Chiodo, I. Garcia and S. Penades, Chem. Soc. Rev., 2013, 42, 4728–4745 RSC.
- S. Takae, Y. Akiyama, H. Otsuka, T. Nakamura, Y. Nagasaki and K. Kataoka, Biomacromolecules, 2005, 6, 818–824 CrossRef CAS PubMed.
- J. M. Bergen, H. A. von Recum, T. T. Goodman, A. P. Massey and S. H. Pun, Macromol. Biosci., 2006, 6, 506–516 CrossRef CAS PubMed.
- M. J. Marin, A. Rashid, M. Rejzek, S. A. Fairhurst, S. A. Wharton, S. R. Martin, J. W. McCauley, T. Wileman, R. A. Field and D. A. Russell, Org. Biomol. Chem., 2013, 11, 7101–7107 CAS.
- S. Zeng, M. Cai, H. Liang and J. Hao, Anal. Methods, 2012, 4, 2499–2505 RSC.
- Ž. Krpetić, L. Guerrini, I. A. Larmour, J. Reglinski, K. Faulds and D. Graham, Small, 2012, 8, 707–714 CrossRef PubMed.
- K. Niikura, K. Nagakawa, N. Ohtake, T. Suzuki, Y. Matsuo, H. Sawa and K. Ijiro, Bioconjugate Chem., 2009, 20, 1848–1852 CrossRef CAS PubMed.
- S.-J. Richards, E. Fullam, G. S. Besra and M. I. Gibson, J. Mater. Chem. B, 2014, 2, 1490–1498 RSC.
- B. Mudrak and M. J. Kuehn, Toxins, 2010, 2, 1445–1470 CrossRef CAS PubMed.
- E. A. Merritt and W. Hol, Curr. Opin. Struct. Biol., 1995, 5, 165–171 CrossRef CAS.
- T. K. Sixma, S. E. Pronk, K. H. Kalk, E. S. Wartna, B. A. van Zanten, B. Witholt and W. G. Hoi, Nature, 1991, 351, 317–377 CrossRef PubMed.
- F. Van Den Akker, I. K. Feil, C. Roach, A. A. Platas, E. A. Merritt and W. G. J. Hol, Protein Sci., 1997, 6, 2644–2649 CrossRef CAS PubMed.
- T. Sixma, S. Pronk, K. Kalk and B. van Zanten, Nature, 1992, 365, 561–564 CrossRef PubMed.
- E. A. Merritt, S. Sarfaty, I. K. Feil and W. G. Hol, Structure, 1997, 5, 1485–1499 CrossRef CAS.
- A. A. Kulkarni, C. Fuller, H. Korman, A. A. Weiss and S. S. Iyer, Bioconjugate Chem., 2010, 21, 1486–1493 CrossRef CAS PubMed.
- Y. Y. Chien, M. D. Jan, A. K. Adak, H. C. Tzeng, Y. P. Lin, Y. J. Chen, K. T. Wang, C. T. Chen, C. C. Chen and C. C. Lin, ChemBioChem, 2008, 9, 1100–1109 CrossRef CAS PubMed.
- N. Binsztein, M. Jouve, G. Viboud, L. L. Moral, M. Rivas, I. Orskov, C. Ahren and A. Svennerholm, J. Clin. Microbiol., 1991, 29, 1893–1898 CAS.
- Y. Lopez-Vidal, P. Klemm and A. Svennerholm, J. Clin. Microbiol., 1988, 26, 1967–1972 CAS.
- Y. Lopez-Vidal and A. Svennerholm, J. Clin. Microbiol., 1990, 28, 1906–1912 CAS.
- F. Qadri, S. K. Das, A. Faruque, G. J. Fuchs, M. J. Albert, R. B. Sack and A.-M. Svennerholm, J. Clin. Microbiol., 2000, 38, 27–31 CAS.
- A. Svennerholm and G. Wiklund, J. Clin. Microbiol., 1983, 17, 596–600 CAS.
- A. Svennerholm, M. Wikström, M. Lindblad and J. Holmgren, J. Clin. Microbiol., 1986, 24, 585–590 CAS.
- G. I. Viboud, N. Binsztein and A. Svennerholm, J. Clin. Microbiol., 1993, 31, 558–564 CAS.
- H. Steinsland, P. Valentiner-Branth, H. Grewal, W. Gaastra, K. å. Mølbak and H. Sommerfelt, Diagn. Microbiol. Infect. Dis., 2003, 45, 97–105 CrossRef CAS.
- U. Reischl, M. T. Youssef, H. Wolf, E. Hyytia-Trees and N. A. Strockbine, J. Clin. Microbiol., 2004, 42, 4092–4100 CrossRef CAS PubMed.
- R. Vidal, M. Vidal, R. Lagos, M. Levine and V. Prado, J. Clin. Microbiol., 2004, 42, 1787–1789 CrossRef CAS.
- Å. Sjöling, G. Wiklund, S. Savarino, D. Cohen and A.-M. Svennerholm, J. Clin. Microbiol., 2007, 45, 3295–3301 CrossRef PubMed.
- T. Ito, S. Kuwahara and T. Yokota, J. Clin. Microbiol., 1983, 17, 7–12 CAS.
- P. A. Ristaino, M. M. Levine and C. R. Young, J. Clin. Microbiol., 1983, 18, 808–815 CAS.
- C. A. Menezes, S. Y. Imamura, L. R. Trabulsi, A. Fernandes-Filho, M. B. Martinez, B. E. Guth, D. M. Girão and R. M. Piazza, Mem. Inst. Oswaldo Cruz, 2006, 101, 875–880 CAS.
- B. D. Spangler, E. A. Wilkinson, J. T. Murphy and B. J. Tyler, Anal. Chim. Acta, 2001, 444, 149–161 CrossRef CAS.
- A. Jyoti, S. P. Singh, M. Yashpal, P. D. Dwivedi and R. Shanker, J. Biomed. Nanotechnol., 2011, 7, 170–171 CrossRef CAS PubMed.
- M. L. Wolfrom, A. Thompson and M. Inatome, J. Am. Chem. Soc., 1957, 79, 3868–3871 CrossRef CAS.
- Z. Liu, H.-S. Byun and R. Bittman, Org. Lett., 2010, 12, 2974–2977 CrossRef CAS PubMed.
- J. M. de la Fuente, A. G. Barrientos, T. C. Rojas, J. Rojo, J. Cañada, A. Fernández and S. Penadés, Angew. Chem., Int. Ed., 2001, 40, 2257–2261 CrossRef.
- Á. G. Barrientos, J. M. de la Fuente, T. C. Rojas, A. Fernández and S. Penadés, Chem. – Eur. J., 2003, 9, 1909–1921 CrossRef PubMed.
- S.-Y. Lin, S.-W. Liu, C.-M. Lin and C.-h. Chen, Anal. Chem., 2001, 74, 330–335 CrossRef.
- G. Frens, Nature Phys. Sci., 1973, 241, 20 CrossRef CAS.
- S. K. Sivaraman, S. Kumar and V. Santhanam, J. Colloid Interface Sci., 2011, 361, 543–547 CrossRef CAS PubMed.
- W. Haiss, N. T. K. Thanh, J. Aveyard and D. G. Fernig, Anal. Chem., 2007, 79, 4215–4221 CrossRef CAS PubMed.
- K. Huang, H. Ma, J. Liu, S. Huo, A. Kumar, T. Wei, X. Zhang, S. Jin, Y. Gan and P. C. Wang, ACS Nano, 2012, 6, 4483–4493 CrossRef CAS PubMed.
- X. Liu, M. Atwater, J. Wang and Q. Huo, Colloids Surf., B, 2007, 58, 3–7 CrossRef CAS PubMed.
- P. K. Jain, K. S. Lee, I. H. El-Sayed and M. A. El-Sayed, J. Phys. Chem. B, 2006, 110, 7238–7248 CrossRef CAS PubMed.
- G. C. Bond and D. T. Thompson, Catal. Rev., 1999, 41, 319–388 CAS.
- M. Turner, V. B. Golovko, O. P. H. Vaughan, P. Abdulkin, A. Berenguer-Murcia, M. S. Tikhov, B. F. G. Johnson and R. M. Lambert, Nature, 2008, 454, 981–983 CrossRef CAS PubMed.
- B. D. Spangler, Microbiol. Rev., 1992, 56, 622–647 CAS.
- J. B. Kaper, J. G. Morris and M. M. Levine, Clin. Microbiol. Rev., 1995, 8, 48–86 CAS.
- M. Fais, R. Karamanska, S. Allman, S. A. Fairhurst, P. Innocenti, A. J. Fairbanks, T. J. Donohoe, B. G. Davis, D. A. Russell and R. A. Field, Chem. Sci., 2011, 2, 1952–1959 RSC.
- J. Brawer, Handbook of Preperative Inorganic Chemistry, Academic Press, New York, 1963 Search PubMed.
Footnote |
| † Electronic supplementary information (ESI) available: The detailed synthesis of the thiol-terminated galactose ligand, FT-IR and TGA results of the Gal-gAuNPs, the average molecular formula calculations of the Gal-gAuNPs, and the size distribution of the particles of all the Au nanosystems. See DOI: 10.1039/c5ob00447k |
| This journal is © The Royal Society of Chemistry 2015 |

