Development of a chemically sensitive online SEC detector based on FTIR spectroscopy†
Timo F.
Beskers
ab,
Thorsten
Hofe
b and
Manfred
Wilhelm
*a
aInstitute for Chemical Technology and Polymer Chemistry, Karlsruhe Institute of Technology (KIT), Engesserstraße 18, 76131 Karlsruhe, Germany. E-mail: manfred.wilhelm@kit.edu; Tel: +49 721 608 43150
bPSS Polymer Standards Service GmbH, In der Dalheimer Wiese 5, 55120 Mainz, Germany
First published on 30th September 2014
Abstract
Polymer materials are becoming more complex and require increasingly sophisticated analysis methods. The development of coupled techniques, especially SEC and molecular spectroscopy, is one approach to meet this need. In this report, the technical realization of a new FTIR spectroscopy and SEC coupling, where the FTIR serves as a true online detector is described. The basic idea is to measure FTIR spectra online with the highest possible sensitivity and then use a mathematical approach to subtract the solvent signals, reduce drifts and minimize noise. This publication describes in detail how this method was optimized including the most important demands on the spectrometer and other required equipment, e.g. the custom designed flow cells. The applied data treatment, which is called “solvent suppression”, and a guide to interpretation of the data are explained in detail. Several application examples demonstrate not only the potential of the method, but also clarify the current limits. It is shown that FTIR spectroscopy can successfully be used as an online detection method for SEC to provide detailed chemical information as a function of the elution volume, respectively molecular weight, for basically any polymer in any isocratic solvent. It is also shown that minor components down to ca. 5 mol% can be detected.
Introduction
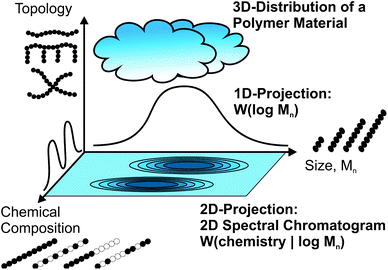
For the molecular analysis of polymer materials there are three main characteristics to consider: molecular size, chemistry and polymer topology. Molecular size is quantified via the molecular weight distribution (MWD) as determined e.g. by size exclusion chromatography (SEC), while the chemical composition can be instead measured separately using spectroscopic techniques, of which infrared spectroscopy (IR), nuclear magnetic resonance (NMR) spectroscopy and mass spectrometry are the most important methods.1–4 The examination of the topological properties is not always straight forward, as branching is often below 1 mol%, and depends on the exact problem under consideration.Modern polymeric materials consist not only of linear homopolymers, but are also very often branched and/or composed of different monomers either as copolymers or as part of polymer blends. Due to the nature of polymer synthesis, the result is always a material that shows a distribution in all the above mentioned characteristics. Fig. 1 illustrates the polymer material as a cloud in the 3D space of size, chemical composition and topology. Standard approaches measuring a single characteristic individually do not always provide enough information. For a deeper insight into the molecular characteristics, correlated measurements are needed, which are illustrated as 2D projections of the 3D distribution cloud in Fig. 1. Such combined analytics are important, not only for applications such as industrial quality control, but also as a way to improve scientific understanding of the influence of molecular parameters on all macroscopic material properties. Table 1 gives an overview of the standard SEC detectors, which can provide only very limited chemical information.
| Detector | Detection principle | Pros/Cons |
|---|---|---|
| Differential refractive index (DRI) | Δn, mean electron density, polarizability | Very sensitive, universal, only isocratic solvents |
| UV-VIS | π→π* | Very sensitive, not many polymers have chromophores, very limited chemical information |
| Viscometer | dV/dt = πr4ΔP/(8ηl); P: pressure | Information about the molecular size |
| Light scattering | R θ (q,c) = K·c·Mw·P(q)·S(q,c) | Information about the molecular size |
The promising concept of coupling SEC to a spectroscopic device of any kind has one inherent problem caused by a restriction on the maximum analyte concentration. SEC columns can only separate very dilute samples e.g. 1 g L−1. Therefore, this leads to the presence of very large amounts of solvent resulting in unwanted signals measured by the spectrometer.
One way to overcome this problem is to evaporate the solvent. This works very well for SEC ESI-MS coupling, which is limited to oligomers and rather small polymers.5 It is also used in the conventional SEC IR offline coupling where the solvent is evaporated in an oven as the polymer precipitates on a rotating germanium disc.6,7 This two step process has recently been transferred to an online SEC detector by Spectra Analysis Inc.,8 which combines oven and a spectrometer in one instrument. However, the disadvantages of this method include its incompatibility with high boiling solvents, especially water and toluene, and its intolerance towards salt additives in the solvent. In addition, high boiling point, but still liquid, additives in the samples or even oligomers may cause problems. As a final point, proper quantification of the chemical composition in the solid sample is not possible in the offline coupled technique. Nevertheless, this SEC IR coupling method is – when applicable – very powerful for the identification of even minor components.
The second approach to solving the solvent problem in SEC spectroscopy coupling is the use of transparent solvents as, for example, the use of deuterated solvents in SEC NMR coupling.9 However, these solvents are typically very expensive and are not suitable for everyday use. Furthermore, deuterated solvents normally still contain a small amount of protonated solvent, which may result in solvent signals that are on the order of the polymer signals as polymer concentrations are typically below 1 g L−1 in SEC. Nevertheless, SEC coupling with NMR spectroscopy has been successfully realized with high field NMR spectrometry10–12 as well as with low cost medium resolution NMR spectrometry, which is based on a permanent magnet and has a low S/N.13,14 In high temperature SEC (HT-SEC), the most commonly used solvent trichlorobenzene is transparent in the frequency region used to determine branching in polyolefins.15,16 Thus, IR detectors are standard detectors in HT-SEC, but cannot be applied to other solvents or other samples.17 Several approaches based on coupling SEC with both spectroscopy and liquid adsorption chromatography were reviewed by H. Pasch in ref. 18.
In this publication, a new method for SEC coupling with Fourier transform infrared spectroscopy (FTIR) is presented. This online technique was already presented in a short communication19 (main idea and spectrometer optimization) and will now be described in full detail (spectrometer optimization, flow cell construction, solvent suppression and fields of application). The main idea is to obtain chemical information on the polymer eluent from SEC with a commercial high end research FTIR spectrometer. Under optimized conditions, the sensitivity in the FTIR measurement was sufficient to subtract the solvent mathematically allowing for true online detection. We call this concept “Time resolved Infrared spectroscopy for Molecular Online SEC Detection”, abbreviated as TIMO SEC detection. The SEC separates the molecules according to their hydrodynamic volume, from which – after calibration – the molecular weight can be calculated and the FTIR detection provides the depending chemical composition of the material. The general setup of the Agilent 1260 series SEC equipment (Agilent Technologies, Santa Clara, CA, USA) and the Vertex 70 (Bruker, Ettlingen, Germany) FTIR spectrometer as a chemically sensitive SEC detector is shown in Fig. 2. Just like any SEC detector the developed TIMO detector can be included in any SEC apparatus without special requirements. It is not sensitive to pressure fluctuations and therefore doesn't need to be placed as the last detector, like the differential refractive index (DRI) detectors, and it doesn't ruin the signal like viscometers or offline FTIR devices, which require a split in the SEC eluent path.
In this report, the requirements for the spectrometer and the flow cells followed by a discussion on the details of the mathematical solvent suppression are described first. Then the influence of different SEC parameters on the results and different application examples are presented.
Method development
Spectrometer optimization
In this work, a Vertex 70 spectrometer from Bruker (Ettlingen, Germany) was used. The optimization of the spectrometer was partially described in ref. 19. This section describes all important spectrometer requirements for coupling with liquid chromatography (LC) that need to be taken into consideration.First, as the sample concentrations in chromatography are generally below 1 g L−1 (1 g polymer per 1 L solvent equals 1 g per ca. 1000 g solvent), it must be considered that there is a factor of 1000 loss in S/N for measuring a dilute sample in a solvent. If a S/N of 100 is considered as sufficient for polymer analysis, it follows from this rough estimate that the spectrometer must reach a S/N of 100![[thin space (1/6-em)]](https://www.rsc.org/images/entities/char_2009.gif) 000 within a short enough measuring time to prevent a loss in the chromatographic resolution. This depends on the exact chromatographic settings, but 20 seconds per spectrum might be considered as a general upper limit. Up to this chromatographic resolution limit, all n IR scans can be summed together to improve the S/N of the resulting spectrum, where S/N ∼ √n for stochastic noise. Depending on the actual analytical question, the user can adjust the number of scans to focus on either the SEC resolution (short IR measuring time) or the spectroscopic sensitivity (running more scans per spectrum). As the S/N increases with the square root of the number of scans and the time per scan is considered constant, it is necessary to calculate (S/N)·t−1/2 as the main parameter for indicating spectrometer optimization (for an explanation see ref. 4).
000 within a short enough measuring time to prevent a loss in the chromatographic resolution. This depends on the exact chromatographic settings, but 20 seconds per spectrum might be considered as a general upper limit. Up to this chromatographic resolution limit, all n IR scans can be summed together to improve the S/N of the resulting spectrum, where S/N ∼ √n for stochastic noise. Depending on the actual analytical question, the user can adjust the number of scans to focus on either the SEC resolution (short IR measuring time) or the spectroscopic sensitivity (running more scans per spectrum). As the S/N increases with the square root of the number of scans and the time per scan is considered constant, it is necessary to calculate (S/N)·t−1/2 as the main parameter for indicating spectrometer optimization (for an explanation see ref. 4).
Fourier transform infrared spectroscopy is an elaborate method. There is a large variety of different measurement techniques. Spectrometers are commercially available that are already equipped with different components according to the user's needs. Next, specifications for certain parts of the spectrometer that are important to gain the best (S/N)·t−1/2 for LC coupling will be discussed.
First, the spectrometer must be equipped with a quantum detector, which are mostly made of the semiconductor material mercury cadmium telluride (MCT) for the MID IR region and require cooling with liquid nitrogen. These detectors provide a much higher sensitivity compared to standard room temperature pyroelectric detectors made of deuterated L-alanin doped triglycin sulfate (DTGS). They also have a much faster response time, which means that they can be operated at higher measuring speeds. The need for liquid nitrogen cooling is only a disadvantage in specific environments, where it is not easily available, but is generally not a problem at research facilities. The ca. 50 times better detectivity D* of the MCT detector is crucial for the coupling technique presented here. In these experiments, it was possible to achieve an 11 times increase in the S/N corresponding to a factor of 120 savings in the measurement time simply by exchanging the DTGS detector with an MCT detector.19
The 24 bit analog digital converter (ADC) of the detector can distinguish 224 = 16![[thin space (1/6-em)]](https://www.rsc.org/images/entities/char_2009.gif) 777
777![[thin space (1/6-em)]](https://www.rsc.org/images/entities/char_2009.gif) 216 different states. This high dynamic range should be fully used. Therefore, all optical paths should be properly aligned to make sure that the maximum light intensity reaches the detector. For the measurement of a normal (not time resolved) IR spectrum, a misaligned optical path will only result in a higher noise level, which is very often easily compensated for by a longer measuring time. A control on the alignment of the optical path can only be made by evaluating the raw data based on the initial light intensity and does not need to be considered for routine IR measurements. In ref. 19, the readjustment of the optical path for a Vertex 70 spectrometer, which was in service for many years, resulted in a factor of 4 improvement in the S/N reducing the measurement time by a factor of 16.
216 different states. This high dynamic range should be fully used. Therefore, all optical paths should be properly aligned to make sure that the maximum light intensity reaches the detector. For the measurement of a normal (not time resolved) IR spectrum, a misaligned optical path will only result in a higher noise level, which is very often easily compensated for by a longer measuring time. A control on the alignment of the optical path can only be made by evaluating the raw data based on the initial light intensity and does not need to be considered for routine IR measurements. In ref. 19, the readjustment of the optical path for a Vertex 70 spectrometer, which was in service for many years, resulted in a factor of 4 improvement in the S/N reducing the measurement time by a factor of 16.
As the overall measurement time is limited in time resolved spectroscopy, no time should be wasted. This may seem trivial at first glance; nevertheless, the spectrometer may have idle time intervals during the measurement procedure and this can be optimized. Two points should be mentioned and checked here. First, FTIR spectrometers offer different measurement modes concerning the mirror movement in the interferometer. Data can be acquired in both directions of mirror movement and before and after the zero point. In principle, this counts as four interferograms and this setting has the least time loss due to stopping and (re)turning of the mirror. Secondly, depending on the specific operation software, time can be lost during communication with the computer and the calculation of the Fourier transformation. While this takes just a split second, this becomes important when hundreds or thousands of scans are measured during a SEC run and the overall loss in measurement time should not be neglected. For the OPUS Software from Bruker, a special module called the “rapid scan option” optimizes the usage of measurement time and should be used in coupled SEC FTIR measurements.
With options like the above mentioned “rapid scan option”, spectrometers are able to measure more than 50 spectra per second. As the addition of several spectra increases the S/N, one might be tempted to measure as many scans as fast as possible. However, the mirror movement is more accurate when operated slower and the electronics (ADC) and detectors also cause less noise when the measurement is slower. Therefore, the optimum (S/N)·t−1/2 as a function of the mirror velocity must be evaluated. The Vertex 70 used here can be operated at mirror velocities up to laser modulation frequencies of 160 kHz, but the (S/N)·t−1/2 was a factor of 6 better at mirror velocities of 20 kHz or 40 kHz. The data point frequency can be further reduced by truncating the spectra at higher wavenumbers due to the nature of Fourier transformation. As the intensity of the globar light source at higher wavenumbers is lower and the penetration depth into the sample is also smaller at the higher wavenumbers when using an ATR flow cell (see below), the risk of back folded signals is rather low when the spectrum is limited to a maximum of ca. 5200 cm−1.
Furthermore, the degree of spectral resolution should be limited to what is required, as halving the resolution reduces the actual measurement time by two. As there is also dead time during the measurement procedure, the effect is not directly linear. For liquids, a resolution of 4 cm−1 is generally considered sufficient, because IR peaks are broader. For the coupling with SEC, the resolution can be further decreased, depending on the number and kind of components to be analyzed in the sample. With these optimization steps, the spectrometer was operated at a very high sensitivity for short measuring times as required for the SEC coupling. The S/N was improved by a factor of 265 compared to the beginning of the method development.19 The typical measuring time for one spectrum was 15 to 20 seconds. For one spectrum, 65 to 80 scans were added with each scan consisting of 4 interferograms.
Flow cells
The IR measurement cells for the coupling do not only need to fulfill the spectrometric requirements, but must also satisfy the chromatographic needs. The typical dead volume of UV- or DRI detectors is in the range of 20 μL to 60 μL. This means that the inner volume of the FTIR cell should be as small as possible and its inner geometry should be optimized. Both can lead to artificial peak broadening via e.g. backflow in the flow field of the cell. Furthermore, the cells should be suitable for flow applications and resistant to both organic solvents and water. Unfortunately, a cell meeting these conditions was not commercially available. Therefore, the cells used in this work are in-house modified versions of commercially available cells.There is not a lot of variety in the type of window materials suitable for IR spectroscopy. They are very often water soluble and are sometimes even hygroscopic. The usable transparent spectral range may be limited and these materials are mostly crystals or salts that have very poor mechanical properties. The most commonly used materials are ZnSe, CaF2 and KBr. The globar light sources are also not very intense; this translates to only a very small sample thickness of 10 μm to maximum 20 μm that can be permeated. The combination of brittle window materials, a thin sample (or solvent) thickness and a rather high flow rate for these conditions (normally ca. 1 mL min−1) did not seem to be the most mechanically stable and universal approach. Nonetheless, we developed a transmission flow cell according to these requirements and, as expected, it often had problems with leakages. Instead, a design using a flow cell based on an attenuated total reflectance (ATR) unit proved to be more robust and is therefore recommended and described below.
As the very small thickness requirement was shown to be a drawback for flow measurements in transmission mode, measurement in attenuated total reflectance (ATR) can overcome this problem. In ATR, the IR beam is totally reflected in the measurement crystal, which is in contact with the sample. The evanescent field of the light interacts with the polymer solution and IR spectroscopy is possible. The penetration depth depends on the angle, the refractive index of the crystal and the sample. Generally the evanescent field is very small and within the range of the wavelength of the light. Therefore, for MID IR wavelengths in the range of 1 μm, the penetration depth is between 1 μm and 2 μm. This is still less than the sample thickness in transmission mode, so multiple reflections in the ATR crystal can be realized to improve the sensitivity. While only a small layer of the sample is measured in ATR, the complete cell can be built to larger dimensions making it more robust. The increased inner cell volume was then matched to semi preparative columns for the SEC separation, which meant larger column dimensions in the SEC. For this work, several ATR flow cells were built and compared. They were all based on a ZnSe crystal with a trapezoidal shape and outer dimensions of 7.14 cm × 1 cm × 0.6 cm, which allows six reflections of the IR beam. Drawings of the flow cell can be found in the ESI.† The inner volume of the cells was decreased from ca. 500 μL to ca. 250 μL and finally to ca. 170 μL using spacers of different thicknesses between the plates. For chemical resistance towards organic solvents, these spacers are made of perfluorinated elastomers called FFKM or Kalrez®, which are not easily available at all thicknesses. The FFKM sealing on top of the crystal, which defines the dimensions of the inner cell, was cut in smooth shape to avoid creating turbulences in the flow. The 170 μL ATR flow cell with 6 internal reflexions has a small enough inner volume to also be used with analytical columns with only a slight reduction in the chromatographic resolution. Compared to the flow cell used in ref. 19, which was based on a single reflection ATR unit, the six reflections ATR crystal gained a factor of 1.5 to 3.3 in the S/N for the FTIR measurements depending on the wavenumber.
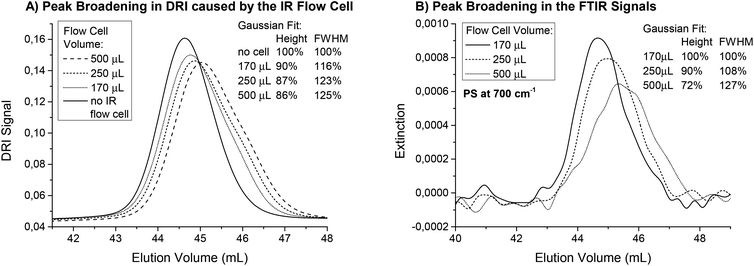
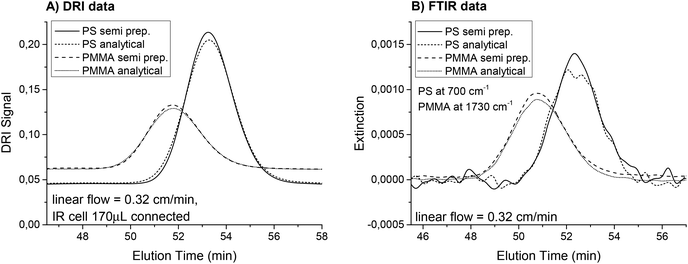
The influence of the inner volume of the flow cell on the SEC peak broadening was investigated for the three flow cells. Fig. 3(A) shows the SEC chromatograms of a polystyrene (PS) homopolymer with a very narrow distribution (Mw = 193 kg mol−1, PDI = 1.03) recorded when the DRI detector was connected directly after the FTIR. This results in a measurement of the actual peak broadening due to mixing and turbulence in the flow cell. With increasing cell volume, the peaks elute later and become broader. To quantify the peak broadening, the data was fitted with a Gaussian distribution. The full width at half maximum (FWHM) increased between 16% and 25% for the different flow cells compared to a measurement made without the FTIR detector connected. An additional detector leads to an increase in peak broadening, but the smallest flow cell performed best. The difference between the flow cells was already small for this sample with a very narrow PDI and the increased peak width was acceptable considering the normal accuracy of SEC measurements. For samples with a broader molecular weight distribution, the impact of the flow cell inner volume on the resulting measurement will be even smaller and should be negligible for PDI > 1.3.
For static measurements (no flow), the cell size did not influence the FTIR results. However, when FTIR was used for detection in SEC, the signal intensities changed when the sample peak(s) passed through the flow cell. Therefore, the cell volume represents the observed fraction from the sample. When the flow cell volume is larger, it may include not only the highest concentration parts at the peak maximum, but also contributions from parts of the curves with lower concentrations. For very large flow cells and very narrow peaks, the observed concentration can even be a mixture of the peak maximum concentration and the pure solvent, which would cause the signal intensity to decrease. Mathematically speaking, this means that the true chromatogram is folded with a function representing the cell volume causing the observed peak in the IR spectrometer to broaden, even when the actual concentration gradient in the cell is not disturbed. Unfortunately, this broadening was accompanied by a decrease in the signal intensity, which reduced the S/N. Fig. 3(B) shows the traces for PS at 700 cm−1 for the measurements described above. The injected mass of the polymer was only 0.55 mg to also illustrate the S/N in this example. The signal intensities decreased to 72% when using the 500 μL cell instead of the smallest one. This effect was much larger compared to the effect observed in the DRI detector and should therefore be considered when setting up a SEC with FTIR detection. Again, the low PDI sample shown here is an extreme example and the expected signal loss for a sample with a broader MWD would be substantially less.
Solvent suppression
The complete data treatment process was designed to create a 2D spectral chromatogram from which traces for the different components at different wavenumbers can be extracted and analyzed. It was accepted that the spectrum itself may differ from published spectra found in the literature because of some residual characteristics remaining from the solvent, solvent polymer interactions and the solvent suppression method. However, the spectra are nevertheless still characteristic for the investigated polymer. The solvent suppression procedure described here does not only work for FTIR measurements, but has already been adapted for SEC MR-NMR coupling.14After calculation of the extinction spectra, the solvent spectrum can easily be subtracted. However, drift and noise from the spectrometer worsen the S/N. Thus, mathematical drift correction and noise reduction were included in the data treatment process. For simplicity, we refer to the overall process as solvent suppression, which was automated using a custom written MATLAB program.
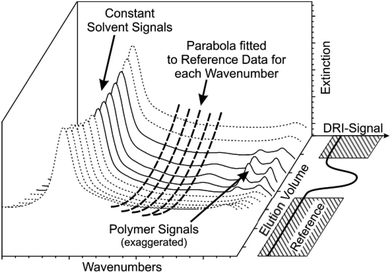
In most cases, a solvent spectrum was taken and used as the background spectrum for the IR measurement by the spectrometer software because this was easiest to fit into the workflow. In fact, the drift correction part of the MATLAB solvent suppression program removes all constant parts in the spectra ensuring that all possible methods for measuring the background spectrum will produce the same end result. The chromatographic experiment is performed on a known timescale, which means that all peaks elute within a certain volume range that is called the separation range of the column. However, drifts occur on a much larger timescale. Thus, the drift can be fitted to a blank solvent signal before and after the chromatogram using a second order spline in time for each wavenumber. Our software calculates this parabola for each wavenumber individually and subtracts it from the data set, which is visualized in Fig. 4 for better understanding. This procedure presupposes that the spectrometer is maintained as much as possible at constant conditions. In some cases, a third order polynomial delivers better results, but this would only be reliable if there is a larger amount of reference data available.
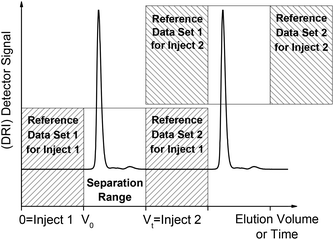
Based on our experience, we recommend the following procedure for a second order polynomial drift correction, which also fits well within a typical SEC workflow. First, the time between injection and the retention volume V0 is used as the reference data. Then, the time between the retention volume and the total permeation volume Vt is the separation range of the column where the SEC peaks elute. Both of these periods should take approximately the same time. After the total permeation volume, a second set of reference data is needed, which should ideally be as long as the first set of reference data. Of course, the second reference set of one sample may also be used as the first reference set for the next sample if the next sample is injected at the proper time. This would reduce the measurement time by ca. 33% when the SEC is automated, which is normally the case in a standard SEC workflow. However, the exact limits have to be defined individually for each SEC setup and should include a small safety margin. Fig. 5 illustrates this procedure. The two sets of reference data for each sample can then be used for the drift correction step for each individual wavenumber in the custom MATLAB program.
In the second calculation step, which is designed to reduce noise, a mean value is calculated from a peak free region of the IR spectrum for each spectrum or time slice. Our home written program allows for this region to be individually chosen for each polymer and solvent combination. However, as there are only rarely IR peaks in the range between 2000 cm−1 and 1800 cm−1, this region is typically selected. The mean value for this region is then subtracted from the complete spectrum to reduce noise in the time axis, which can, for example, originate from intensity fluctuations in the IR light source. Depending on the wavenumber, this step improved the S/N by a factor that is between 1 and 1.4.
To determine or track one component in the sample, a single characteristic wavenumber is sufficient (although even a non-characteristic wavenumber would be sufficient, using a data analysis method similar to the multiple detector approach20 or chemometrics) and the spectrometer measures many more wavenumbers than needed. Therefore, the co-addition of several chromatogram traces from different wavenumbers could result in an improved S/N as described above. Unfortunately, the noise from different wavenumbers proved to be highly correlated and the co-addition of multiple chromatogram traces did not improve the S/N, at least not for wavenumbers in close proximity as, for example, from peak shoulders. If the analyzed sample shows two strong IR absorptions at very different wavenumbers, the sum might still show a better S/N. However, for most samples, the peak maximum trace from the strongest IR absorption is simple and resulted in the best S/N. As the time resolution was normally much higher than the peak width, smoothing along the time axis with a Gaussian much narrower than the width of the selected peak was typically performed.
Artifacts, drawbacks and hints for data interpretation
The solvent suppression method used here has some characteristic effects that are inherent to the method, which nonetheless may appear as artifacts to the inexperienced user. The most important ones and their origins will be discussed and explained here.As mentioned in the section above, all constant contributions to the background signals can be neglected due to the solvent suppression, but signals that are changing still present a problem. As the method is sensitive to changes in the sub-ppm range, very small changes in the background spectrum will affect the resulting data. This means that even very small fluctuations in the water vapor content inside the spectrometer will appear as signals in the final 2D spectral chromatogram. The same is true for carbon dioxide and both are particularly influenced by the breathing of the operator, for example. Fortunately, most other atmospheric gases are IR inactive. Therefore, it is good practice to flush the spectrometer continually with nitrogen or dried air. To keep the humidity inside the spectrometer at a (mostly) constant level, an additional desiccant (ca. 1 kg of bentonite) was placed inside the apparatus. As carbon dioxide signals cover only a very limited area in the IR spectrum, it is a minor problem compared with water vapor. It is clear that the spectrometer housing including the sample compartment should be kept closed not only during the measurement, but also for a sufficiently long enough time (>30 min in our experiments) before the measurement to ensure that the atmosphere inside the spectrometer reaches a state of equilibrium. The solvent suppression program assumes that all changes in the measured spectra appear within the separation range of the column, but this cannot be assured when considering changes in the atmospheric components. In such cases the signals from water vapor, for example, may be stronger than the signals from the analyzed polymer. While this situation is not desirable, if the wavenumber of interest is well separated from the water vapor signal, then the data can still be evaluated.
The solvent suppression protocol described above reduces all constant solvent signals, drifts and noise very effectively. However, as the solvent signals are also changed when the sample elutes, the resulting spectrum is never completely free of solvent artifacts. There are several reasons for this. First, the polymer will replace a certain amount of solvent molecules in the flow cell. These solvent molecules were previously used as the reference and therefore result in negative solvent peaks, which are of similar magnitude to the polymer signals, but are located at wavenumbers for solvent resonances and not at wavenumbers used for polymer analysis in most cases. Secondly, there are solvent molecules bound to the analyte, which changes the solvent molecular vibrations compared to the pure solvent and causes the solvent peaks to possibly broaden or shift to slightly different wavenumbers in the IR spectrum. These shifts can also be seen in the resulting data after application of the solvent suppression MATLAB program. However, this is not a problem when analyzing single wavenumber traces as chromatograms for single components because these artifacts scale linearly with polymer concentration and can be calibrated. In the very extreme and theoretical case that the analyte shows a characteristic peak at the same wavenumber and same intensity as the solvent, no difference between the two would be observed and the analyte could not be detected at this wavenumber. If this was true at all wavenumbers, the analyte and the solvent would be chemically identical. So, it can safely be concluded that in most cases these artifacts occur only at wavenumbers that are not of interest. However, this does mean that the resulting spectrum would likely not match a known spectrum for the analyte published in the literature and the spectra measured here should probably only be compared to reference spectra also measured using this SEC FTIR method. Nevertheless, literature spectra from solid samples still provide a starting point for identifying components of completely unknown samples or a proper reference library with SEC FTIR spectra could be developed.
In the applications section, a 2D spectral chromatogram, extracted chromatogram traces and spectra with solid reference measurements are presented. Additionally, examples of common polymer and solvent combinations with similar IR spectra are shown to demonstrate the capability of the method.
The noise level depends strongly on the background and, therefore, on the solvent. At wavenumbers where the solvent shows strong absorptions, only a little light intensity is left for the determination of polymer peaks. The dynamic range is consequently limited and the relative noise increases. For the same reason, higher noise levels are seen in wavenumber regions where the IR light source, the globar, has less initial light intensity. In addition, a third contribution to noise must be considered. The penetration depth d into the sample with the ATR technique is wavenumber dependant (d ∼ λ ∼ 1/![[small nu, Greek, tilde]](https://www.rsc.org/images/entities/i_char_e0e1.gif) ) and there is lower penetration at higher wavenumbers. Taking all the points above together, it follows that the strongest IR absorption from a polymer is not always the best choice for the component analysis in TIMO SEC detection. Consequently, the S/N has to be checked on the individual system, but the combination of high globar intensity, low wavenumber and low solvent absorption is considered to be a good starting point.
) and there is lower penetration at higher wavenumbers. Taking all the points above together, it follows that the strongest IR absorption from a polymer is not always the best choice for the component analysis in TIMO SEC detection. Consequently, the S/N has to be checked on the individual system, but the combination of high globar intensity, low wavenumber and low solvent absorption is considered to be a good starting point.
In SEC analysis, the appearance of positive or negative detector signals at the end of the chromatogram is well known. These so called “system peaks” arise from small molecules that are present in the solvent.21,22 The solvent quality of the mobile phase and the injected sample may differ a little bit and preferential solution also plays a role. These system peaks are often used as internal standards to improve the SEC analysis. Depending on the refractive index of these components, the system peaks may be small in the DRI chromatogram even when their concentration is higher than the analyte concentration. In the TIMO SEC detection presented here, the system peaks are often quite strong and are sometimes even stronger than the polymer signals, but occur mostly at different and predictable wavenumbers and are not typically a problem. Additionally, these small molecules also displace the solvent, which results in negative solvent signals at the end of the chromatogram.
Modifications to the SEC
The objective of our coupling approach is the development of a universally applicable, chemically sensitive FTIR detector for SEC. Consequently only a few changes were performed on the SEC side of the method to improve the S/N per unit time and none of these changes had a significant influence on the separation. This means that the FTIR SEC detector can be transferred to any SEC analysis method and there are no restrictions on the range of polymers or isocratic solvents that can be analyzed at room temperature.The normal analytical SEC columns with an inner diameter of 8 mm were exchanged for the so called semi preparative columns with an inner diameter of 20 mm. These columns are normally operated at a 6.25 times increase in both the flow rate and in the injected mass, e.g. the same sample concentration in a 6.25 fold increase in the injection volume. This means that the concentration at the detector is theoretically the same irrespective of the column type. The main difference is the volume of the flow cell, which can also be 6.25 times larger when using the semi preparative columns for the separation. The ATR flow cell developed with an inner volume of 170 μL corresponds to a detection cell of only 30 μL for analytical columns, which is exactly in the range of other standard SEC detectors. Therefore, while the size of the flow cell volume for the FTIR matches well with the size of the semi preparative columns, it would be at the limit for the analytical SEC columns.
To demonstrate this, a PS (Mw = 8900 g mol−1, PDI = 1.03) and a poly (methyl methacrylate) (PMMA, Mw = 12![[thin space (1/6-em)]](https://www.rsc.org/images/entities/char_2009.gif) 500 g mol−1, PDI = 1.03) sample solution (c = 2 g L−1) were measured first with an analytical column that had an inner diameter of 8 mm and a length of 300 mm. The particle size of the SDV column material was 5 μm. The column was manufactured by PSS GmbH (Mainz, Germany) and the separation range is labeled as “linear S”. The injection volume was 80 μL, the flow rate was selected to comply with a linear flow of 0.32 cm min−1 and the solvent was THF. The same sample solutions were then analyzed on a semi preparative column filled with the same separation material. The linear flow was kept at 0.32 cm min−1, but the injection volume was increased to 500 μL. Fig. 6 shows the different chromatograms from the DRI and FTIR detectors. The semi preparative column operated at a higher flow rate provided a very similar result to the analytical column at the correspondingly lower flow rate. However, the FTIR flow cell volume influenced the peak height and width and therefore the semi preparative columns performed slightly better. The theoretical number of plates N was calculated from the DRI data and increased by 13% for PS and 15% for PMMA on the semi preparative column. This corresponds to an increase in signal height of 5% and 6%.
500 g mol−1, PDI = 1.03) sample solution (c = 2 g L−1) were measured first with an analytical column that had an inner diameter of 8 mm and a length of 300 mm. The particle size of the SDV column material was 5 μm. The column was manufactured by PSS GmbH (Mainz, Germany) and the separation range is labeled as “linear S”. The injection volume was 80 μL, the flow rate was selected to comply with a linear flow of 0.32 cm min−1 and the solvent was THF. The same sample solutions were then analyzed on a semi preparative column filled with the same separation material. The linear flow was kept at 0.32 cm min−1, but the injection volume was increased to 500 μL. Fig. 6 shows the different chromatograms from the DRI and FTIR detectors. The semi preparative column operated at a higher flow rate provided a very similar result to the analytical column at the correspondingly lower flow rate. However, the FTIR flow cell volume influenced the peak height and width and therefore the semi preparative columns performed slightly better. The theoretical number of plates N was calculated from the DRI data and increased by 13% for PS and 15% for PMMA on the semi preparative column. This corresponds to an increase in signal height of 5% and 6%.
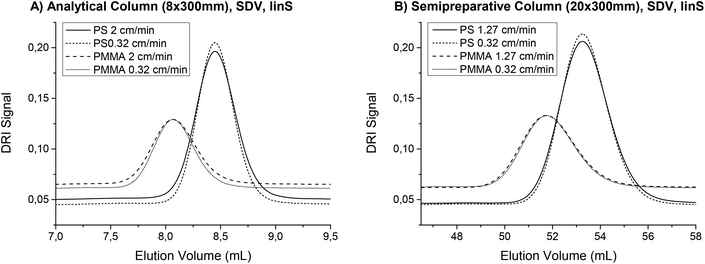
In chromatography, there are several effects that lead to peak broadening and therefore decrease the quality of the separation. As some of these factors depend on the velocity of the mobile phase, an optimal flow rate exists. This was first described by van Deemter et al.23 and can now be found in any textbook about chromatography, e.g.ref. 24. The van Deemter plot is true for all separations that are based on adsorption. However, the SEC separation principle is completely different and only little research has been reported on peak broadening in SEC. The findings published so far suggest that the flow rate dependence of the separation quality for SEC cannot be described with a standard van Deemter plot.22,25–29 Although no universal theory has been developed so far, using low flow rates does not seem to worsen the SEC separation. This is plausible because the diffusion coefficients for polymers are much lower than for the low molecular weight samples, which are typically analyzed with absorption chromatography and described by the van Deemter theory. According to van Deemter, the dominant influence on peak broadening at low flow rates is longitudinal diffusion. For SEC separations, the molar mass and the viscosity as well as the particle size and the interstitial volume also influence the chromatographic resolution.22,30,31 A full exploration of the effect of flow rate on the SEC separation is far beyond the scope of this paper. However, the finding that the flow rate can be reduced without any negative effects on the separation can be used to improve the S/N in the FTIR measurement, which was experimentally confirmed in this work. As a reduced flow rate allows for the measurement of better quality IR spectra, it was considered as standard practice for TIMO SEC detection. A flow rate comparison was performed at linear flow rates of 2 cm min−1 and 0.32 cm min−1 for the analytical column, keeping the ratio of 6.25. For the semi preparative column, the flow rates were 1.27 cm min−1 and 0.32 cm min−1 because the in-house built flow cells can only handle the pressures associated with flow rates of up to ca. 4.5 mL min−1 using the present settings. At higher flow rates, leakages occurred. The columns and sample solutions of PS and PMMA were the same as in the experiment described above, which also compared the semi preparative and analytical columns. In the results illustrated in Fig. 7, the peaks from the lower flow rates were narrower and higher for both PS and PMMA using either the semi preparative or analytical columns. The number of theoretical plates N increased by 20% (PS) and 17% (PMMA) on the analytical column, where the flow rate difference was larger. On the semi preparative column, N increased by 9% (PS) and 7% (PMMA). The signal height increased by up to 9%. Together with the longer measuring time, this results in an overall theoretical gain in S/N by a factor of 2.6 for the coupled technique. Therefore, lower flow rates e.g. 1 mL min−1 for semi preparative SEC columns should be preferred, if longer overall measuring times are acceptable.
Using SEC with online FTIR detection always leads to a compromise between the different needs of SEC and spectroscopy. While chromatography works best with dilute samples, spectroscopy reaches better S/N at higher concentrations.
The loss in SEC separation is quite low within a certain range of injected masses. However, when very high masses were injected into the SEC, the peaks showed unpredictable shoulders and were smeared. This effect, when peak shapes differ significantly at different injected masses, is known as column overloading.22 To gain the best S/N in FTIR detection, it is advantageous to increase the injected mass close to the point of overloading. The limit between acceptable separation and column overloading depends strongly on the sample and its MWD as well as on the column and its pore size distribution. Thus, no general limit can be stated here. If the best S/N is needed for a specific sample, a concentration series can reveal the overloading limit.
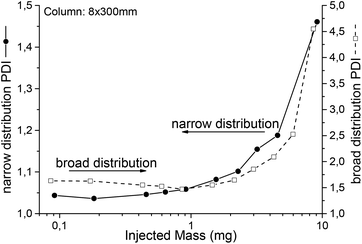
How overloading influences the SEC chromatogram is known to SEC users. To give an impression, Fig. 8 illustrates the measured PDI for different injected masses of two polystyrene samples. The column was linear S, 8 × 300 mm operated with THF at a flow rate of 1 mL min−1. While the PDI of the narrow distributed sample directly increased with increasing injected mass, the apparent PDI of the broader sample stayed comparably constant over a certain range. As a rule of thumb, overloading by a factor of 2 compared to the column suppliers recommendations is a good starting point to find the optimum, e.g. an injection of 3 mg polymer in 100 μL solvent for analytical and 20 mg in 500 μL for semi preparative columns. If complete prevention of overloading is needed, peak shapes should be compared and not just the PDI. Nevertheless, for SEC IR coupling, not only the general effect of overloading is of interest, but its influence on the chemical composition distribution is even more important. Thus, the sample described in the second application example (see Fig. 10) was measured in a concentration series. The results can be found in the ESI.† As overloading broadens the observed distribution, it reduces the separation quality from the SEC. Beyond a certain limit one loses all benefit from the separation. At this point a spectroscopic measurement of the unseparated material should be preferred, as it normally provides more useful results. By the same argument the evaluation of peak areas, which is also equivalent to a reduction of the chromatographic resolution, makes no sense in most cases.
Application examples
One of the main purposes of IR spectroscopy is the identification of substances, e.g. for quality control reasons in industry or for the characterization of new multicomponent materials. Therefore, our coupled technique is also meant to identify the components in a polymer material. As already discussed above, the solvent and the solvent suppression influence the spectrum, nevertheless, the resulting IR spectrum is still characteristic for the material in the selected solvent. One further drawback is the reduced quality of the IR spectrum regarding S/N, which is moreover frequency dependant. However, a perfect IR spectrum is not needed from the coupling. If the material is completely unknown, the user can first measure a high quality spectrum of the bulk material or of a highly concentrated solution, not only with the FTIR spectrometer, but also with NMR or mass spectrometry for example. Therefore, it can be assumed that the components contained in the sample are known and the main purpose of the TIMO detector is to identify the substances associated with different SEC peaks. Even if a material is completely unknown, the range of possible monomers used for polymers is rather limited and a library with reference spectra can easily be developed for future applications.To demonstrate the general working principle of the coupled SEC FTIR method presented here, the experiment shown in ref. 19 was performed a second time. In the first experiment,19 the column was highly overloaded, so the injected mass was now reduced to fit the chromatographic conditions. The comparison of these two measurements nicely illustrates the current development of this method.
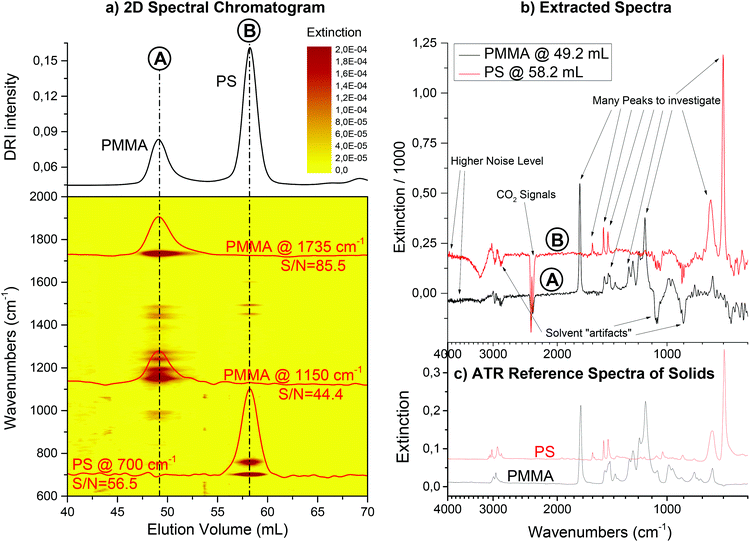
Fig. 9 shows the resulting 2D spectral chromatogram of the SEC run using FTIR detection on a mixture of PS and PMMA as a contour plot. The solvent was THF, a flow rate of 1 mL min−1 was used and the column was a semi preparative (20 × 300 mm) SDV linear M column from PSS GmbH (Mainz, Germany). The injected mass of the polymer blend onto the column was 1 mg. In addition, extracted chromatograms are shown for characteristic wavenumbers for each component. The phenyl ring vibration at 700 cm−1 is, for example, representative only for PS, while the carbonyl stretching at 1735 cm−1 only occurs in PMMA. Please note that these chromatograms were not smoothed, but are data directly from the instrument. With the additional information from the FTIR detector, it is easy to assign the peaks from the DRI detector to the components, which would not have been otherwise possible.
The extracted spectra show the artifacts of the solvent suppression as described above. Nevertheless, they are still of sufficient quality for clear identification of the compounds. Fig. 9 additionally gives reference spectra from the solid samples for comparison. The reference spectra were measured on a single reflection ATR diamond crystal (MIRacle, PIKE Technologies, Madison, WI, USA).
The identification and assignment of SEC peaks can also be performed on fractionated samples. This requires more effort, but offers more options to obtain high quality IR spectra. It is possible to operate the SEC IR coupling with the offline, solvent evaporation approach when it is a question purely of identification.
The real advantage of TIMO detection relative to the solvent evaporation approach is the ability to quantify the composition changes as a function of molecular weight, which can be measured only with a few other coupled methods, e.g. SEC and high field NMR.11,12 The only alternative is the multiple detector approach described in ref. 19 or a very detailed fractionation. However, the multiple detector approach needs a combination of concentration detectors with different sensitivities for each component present that must be customized for the system under investigation. As many polymers do not absorb UV radiation or cannot be detected with a DRI detector (see below), this strategy is limited, especially as the number of other available detectors is limited. The MID IR spectroscopy approach presented here instead offers hundreds of possible wavenumbers to be investigated (ca. 600 cm−1 to 4000 cm−1) where each wavenumber can be seen as a single detector. There are hardly any samples that cannot be detected with IR spectroscopy.
Fig. 10 shows the results from a SEC measurement of a PS-b-PMMA copolymer using FTIR detection. The IR intensity for the selected wavenumbers has been calibrated to the overall mass fraction given by the manufacturer, which would have alternatively been accessible via1H-NMR spectroscopy or similar quantitative techniques. The calibration can be also performed with weighted homopolymer samples. However, if the overall composition is known, the integral of the IR signals along the time axis (chromatogram) can be calibrated to the overall mass of the component. Then, the chromatograms give the relative masses for each component from which the chemical composition distribution can be calculated. The injected mass was in this case 2.2 mg to gain sufficient S/N, but was not enough to overload the semi preparative (20 × 300 mm) column. The column was a linear S SDV column operated with THF as the solvent at a flow rate of 1 mL min−1. The interpretation of the chemical composition distribution curves is limited to regions where the signal height was sufficient, as the noise can increase dramatically in regions with signals close to zero due to the calculation.
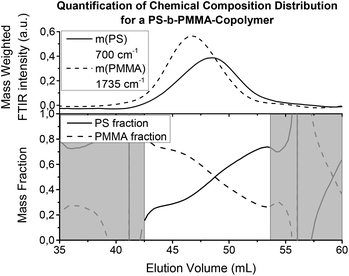 | ||
| Fig. 10 Chromatograms and the chemical composition distribution of a PS-b-PMMA copolymer (like Fig. 9(a), cuts at fixed wavenumbers). The IR absorptions of the components have been normalized to fit the overall mass fraction of the sample. Thus, they represent a relative concentration, from which the chemical composition distribution can be calculated as mass (or molar) fraction. To avoid large errors and uncertainties in the calculation of the ratio for the chemical composition distribution, it is important to only evaluate regions where there is sufficient signal height (e.g. >5% of maximum intensity). The regions not meeting this requirement are shown in grey. | ||
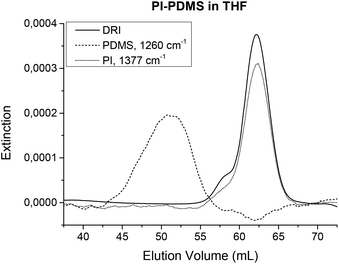
As all polymers have vibrating molecular bonds, all polymers can be detected with IR spectroscopy. Thus, the FTIR detection in SEC is universally applicable. It can be used in situations where other SEC detectors fail. For example, the UV detector is limited to polymers with chromophores. In addition, while the standard DRI detectors can detect nearly any polymer, it still fails when the polymer and the solvent have the same refractive index. This is known as an isorefractive solvent and sample combination. Examples of these combinations include polydimethylsiloxane (PDMS) in THF or poly(lactic acid) (PLA) in chloroform. Usually, these polymers can only be analyzed in SEC using a different solvent, e.g. toluene for PDMS, provided it can dissolve the polymer. Fig. 11 shows the chromatograms from the DRI detector and the FTIR detector for a PI-PDMS sample. While it was supposed to be a copolymer, it was actually shown to be a blend after FTIR SEC analysis. The figure clearly shows that the DRI signal only represents the PI part. With TIMO detection, all components can be detected including the isorefractive pairs such as PDMS in THF. As a second example, PLA in chloroform was also shown to work with FTIR SEC analysis as published in ref. 32, where the crystallization of PS-PLA copolymers was investigated.
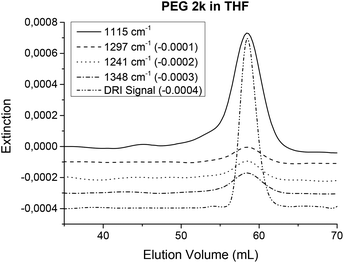
The solvent suppression works best in frequency regions where the solvent shows no absorptions and worsens in regions where strong absorptions from the solvent occur. Therefore, samples that have a very similar IR spectrum to the solvent might be harder to detect with this new method. Solvent and sample combinations that show similar IR spectra include e.g. PS in toluene or poly(tetramethylene ether)glycol (PTMEG) or poly(ethylene)glycol in THF. The determination of PTMEG has already been reported in ref. 33. Chromatograms of PEG in THF are shown in Fig. 12 and chromatograms of PS in toluene can be found in the ESI.†
A PEG calibration standard (Mw = 2010 g mol−1, PDI = 1.09) was measured in THF using normal SEC conditions (injected mass: 1 mg) on a semi preparative (20 × 300 mm) SDV linear S column. Several peaks present in the PEG spectrum differ from those of the solvent and can be detected with sufficient S/N. Fig. 12 illustrates the corresponding chromatograms.
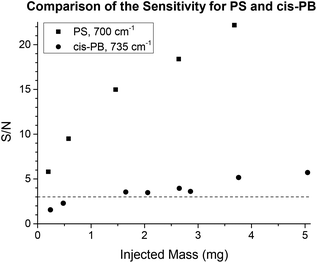
The benefit of TIMO detection depends also on the IR spectrum of the analyte in question. There are functional groups that show strong IR absorptions, such as the carbonyl stretching in PMMA, for example. The S/N of the resulting chromatogram directly depends on the dipole moment of the investigated molecular vibration. Therefore, polymers with rather low absorptions or small peaks are harder to measure, but these small peaks often provide more detailed information about the polymer and are still of interest. As an example of this, 1,4-polybutadienes (PB) were investigated at 735 cm−1, a peak which is characteristic for the cis 1,4-PB configuration. Different amounts of a commercially available polybutadiene (97.5% cis configuration) were injected onto a semi preparative SDV linear M column with THF at a flow rate of 1 mL min−1 as the eluent. Fig. 13 shows the resulting S/N for all injections along with the S/N for the strong phenyl stretching of PS at 700 cm−1 for comparison. The limit of detection (LOD) is usually defined as the amount of injected mass that can be identified with a minimum S/N of 3.34 Using these criteria, the investigated polybutadiene was detected when more than ca. 1.5 mg was injected onto the column. With higher injected masses, the effect of column overloading must then be taken into account. While the sensitivity of TIMO detection reached its limits in this case, the technique was still highly specific not only to the polymer, but also to details of the polymer microstructure. In contrast, alternative SEC detectors are usually not specific at all.
Conclusions
This publication gives a detailed description how time resolved infrared spectroscopy can be used as an online SEC detector that can be applied to investigate basically any analyte. This concept has the potential to be applied as a standard SEC detector because it is straightforward to use and the estimated cost would be within the range of other high end detectors (e.g. viscometer or light scattering). The specific requirements and full optimization for the FTIR spectrometer to fit this application are discussed in detail as well as modifications necessary on the SEC side. With specially designed flow cells, the solvent can be subtracted when drifts are corrected and noise is reduced. The solvent suppression and the origins of artifacts in the measurement are thoroughly explained. Several examples show the potential of this new SEC FTIR coupling technique.Table 2 summarizes the achieved improvements in the SEC IR method development. The overall gain in S/N during the development was 9000. This could be reached by optimization of the spectrometer (detector, scanning procedure, beam path), specially designed ATR flow cells with six reflections and reduced dead volume (170 μL), adjusted SEC parameters (flow rate, column dimension, injected mass) and newly developed data treatment for solvent suppression. For nearly all samples chromatograms with S/N over the limit of detection (LOD, S/N > 3) and over the limit of quantification (LOQ, S/N > 10) can be recorded without overloading the SEC column thereby retaining full SEC separation power. Example measurements demonstrated the general fields of application: detection (e.g. of isorefractive polymer solvent combinations), identification and determination of the chemical composition as a function of molecular weight. The limits of the method arise from samples with similar IR spectra to the used solvent (e.g. PEG in THF) and samples with low IR absorptions (e.g. cis-PB). These limits were also explored with demonstration measurements.
| Parameter | Choice, settings or recommendation | Improvement in S/N during method development |
|---|---|---|
| FTIR: Detector | MCT | 11 |
| FTIR: Scanning procedure | Rapid scan, mirror velocity: 20 kHz or 40 kHz, resolution: 4 cm−1, upper spectrum limit: 5200 cm−1 | 6 |
| FTIR: Beam path | Fully optimized | 4 |
| Flow cell: Number of ATR reflections | 6 Reflections | 1.5–3.3 |
| Flow cell: Dead volume | Small, 170 μL | 1.4 |
| SEC: Flow rate | 1 mL min−1 | 2.6 |
| SEC: Column dimension | Semi preparative column (20 × 300 mm) | 1.05 |
| SEC: Injected mass | Close to overloading, >2 mg for semi preparative columns | 2 (lower limit, depending on sample) |
| Data treatment: Drift correction | Second order polynomial, enough reference data (see text) | — |
| Data treatment: Noise reduction | Region without IR peaks (e.g. 1800 cm−1–2000 cm−1) | 1.4 |
| Overall improvement | 9000 |
In many cases, a better S/N would be desirable. This might be possible with stronger IR light sources. The so called quantum cascade lasers (QCL), which have been recently developed and already have been coupled to chromatography, are one possibility.35–37 Still, the high noise level of these lasers moderates the gain in signal intensity. Nevertheless, future developments in the field of QCLs seem promising. With an improved spectroscopic device, it might be possible to not only detect a specific polymer, but also obtain more detailed information about the polymer. For example, it may be possible to gain additional information on the microstructure or branching points. Thus, the changes in topology as a function of molecular weight might possibly be measured in the future, see Fig. 1.
The new SEC FTIR coupling method presented here could also be applied to other chromatographic methods, if chemically sensitive detection is needed and fractionation is not an option. One possible application might be coupling with 2D chromatography, which has been reported for 1H-NMR spectroscopy38 and where final concentrations are even lower. However, as one spectrum per SEC chromatogram would be sufficient, the measurement time would be longer and could still result in sufficient S/N.
Last, the solvent suppression and especially the drift correction part could be applied to many other spectroscopic experiments. Solvent suppression is always problematic in FTIR spectroscopy. Whenever time resolved measurement and automated sample injection is possible, the solvent suppression method including drift correction described in this work can be applied. However, it is important to note that not only solvent signals can be corrected; any other reference subtraction can also be improved with this method including, for example, standard background measurements in IR spectroscopy. The requirement is that the reference and sample can be measured in a time dependent way without influencing the spectrometer (automated change between sample and reference).
Acknowledgements
T.B. thanks all the coauthors, editors, referees and everybody else involved in the production of this paper for allowing a strange sounding name for the method in order to achieve a remarkable abbreviation. The speedy help from Bruker GmbH (Ettlingen, Germany) – namely from Dr Arno Simon, Dr Albrecht Rager and Dr Markus Germer – is gratefully acknowledged as well as the fruitful discussions and a nice collaboration in general. This work would not have been possible without the team from the mechanical workshop at ITCP, who built all the flow cells. Thousand thanks go to Dr Jennifer Kübel, who measured the butadiene samples and proofread this manuscript. The authors acknowledge Prof. Harald Pasch, who inspired some experiments to determine the limitations of the method. The help of Dr Kathrin Reinheimer and Dr Alicia Malek-Luz for making various samples available is highly appreciated. Funding for this project was provided through the “Zentrales Inovationsprogramm Mittelstand” of the Bundesministerium für Wirtschaft und Energie, KF2473303NT2, KF2472302NT2.Notes and references
- J. L. Koenig, Spectroscopy of Polymers, Elsevier, Washington DC, 1999 Search PubMed.
- K.-F. Arndt and G. Müller, Polymercharakterisierung, Hanser Fachbuch, Munich, 1996 Search PubMed.
- B. Hunt and M. James, Polymer Characterization, Blackie Acad. & Professional, London, 1993 Search PubMed.
- D. A. Skoog, J. F. Holler and S. R. Crouch, Principles of Instrumental Analysis, Brooks Cole, Belmont, 2006 Search PubMed.
- T. Gruendling, S. Weidner, J. Falkenhagen and C. Barner-Kowollik, Polym. Chem., 2010, 1, 599–617 RSC.
- S. J. Kok, C. A. Wold, T. Hankemeier and P. J. Schoenmakers, J. Chromatogr. A, 2003, 1017, 83–96 CrossRef CAS PubMed.
- J. N. Willis, J. L. Dwyer and M. X. Liu, Int. J. Polym. Anal. Charact., 1997, 4, 21–29 CrossRef CAS.
- Spectra Analysis Inc. Home Page. http://www.spectra-analysis.com/products/ir-gpc.htm (accessed May, 2014).
- I. Krämer, H. Pasch, H. Händel and K. Albert, Macromol. Chem. Phys., 1999, 200, 1734–1744 CrossRef.
- V. Exarchou, M. Krucker, T. A. van Beek, J. Vervoort, I. P. Gerothanassis and K. Albert, Magn. Reson. Chem., 2005, 43, 681–687 CrossRef CAS PubMed.
- W. Hiller, H. Pasch, T. Macko, M. Hofmann, J. Ganz, M. Spraul, U. Braumann, R. Streck, J. Mason and F. Van Damme, J. Magn. Reson., 2006, 183, 290–302 CrossRef CAS PubMed.
- W. Hiller, H. Pasch, P. Sinha, T. Wagner, J. Thiel, M. Wagner and K. Müllen, Macromolecules, 2010, 43, 4853–4863 CrossRef CAS.
- M. Cudaj, G. Guthausen, T. Hofe and M. Wilhelm, Macromol. Rapid Commun., 2011, 32, 665–670 CrossRef CAS PubMed.
- M. Cudaj, G. Guthausen, T. Hofe and M. Wilhelm, Macromol. Chem. Phys., 2012, 213, 1933–1943 CrossRef CAS.
- P. J. DesLauriers, D. C. Rohlfing and E. T. Hsieh, Polymer, 2002, 43, 159–170 CrossRef CAS.
- C. Piel, A. Albrecht, C. Neubauer, C. W. Klampfl and J. Reussner, Anal. Bioanal. Chem., 2011, 400, 2607–2613 CrossRef CAS PubMed.
- G. W. Somsen, C. Gooijer and U. A. T. Brinkman, J. Chromatogr. A, 1999, 856, 213–242 CrossRef CAS.
- H. Pasch, Polym. Chem., 2013, 4, 2628–2650 RSC.
- T. F. Beskers, T. Hofe and M. Wilhelm, Macromol. Rapid Commun., 2012, 33, 1747–1752 CrossRef CAS PubMed.
- J. R. Runyon, D. E. Barnes, J. F. Rudd and L. H. Tung, J. Appl. Polym. Sci., 1969, 13, 2359–2369 CrossRef CAS.
- D. Held, LCGC The Column, 2010, 6, 16–22 Search PubMed.
- A. M. Striegel, W. W. Yau, J. J. Kirkland and D. D. Bly, Modern size-exclusion liquid chromatography, Wiley, Hoboken, 2009 Search PubMed.
- J. J. van Deemter, F. J. Zuiderweg and A. Klinkenberg, Chem. Eng. Sci., 1956, 5, 271–289 CrossRef CAS.
- V. Meyer, Practical High-Performance Liquid Chromatography, John Wiley & Sons, Chichester, 2010 Search PubMed.
- A. M. Striegel, J. Chromatogr. A, 2001, 932, 21–31 CrossRef CAS.
- S.-T. Popovici, W. T. Kok and P. J. Schoenmakers, J. Chromatogr. A, 2004, 1060, 237–252 CrossRef CAS PubMed.
- S.-T. Popovici and P. J. Schoenmakers, J. Chromatogr. A, 2005, 1099, 92–102 CrossRef CAS PubMed.
- I. Schnöll-Bitai, J. Chromatogr. A, 2005, 1084, 160–166 CrossRef PubMed.
- I. Schnöll-Bitai and C. Mader, J. Chromatogr. A, 2006, 1137, 198–206 CrossRef PubMed.
- T. Hofe, G. Reinhold and J. McConville, Chromatogr. Today, 2011, 11/12, 18–23 Search PubMed.
- Y. Liu, W. Radke and H. Pasch, Macromolecules, 2006, 39, 2004–2006 CrossRef CAS.
- A. Malek, N. Dingenouts, T. F. Beskers, U. Fehrenbacher, L. Barner and M. Wilhelm, Eur. Polym. J., 2013, 49, 2704–2720 CrossRef CAS PubMed.
- C. Schmid, J. Falkenhagen, T. F. Beskers, L.-T. T. Nguyen, M. Wilhelm, F. E. Du Prez and C. Barner-Kowollik, Macromolecules, 2012, 45, 6353–6362 CrossRef CAS.
- V. Thomsen, D. Schatzlein and D. Mercuro, Spectroscopy, 2003, 18, 112–114 CAS.
- A. Edelmann, C. Ruzicka, J. Frank, B. Lendl, W. Schrenk, E. Gornik and G. Strasser, J. Chromatogr. A, 2001, 934, 123–128 CrossRef CAS.
- J. Kuligowski, G. Quintás and B. Lendl, Appl. Phys. B, 2010, 99, 833–840 CrossRef CAS.
- T. F. Beskers, M. Brandstetter, J. Kuligowski, G. Quintas, M. Wilhelm and B. Lendl, Analyst, 2014, 139, 2057–2064 RSC.
- W. Hiller, M. Hehn, P. Sinha, J.-A. Raust and H. Pasch, Macromolecules, 2012, 45, 7740–7748 CrossRef CAS.
Footnote |
| † Electronic supplementary information (ESI) available: Flow cell construction, influence of overloading on the chemical composition distribution, detection of PS in toluene. See DOI: 10.1039/c4py01043d |
| This journal is © The Royal Society of Chemistry 2015 |

