DOI:
10.1039/C5QI00060B
(Research Article)
Inorg. Chem. Front., 2015,
2, 749-762
A Ni(II) dinuclear complex bridged by end-on azide-N and phenolate-O atoms: spectral interpretation, magnetism and biological study†
Received
11th April 2015
, Accepted 12th June 2015
First published on 12th June 2015
Abstract
A potential tetradentate monoanionic N2O2 chelator, HL, derived from the condensation of o-vanillin and N,N-dimethylethylenediammine, has been reacted with nickel perchlorate and sodium azide to yield the dinuclear Ni(II) complex [Ni(L)(μ1,1-N3)Ni(L)(OH2)2]·ClO4 (1), where L = Me2N(CH2)2N![[double bond, length as m-dash]](https://www.rsc.org/images/entities/char_e001.gif) CH–C6H3(O−)(OCH3). The complex has been characterized by X-ray diffraction analysis and different spectroscopic techniques. The coordination geometry around the Ni(II) centres is a distorted octahedron, with the azide ligand and the phenolato oxygen atom bridging in μ1,1 and μ2 mode, respectively. The EPR spectra, recorded at liquid nitrogen temperature (77 K) and room temperature (298 K), show g factors of 2.080 and 2.085, in agreement with the structure determined by X-ray diffraction analysis. The VTM study confirms that there are ferromagnetic interactions between the bridging binuclear Ni(II) ions (S = 1). The evaluation of cytotoxic effects on different human cancer cell lines (A-549, MCF-7 and CaCo-2) suggests that both the ligand and complex 1 have potential anticancer properties. Furthermore, they also exhibit anti-mycobacterial activity against M. tuberculosis H37Rv (ATCC 27294) and M. tuberculosis H37Ra (ATCC 25177) strains. Molecular docking of HL with the enoyl acyl carrier protein reductase of M. tuberculosis H37Rv (PDB ID: 4U0K) has been examined, showing that HL forms two hydrogen bonds with Lys165 (1.94 and 2.53 Å) in its best docked pose.
CH–C6H3(O−)(OCH3). The complex has been characterized by X-ray diffraction analysis and different spectroscopic techniques. The coordination geometry around the Ni(II) centres is a distorted octahedron, with the azide ligand and the phenolato oxygen atom bridging in μ1,1 and μ2 mode, respectively. The EPR spectra, recorded at liquid nitrogen temperature (77 K) and room temperature (298 K), show g factors of 2.080 and 2.085, in agreement with the structure determined by X-ray diffraction analysis. The VTM study confirms that there are ferromagnetic interactions between the bridging binuclear Ni(II) ions (S = 1). The evaluation of cytotoxic effects on different human cancer cell lines (A-549, MCF-7 and CaCo-2) suggests that both the ligand and complex 1 have potential anticancer properties. Furthermore, they also exhibit anti-mycobacterial activity against M. tuberculosis H37Rv (ATCC 27294) and M. tuberculosis H37Ra (ATCC 25177) strains. Molecular docking of HL with the enoyl acyl carrier protein reductase of M. tuberculosis H37Rv (PDB ID: 4U0K) has been examined, showing that HL forms two hydrogen bonds with Lys165 (1.94 and 2.53 Å) in its best docked pose.
Introduction
Metal complexes containing Schiff-base ligands derived from aromatic carbonyl compounds have been widely studied in connection with metallo-protein models because of the versatility of their steric and electronic properties, which can be fine-tuned by choosing the appropriate amine precursors and ring substituents.1 It has been recognized that the metal centres and the binding Schiff base ligands (as anions or capping molecules) may play important roles in the formation of desirable compounds, due to their different molecular shapes, charge and sizes.2 Besides, coligands can also be used to tune the properties of the resulting compounds. Several pseudohalide-bridged metal complexes with various Schiff bases continue to be a subject of much interest, and intensive investigations have taken place to shed light on their diverse structures and potential applications as magnetic materials.3 Among the pseudohalides, the azido group has received much attention due to its versatility as a bridging ligand and due to the wide variety of magnetic properties shown by its compounds. The versatile azide ion, which can indeed form dimers, clusters, and polymers exhibiting significant magnetic properties such as ferro- and antiferromagnetic interactions, has been extensively used because it may induce interesting magnetic couplings by two different bonding modes, i.e. end-on (μ1,1 ferromagnetic) and end-to-end (μ1,3 antiferromagnetic).4 It is worth reporting that the ferromagnetic ordering between the metal centres induced by the end-on or 1,1-coordination mode is reduced if the bridging bite angle exceeds 108°.5 The chemistry of nickel complexes with multidentate Schiff base ligands has also attracted great attention; indeed, magnetic exchange interactions between metal centres in binuclear nickel salts continue to be a subject of wide interest, with particular emphasis on determining magnetic structural correlations.6 Many structural parameters affect the superexchange mechanism in these sorts of dimers.7 Kahn8 has suggested that the exchange integral is the sum of two antagonistic interactions favoring the antiferromagnetic and ferromagnetic interactions.
Nickel complexes play an important role in bioinorganic chemistry and may provide the basis of models for active sites of biological systems or act as catalysts.9 Tuberculosis, an infectious and chronic bacterial disease, caused primarily by the bacillus Mycobacterium tuberculosis and rarely by M. bovis and M. africanum, affects the lung (pulmonary TB) and can even spread to the other organs (extrapulmonary TB).10 Millions of children die every year from this disease.11 Mycobacteria are resistant (multidrug resistant or MDR-TB) to many chemicals, disinfectants, antibiotics and chemo-therapeutical agents.12 Synthetic chemistry research is now directed to exploring the synergistic relationships between natural products and synthetic drugs for better treatment. Cytotoxicity assays are widely used in bio-inorganic chemistry to screen for cytotoxicity in compound libraries. Assessing cell membrane integrity is one of the most common ways to measure cell viability and cytotoxic effects. The control of tumor cell proliferation by inhibition of the cell cycle and induction of apoptosis could provide a therapeutic strategy for the treatment of cancer.13 Programmed cell death plays an important role in the regulation of cellular homeostasis.14 Marin-Hernandez et al.15 indicated that some mixed chelate transition metal-based drugs have more potent antitumor activity than cisplatin in in vivo and in vitro studies of a variety of tumor cells. However, human cancer cell lines are a useful model to study cell growth inhibition of tumor cells by natural compounds or newly synthesized compounds.
Recently, a unique example of bridge distance dependency of the exchange interaction has emerged from the magnetic properties of a μ-phenoxo-μ1,1-N3 dinickel(II) compound.16 In our present contribution, we report the structural description and DFT computation analysis of the Ni(II) derivative [Ni(L)(μ1,1-N3)Ni(L)(OH2)2]·ClO4 (1), where L = Me2N(CH2)2N![[double bond, length as m-dash]](https://www.rsc.org/images/entities/char_e001.gif) CH–C6H3(O−)(OCH3);17 additionally, the spectral properties and temperature-dependent magnetic behaviour of the complex are elucidated. Both the ligand HL and complex 1 exhibit anti-mycobacterial activity on M. tuberculosis H37Rv (ATCC 27294) and M. tuberculosis H37Ra (ATCC 25177) strains. The anti-mycobacterial efficiency of HL has been examined by molecular docking with the enoyl acyl carrier protein reductase of M. tuberculosis H37Rv (PDB ID: 4U0K) and has been compared with the first line drug isoniazide.
CH–C6H3(O−)(OCH3);17 additionally, the spectral properties and temperature-dependent magnetic behaviour of the complex are elucidated. Both the ligand HL and complex 1 exhibit anti-mycobacterial activity on M. tuberculosis H37Rv (ATCC 27294) and M. tuberculosis H37Ra (ATCC 25177) strains. The anti-mycobacterial efficiency of HL has been examined by molecular docking with the enoyl acyl carrier protein reductase of M. tuberculosis H37Rv (PDB ID: 4U0K) and has been compared with the first line drug isoniazide.
Experimental
Materials
o-Vanillin and 2-dimethylaminoethylamine (Merck) and sodium azide (Sigma-Aldrich) were purchased and used as received without further purification. Hydrated nickel(II) perchlorate was prepared by treatment of nickel(II) carbonate basic hydrate, NiCO3·2Ni(OH)2 (AR grade, E. Merck), with perchloric acid (AR grade, E. Merck), followed by slow evaporation on a steam bath. It was then filtered through a fine glass frit and stored in CaCl2 desiccators. All the solvents used were of reagent grade. The ligand (HL) synthesis was carried out following a published procedure.17
Physical measurements
Microanalytical data (C, H, and N) were collected on a Perkin-Elmer 2400 CHNS/O elemental analyzer. FTIR spectra were recorded on a Perkin-Elmer RX-1 spectrophotometer in the range 4000–400 cm−1 with KBr pellets. Electronic spectra were recorded on a Lambda 25 (UV–Vis–NIR) spectrophotometer in methanol. Emission spectra were examined with an LS 55 Perkin-Elmer spectrofluorometer at room temperature (298 K) in different solutions under degassed conditions. The fluorescence quantum yield of the complexes was determined using carbazole as a reference with a known ΦR of 0.42 in benzene.18 The complex and the reference dye were excited at the same wavelength, maintaining a nearly equal absorbance (∼0.1), and the emission spectra were recorded. The area of the emission spectrum was integrated using the software available in the instrument and the quantum yield was calculated according to the following equation:
Here, ΦS and ΦR are the fluorescence quantum yield of the sample and reference, respectively. AS and AR are the area under the fluorescence spectra of the sample and the reference, respectively, (Abs)S and (Abs)R are the respective optical densities of the sample and the reference solution at the wavelength of excitation, and ηS and ηR are the values of the refractive index for the respective solvent used for the sample and reference.19 EPR spectra were recorded from 0 to 10![[thin space (1/6-em)]](https://www.rsc.org/images/entities/char_2009.gif) 000 Gauss in the temperature range 77–298 K with an X-band (9.4 GHz) Bruker EMX spectrometer equipped with an HP 53150A microwave frequency counter. Magnetic properties were investigated with a Quantum Design MPMS-XL superconducting quantum interference device magnetometer (SQUID) at an applied field of 10
000 Gauss in the temperature range 77–298 K with an X-band (9.4 GHz) Bruker EMX spectrometer equipped with an HP 53150A microwave frequency counter. Magnetic properties were investigated with a Quantum Design MPMS-XL superconducting quantum interference device magnetometer (SQUID) at an applied field of 10![[thin space (1/6-em)]](https://www.rsc.org/images/entities/char_2009.gif) 000 Oe in the temperature range 5–300 K. Diamagnetic correction was carried out by using Pascal constants.
000 Oe in the temperature range 5–300 K. Diamagnetic correction was carried out by using Pascal constants.
Synthesis of the ligand, HL
The ligand, HL, 2-[{[2-(dimethylamino)ethyl]imino}methyl]-6-methoxyphenol, was prepared17 by condensation of o-vanillin (0.152 g, 1.0 mmol) with 2-dimethylaminoethylamine (0.109 ml, 1 mmol) in methanol (15 mL). After 2 h reflux, the pale yellow methanolic solution was cooled down to room temperature. The solvent was removed under reduced pressure, and the Schiff-base ligand was obtained as a light-yellow liquid that was used without further purification. 1H NMR (TMS, CDCl3) δ: 12.80 (1H, s, H-1,), 9.90 (1H, s, H-6,6′), 6.46–6.86 (3H, d & t, Ar-H), 3.86 (3H, s, H-6), 3.45 (2H, t, J = 4.5 Hz, H-7), 3.72 (2H, t, J = 3.4 Hz, H-8), 2.29 (6H, s, H-9) ppm (see ESI, Fig. S1†).
Synthesis of the complex (1)
Upon the addition of HL (1 mmol) in methanol (20 mL) to Ni(ClO4)2·6H2O (0.36 g, 1 mmol) in the same solvent the mixture was stirred for half an hour and then a solution of NaN3 (0.03 g, 0.5 mmol) in the minimum volume of water was added, and the reaction mixture was kept undisturbed and allowed to evaporate slowly. After ten days, dark brown, rectangular-shaped single crystals of 1 were obtained. The crystals were filtered off, washed with water and dried in air. Yield: 71%. Anal. Calc. for C24H42Ni2N7O12Cl: C, 37.23; H, 5.47; N, 12.67. Found: C, 37.73; H, 5.09; N, 12.83%.
X-ray crystallography
The crystal structure of complex 1 was determined by X-ray diffraction methods. Crystal data and experimental details for data collection and structure refinement are reported in Table 1. Intensity data and cell parameters were recorded at 293(2) K on a Bruker Breeze (MoKα radiation = 0.71069 Å) equipped with a CCD area detector and a graphite monochromator. No significant crystal decay was observed. The raw frame data were processed using SAINT and SADABS to yield the reflection data file.20 The structure was solved by direct methods using the SIR97 program21 and refined on Fo2 by full-matrix least-squares procedures, using the SHELXL-97 program22 in the WinGX suite v.1.80.05.23 All non-hydrogen atoms were refined with anisotropic atomic displacements with the exception of the oxygen atoms of the perchlorate ion and the oxygen atoms of the lattice water molecules. The hydrogen atoms were included in the refinement at idealized geometry (C–H 0.95 Å) and refined “riding” on the corresponding parent atoms. The weighting scheme used in the last cycle of refinement was w = 1/[σ2Fo2 + (1016)2], where P = (Fo2 + 2Fc2)/3. Crystallographic data (excluding structure factors) for the structure reported have been deposited with the Cambridge Crystallographic Data Centre as supplementary publication no. CCDC 894363.
Table 1 Crystallographic data of complex 1
|
Goodness-of-fit S = [∑w(Fo2 − Fc2)2/(n − p)]1/2, where n is the number of reflections and p is the number of parameters.
R
1 = ∑||Fo| − |Fc||/∑|Fo|, wR2 = [∑[w(Fo2 − Fc2)2]/∑[w(Fo2)2]]1/2.
|
| Empirical formula |
C24H42ClN7O12Ni2 |
| Formula weight |
773.52 |
| Temperature |
293(2) |
| Wavelength (Å) |
0.71069 |
| Crystal system |
Monoclinic |
| Space group |
P21 |
|
a, Å |
11.748(2) |
|
b, Å |
11.093(1) |
|
c, Å |
13.278(2) |
|
β, ° |
100.963(2) |
| Volume, Å3 |
1698.8(4) |
|
Z
|
2 |
|
D
calc. (mg m−3) |
1.512 |
|
μ (Mo Kα) (mm−1) |
1.254 |
|
F(000) |
808 |
|
θ range for data collection |
1.56–28.34 |
| Reflections collected/unique |
24![[thin space (1/6-em)]](https://www.rsc.org/images/entities/char_2009.gif) 015/8462 [R(int) = 0.0416 015/8462 [R(int) = 0.0416 |
| Observed reflections [Fo > 4σ(Fo)] |
5861 |
| Data/restraints/parameters |
8462/4/390 |
Goodness-of-fit on F2![[thin space (1/6-em)]](https://www.rsc.org/images/entities/char_2009.gif) a a |
0.991 |
| Final R indices [Fo > 4σ(Fo)]b |
R
1 = 0.0543, wR2 = 0.1408 |
|
R indices (all data) |
R
1 = 0.0882, wR2 = 0.1641 |
| Largest diff. peak and hole, e Å−3 |
0.687 and −0.663 |
Theoretical calculations
Full geometry optimization of 1 and 2 was carried out using density functional theory (DFT) at the B3LYP level.24 All calculations were performed using the Gaussian 03 program package25 with the aid of the Gauss View visualization program.26 For C, H, N, O, and Cl the 6-31G(d) basis set was assigned, while for Cu and Ni the LanL2DZ basis set with effective core potential was employed.27 The vibrational frequency calculations were performed to ensure that the optimized geometries represent the local minima and there are only positive eigenvalues. Vertical electronic excitations based on B3LYP optimized geometries were computed using the time-dependent density functional theory (TD-DFT) formalism28–30 in acetonitrile using the conductor-like polarizable continuum model (CPCM).31 Gauss sum was used to calculate the fractional contributions of various groups to each molecular orbital.32
Anti-mycobacterial activity
Microorganisms.
In the antimycobacterial assay, M. tuberculosis H37Rv (ATCC 27294), M. tuberculosis H37Ra (ATCC 25177) strains and two clinical strains (strain-1 and strain-2) obtained from the hospital were used.
Medium.
In the assays, Mycobacteria Growth Indicator Tubes (MGIT) and their supplements, BBL MGIT OADC enrichment and BBL MGIT PANTA, were purchased from BD. The MGIT contains 4 mL of modified Middlebrook 7H9 Broth base.
Inoculum preparation.
For the cultivation of mycobacteria, the MGIT (Mycobacteria Growth Indicator Tube), a fluorescent compound, is embedded in silicone on the bottom, and then 4 mL of modified Middlebrook 7H9 Broth base are added to the mixture. After that, 0.5 mL of OADC enrichment (an oleic acid, albumin, dextrose and catalase) and PANTA antibiotic mixture to prevent the proliferation of any non-mycobacteria (0.1 mL) are added to this medium. Tubes are incubated at 37 °C. For the positive control, MGIT tubes are prepared by inoculating bacteria, and tube reading was started on the second day of incubation using a Micro MGIT fluorescence reader which uses long wavelength UV light.33 To prepare the inoculum the positive tubes (day 1 or day 2 positive) are used directly as inoculums. The positive tubes between day 3 and day 5 are diluted to 1![[thin space (1/6-em)]](https://www.rsc.org/images/entities/char_2009.gif) :
:![[thin space (1/6-em)]](https://www.rsc.org/images/entities/char_2009.gif) 4 ratio using sterile saline. Inoculums, prepared from a day 1 to day 5 MGIT 7 mL positive tube, range between 0.8 × 10⁵ and 3.2 × 10⁵ CFU per mL. Each assay is performed according to the MGIT manual fluorometric susceptibility test procedure recommended by the manufacturer.33,34
4 ratio using sterile saline. Inoculums, prepared from a day 1 to day 5 MGIT 7 mL positive tube, range between 0.8 × 10⁵ and 3.2 × 10⁵ CFU per mL. Each assay is performed according to the MGIT manual fluorometric susceptibility test procedure recommended by the manufacturer.33,34
Antimycobacterial susceptibility assay.
The activity of the ligand, HL, and complex 1 against M. tuberculosis strains was tested using the Microplate Presto Blue Assay (MPBA) by the method described by Collins & Franzblau35 and modified by Jimenez-Arellanes et al.36 100 μl of the compound was transferred to the first column; then 100 μl of 7H9 broth was transferred from column 1 to column 10. Columns 11 and 12 were negative and positive controls respectively. 100 μl of the compound were transferred from column 1 to column 2. Then it was mixed using pipettes three times; the procedure was repeated to provide serial 1![[thin space (1/6-em)]](https://www.rsc.org/images/entities/char_2009.gif) :
:![[thin space (1/6-em)]](https://www.rsc.org/images/entities/char_2009.gif) 2 dilutions. 100 μl of excess medium was discarded from the wells in column 10. Final test concentration ranges were 512–1 μg ml−1 in the mixture. Microplates were inoculated with the bacterial suspension (20 μL per well) except for the negative control and incubated at 37 °C for 6 days. Presto blue (15 μL, Life Technologies) was then added to the bacterial growth control wells (without compound) and the microplates were incubated at 37 °C for an additional 24 h. If the dye turned from blue to pink/red (indicating positive bacterial growth), the Presto blue solution was added to the other wells to determine the MIC values. All tests were performed in triplicate. The minimal inhibitory concentration (MIC) was defined as the lowest concentration of the sample that prevents a colour change to pink/red. To determine the minimal bactericidal concentration (MBC) values, MIC concentration-wells and higher concentration wells were used. To each well it was transferred fresh 7H9 broth (185 μL) and added a mycobacterial suspension (15 μL). Plates were incubated at 37 °C for 6 days. The MBC corresponded to the minimum compound concentration which does not cause a colour change in the cultures when re-incubated in fresh medium.37 Streptomycin (STR), ethambutol (EMB), rifampicin (RFP) and isoniazid (INH) were used as standard drugs.
2 dilutions. 100 μl of excess medium was discarded from the wells in column 10. Final test concentration ranges were 512–1 μg ml−1 in the mixture. Microplates were inoculated with the bacterial suspension (20 μL per well) except for the negative control and incubated at 37 °C for 6 days. Presto blue (15 μL, Life Technologies) was then added to the bacterial growth control wells (without compound) and the microplates were incubated at 37 °C for an additional 24 h. If the dye turned from blue to pink/red (indicating positive bacterial growth), the Presto blue solution was added to the other wells to determine the MIC values. All tests were performed in triplicate. The minimal inhibitory concentration (MIC) was defined as the lowest concentration of the sample that prevents a colour change to pink/red. To determine the minimal bactericidal concentration (MBC) values, MIC concentration-wells and higher concentration wells were used. To each well it was transferred fresh 7H9 broth (185 μL) and added a mycobacterial suspension (15 μL). Plates were incubated at 37 °C for 6 days. The MBC corresponded to the minimum compound concentration which does not cause a colour change in the cultures when re-incubated in fresh medium.37 Streptomycin (STR), ethambutol (EMB), rifampicin (RFP) and isoniazid (INH) were used as standard drugs.
Cytotoxicity study
Cell culture.
A-549 (non-small cell lung cancer), MCF-7 (breast cancer), Caco-2 (colon cancer cell line) and healthy cell lines, CRL-2522 (human normal fibroblast), were used in the study, provided by ATCC cell bank. The cells were grown in RPMI 1640 medium supplemented with 2 mM L-glutamine, 10% fetal bovine serum, and 1% penicillin–streptomycin at a temperature of 37 °C in a humidified incubator under a 5% CO2 atmosphere.
Cell viability test by the MTT assay.
The MTT [3-(4,5-dimethylthiazol-2-yl)-2,5-diphenyl tetrazolium bromide] assay was performed to determine the effect of the ligand, HL, and complex 1; the following concentrations (500, 250, 125, 62.5, 31.25, 15.625, 7.8125, 3.9, 1.95, 0.97 μg ml−1) were seeded on 5 × 10³ cells which were cultivated in each well of the plate with 96 wells. After 24 hours of incubation, 0.1 ml MTT working solution (0.5 mg mL−1) was added to each well and they were incubated at 37 °C in a 5% CO2 incubator for 3–4 hours. After that, the unreacted dye was removed and the insoluble formazan crystals38 were dissolved in DMSO. The absorbance intensity of the living cells on the plate was measured in an ELISA device (Cytation3, Biotek, USA) at 540 nm. The acquired absorbance values corresponded to metabolic activities in the cells in culture media. Because this value was correlated with the number of living cells, the results were expressed in liveliness percent and calculated using the formula below:
Docking studies
Molecular docking is used to predict how a protein interacts with small molecules. The crystal structure of the enoyl acyl carrier protein reductase of M. tuberculosis H37Rv was downloaded from the RCSB protein data bank (http://www.pdb.org) and used for docking. The protein (PDB id: 4U0K) was co-crystallized with (3S)-N-(5-chloro-2-methylphenyl)-1-cyclohexyl-5-oxopyrrolidine-3-carboxamide and nicotinamide-adenine-dinucleotide. In silico docking studies were performed using the CDOCKER module of the Receptor–Ligand interactions protocol section of Discovery Studio client 3.5.39 Initially there was a pre-treatment process for the protein and the ligand. The structure of the ligand was drawn in Chemdraw 5.0, saved as a .mol file and finally the .mol file was imported to the Discovery Studio 4.0 platform. The ligand preparation was done using the Prepare Ligand module in the Receptor–Ligand interactions tool of Discovery Studio 4.0 and the prepared ligand was hence used for docking. The protein preparation was done using the Prepare Protein module of the Receptor–Ligand interactions tool of Discovery Studio 4.0 and that was used for docking. We subsequently defined the protein as the total receptor and the active site was selected based on the ligand binding domain of (3S)-N-(5-chloro-2-methylphenyl)-1-cyclohexyl-5-oxopyrrolidine-3-carboxamide and nicotinamide-adenine-dinucleotide. Then the pre-existing ligand was removed and the prepared ligand was placed instead. The most favourable docked pose was selected according to the minimum free energy of the protein–ligand complex and analysed to investigate the interaction.
ADMET prediction
Absorption, distribution, metabolism, excretion and toxicity (ADMET) predictions were done using the ADMET descriptor module of the Small molecules protocol of Discovery Studio client 4.0. Also the druglikeness of the compounds was checked following Lipinski's rule of five.40,41
Results and discussion
Synthesis and formulation
The monoanionic Schiff base precursor [2-[{[2-(dimethylamino)ethyl]imino}methyl]-6-methoxyphenol] (HL) was prepared by the condensation of o-vanillin and N,N-dimethylethylenediammine (1![[thin space (1/6-em)]](https://www.rsc.org/images/entities/char_2009.gif) :
:![[thin space (1/6-em)]](https://www.rsc.org/images/entities/char_2009.gif) 1 mole proportion) in methanol. HL was then reacted with Ni(ClO4)2·6H2O and NaN3 in a methanol/water mixture to yield [Ni(L)(μ1,1-N3)Ni(L)(OH2)2]·ClO4 (1), where L = Me2N(CH2)2N
1 mole proportion) in methanol. HL was then reacted with Ni(ClO4)2·6H2O and NaN3 in a methanol/water mixture to yield [Ni(L)(μ1,1-N3)Ni(L)(OH2)2]·ClO4 (1), where L = Me2N(CH2)2N![[double bond, length as m-dash]](https://www.rsc.org/images/entities/char_e001.gif) CH–C6H3(O−)(OCH3), by slow evaporation of the solvent. The 1H NMR spectrum of HL shows singlet signals at δ 12.80 and 9.90 ppm for –OH and –CH
CH–C6H3(O−)(OCH3), by slow evaporation of the solvent. The 1H NMR spectrum of HL shows singlet signals at δ 12.80 and 9.90 ppm for –OH and –CH![[double bond, length as m-dash]](https://www.rsc.org/images/entities/char_e001.gif) N protons, respectively. Furthermore, the singlet signals at δ 3.86 ppm and 2.29 ppm refer to –OCH3 and –N(CH3)2 protons, respectively. In addition, two triplet signals at δ 3.45 and 3.07 ppm are assigned to 7-H and 8-H protons with J values of 4.5 and 3.4 Hz respectively. The corresponding aromatic protons appear as doublet and triplet signals in the region 6.46–6.86 ppm. The FTIR spectrum of the free ligand shows bands at 3436 cm−1 and 1660 cm−1 which are due to the stretching frequencies of ν(O–H) and ν(C
N protons, respectively. Furthermore, the singlet signals at δ 3.86 ppm and 2.29 ppm refer to –OCH3 and –N(CH3)2 protons, respectively. In addition, two triplet signals at δ 3.45 and 3.07 ppm are assigned to 7-H and 8-H protons with J values of 4.5 and 3.4 Hz respectively. The corresponding aromatic protons appear as doublet and triplet signals in the region 6.46–6.86 ppm. The FTIR spectrum of the free ligand shows bands at 3436 cm−1 and 1660 cm−1 which are due to the stretching frequencies of ν(O–H) and ν(C![[double bond, length as m-dash]](https://www.rsc.org/images/entities/char_e001.gif) N) respectively. The two ν(C–O) bands for C–OH and C–OMe are observed at 1260 and 1086 cm−1 respectively.42 In the complex, a distinct band appears at 1634 cm−1 corresponding to the azomethine (C
N) respectively. The two ν(C–O) bands for C–OH and C–OMe are observed at 1260 and 1086 cm−1 respectively.42 In the complex, a distinct band appears at 1634 cm−1 corresponding to the azomethine (C![[double bond, length as m-dash]](https://www.rsc.org/images/entities/char_e001.gif) N) functional group.43 The lowering of the stretching frequency from 1660 to 1634 cm−1 indicates the coordination to the metal center. The ν(C–O) band is shifted to 1217 cm−1 on complexation. Furthermore, the complex shows one sharp band at 2072 cm−1, which indicates the presence of N3 as a bridging ligand. Bands in agreement with the non-coordinated perchlorate anion could also be observed at 1110 cm−1 along with a weak shoulder at 629 cm−1. The ν(M–N) and ν(M–O) stretching frequencies are observed at 462, 339 and 278 cm−1.
N) functional group.43 The lowering of the stretching frequency from 1660 to 1634 cm−1 indicates the coordination to the metal center. The ν(C–O) band is shifted to 1217 cm−1 on complexation. Furthermore, the complex shows one sharp band at 2072 cm−1, which indicates the presence of N3 as a bridging ligand. Bands in agreement with the non-coordinated perchlorate anion could also be observed at 1110 cm−1 along with a weak shoulder at 629 cm−1. The ν(M–N) and ν(M–O) stretching frequencies are observed at 462, 339 and 278 cm−1.
Crystal structure
The molecular structure of the dinuclear nickel compound [Ni(L)(μ1,1-N3)Ni(L)(OH2)2]ClO4·2H2O (1) is shown in Fig. 1 (for the ORTEP view with the complete labeling scheme see ESI, Fig. S2†). Relevant bond lengths and angles are given in Table 2. The cationic complex comprises two nickel(II) ions, two monodeprotonated [2-[{[2-(dimethylamino)ethyl]imino}methyl]-6-methoxyphenol] ligands (tagged with labels A and B) roughly perpendicular to each other, a bridging azide anion and two water molecules.
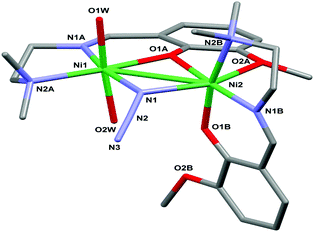 |
| | Fig. 1 Molecular structure of the cationic complex 1 with a partial labeling scheme. The perchlorate anion and the lattice water molecules have been omitted for clarity. The two ligands are tagged with labels A and B. | |
Table 2 Selected bond lengths [Å] and angles [°] for complex 1
| Ni1–O1A |
1.997(4) |
Ni2–O1B |
2.005(3) |
N2A–Ni1–O1A |
173.29(9) |
| Ni1–N1A |
2.020(8) |
Ni2–N1B |
1.999(6) |
N1A–Ni1–N1 |
167.37(9) |
| Ni1–N2A |
2.129(7) |
Ni2–N2B |
2.156(4) |
O1W–Ni1–O2W |
173.89(9) |
| Ni1–N1 |
2.117(5) |
Ni2–N1 |
2.145(5) |
N2B–Ni2–O1B |
170.42(9) |
| Ni1–O1W |
2.116(4) |
Ni2–O1A |
2.000(5) |
O2A–Ni2–N1 |
153.10(9) |
| Ni1–O2W |
2.119(4) |
Ni2–O2A |
2.275(5) |
N1B–Ni2–O1A |
174.80(9) |
| Ni1–Ni2 |
3.168(2) |
Ni1–N1–Ni2 |
96.04(9) |
Ni1–O1A–Ni2 |
104.87(9) |
The dimer is assembled via the μ2-nitrogen atom N1 of the azide anion and the μ2-oxygen atom O1A of ligand A. Each metal center is in an octahedral NiN3O3 environment (more distorted for Ni2) but provided by a different set of ligands. Indeed, in the case of Ni1, only the Schiff base A is involved in the coordination; the equatorial plane is occupied by the imino and amino nitrogen atoms N1A and N2A, by the bridging nitrogen atom N1 of the azide anion and by the bridging phenolato oxygen O1A. The coordination is completed by two water oxygen atoms in the apical position. Ni2, which, in contrast, does not coordinate any water molecule, is chelated by both ligands A and B. In particular, considering the plane passing through ligand A as the equatorial plane, the metal center is surrounded by the bridging atoms O1A and N1, by the methoxy oxygen atom O2A and by the imino nitrogen atom N1B. In this case the apical positions are this time occupied by the amino nitrogen N2B and by the phenolate oxygen O1B. The potentially coordinating oxygen O2B remains dangling without taking part in any interaction.
The crystal structure is stabilized by a network of hydrogen bonds (relevant geometrical parameters are reported in Table 3) comprising the perchlorate anion, the coordinated and lattice water molecules, and the azide ligand. In particular, the complexes form a 1D supramolecular chain along the b direction of the unit cell through the O2W⋯N3 H-bond, involving one of the water molecules coordinated to Ni1 and the terminal nitrogen atom of the azide ligand bridging the two nickel centers (see Fig. 2). These chains are in turn connected by means of the hydrogen bonds involving the coordinated water molecule O1W, the lattice water molecules O3W and O4W, and the perchlorate anion (Fig. 3).
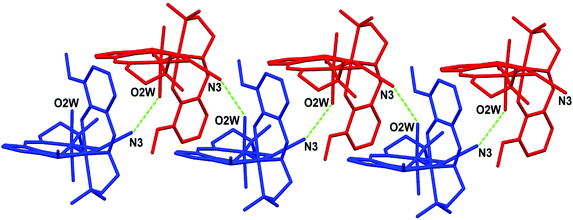 |
| | Fig. 2 Representation of the 1D supramolecular chain formed through H-bond interactions (green dotted lines) between the water oxygen O2W and the azide nitrogen N3. | |
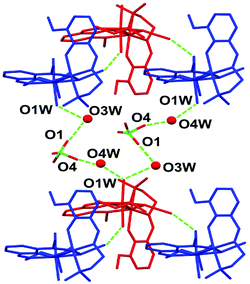 |
| | Fig. 3 The network of hydrogen bonds connecting the adjacent chains in the lattice. | |
Table 3 Relevant geometrical parameters for the hydrogen bonds in complex 1
| O2W⋯N3 |
2.99(1) |
O1⋯O3W |
2.78(2) |
| O1W⋯O3W |
2.86(1) |
O4⋯O4W |
2.35(2) |
| O1W⋯O4W |
2.75(1) |
|
|
Electronic spectra
The peaks in the electronic spectrum of complex 1 in methanol are similar, exhibiting d–d maxima typical of octahedral NiII.44 In the ligand, the maximum absorption bands are ascertained to be at 232 and 315 nm which may arise due to π → π* and n → π* transitions. On complexation, the corresponding π → π* and n → π* bands are shifted from 235 to 282 nm and 315 to 382 nm, respectively (see ESI, Fig. S3†). The characteristic d–d band for a Ni(II) complex is recognised at 410 and 635 nm.
The spectral properties are explained by the DFT computation of the optimized structure of complex 1. The orbital energies along with the contributions from the ligands and the metal for selected MOs are given in Fig. 4 (see details in the ESI, Table S1†). Although the orbital contribution of the ligands (L and H2O) predominates in most cases in both filled and vacant MOs LUMO+1, LUMO+8 and HOMO−10 show a higher metal contribution. In the complex, it is observed that the occupied MOs HOMO, HOMO−3 and HOMO−6 and the unoccupied MOs from LUMO+3 to LUMO+7 all have more than 60% ligand contribution. Similarly, also the water contribution is significant in complex 1, being ∼60% for the MOs HOMO−1, HOMO−2, HOMO−4, HOMO−5 and LUMO. The contribution of the bridging ligand azide is almost insignificant in both occupied and unoccupied MOs with the exception of LUMO+9 which contains 60% azide function. In the complex, Ni contributes in an irregular fashion: 7% to HOMO, 15% to HOMO−1, 16% to HOMO−3, 8% to HOMO−7, 44% to HOMO−11 and 8% to LUMO, 42% to LUMO+1, 38% to LUMO+2, 38% to LUMO+3, 60% to LUMO+8 etc. Thus it is the ligands L and H2O that mainly control the molecular orbitals and hence the spectral properties of the complex. Therefore HOMO → LUMO is considered as L(π) → H2O(π*); HOMO−3 → LUMO+3 is LLCT involving the L function (L(π) → L(π*)) whereas HOMO−1 → LUMO+8 is designated as the LMCT transition (H2O(π) → Ni(dπ)) and HOMO−11 → LUMO is designated as MLCT (Ni(dπ) → H2O(π*)). The calculated transitions are grouped in Table 4. The intensity of these transitions has been assessed from the oscillator strength (f). In methanol, the longest wavelength band calculated at >650 nm (f, 0.0100) for 1 is assigned to the Ni(dπ) → H2O(π*) transition followed by a highly intense transition at 411 nm (f, 0.0102) which is LLCT (L(π) → L(π*)) in nature. The other bands at 385 and 283 nm are LLCT in character whereas the high intensity band at 234 nm (f, 0.1510) is attributed to the H2O(π) → Ni(dπ) transition.
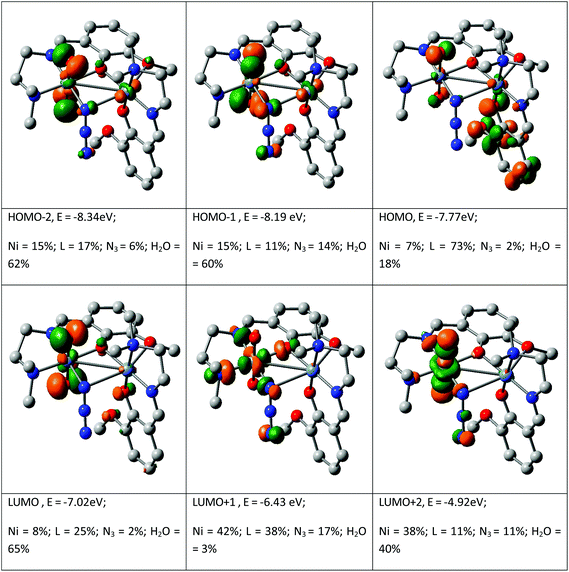 |
| | Fig. 4 Contour plots of some selected MOs of [Ni(L)(μ1,1N3)Ni(L)(OH2)2]·ClO4. | |
Table 4 TD-DFT data of [Ni(L)(μ1,1-N3)Ni(L)(OH2)2]·ClO4![[thin space (1/6-em)]](https://www.rsc.org/images/entities/char_2009.gif) a
a
| Excitation energy (eV) |
Wavelength (nm) |
f
|
Key transitions |
Character |
Assignment |
|
LLCT (L(π) → L(π*)); MLCT (metal to ligand charge transfer); LLCT (ligand to ligand charge transfer); LMCT (ligand to metal charge transfer).
|
| 1.9019 |
651.90 |
0.0100 |
(32%) HOMO−11 → LUMO |
Ni(dπ) → H2O(π*) |
MLCT |
| 3.0144 |
411.31 |
0.0102 |
(62%) HOMO → LUMO+5 |
L(π) → L(π*) |
LLCT |
| 3.2141 |
385.75 |
0.0134 |
(30%) HOMO−3 → LUMO+3 |
L(π) → L(π*) |
LLCT |
| 3.8999 |
317.92 |
0.0690 |
(18%) HOMO−7 → LUMO+3 |
H2O(π) → L(π*) |
LLCT |
| 4.3694 |
283.76 |
0.0152 |
(68%) HOMO−13 → LUMO+2 |
L(π) → H2O(π*) |
LLCT |
| 5.2873 |
234.49 |
0.1510 |
(9%) HOMO−1 → LUMO+8 |
H2O(π) → Ni(dπ) |
LMCT |
Emission spectra
Fluorescence studies of the ligand HL and complex 1 were carried out in methanol and the corresponding diagram is shown in Fig. 5. The emission bands of HL are observed at 364 and 423–445 nm upon exciting the π → π* band while the maximum emission is found at 423 nm upon excitation at 315 nm. Complex 1 exhibits very low fluorescence efficiency when it is excited at the π → π* transition and the maximum intensity occurs at 419 nm for λex = 281 nm. No emission bands are detected at higher wavelength (>400 nm). The fluorescence quantum yield of the ligand and the complex was determined using carbazole as the reference with a known quantum yield value in benzene (ΦR = 0.42). The fluorescence quantum yield of the complex corresponds to a π → π* transition band at 281 nm which is lower (0.005) than that of the ligand (0.022). This indicates the presence of energy transfer between the metal ion and the fluorophore ligand which coincides with a strong quenching of fluorescence.45
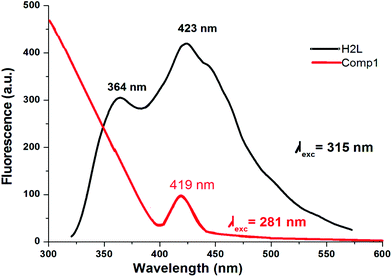 |
| | Fig. 5 Emission spectra of HL (black curve, in DMF) and of the Ni(II) complex (1) (red curve, in MeOH). | |
EPR spectra
EPR spectra of the polycrystalline complex 1 were recorded at liquid nitrogen temperature (77 K) and room temperature (298 K). The spectra are shown in Fig. 6. Ni(II) has a d8 configuration and its EPR spectra can be interpreted using an S = 1 spin Hamiltonian. Even if it does not possess a Kramer doublet as the lowest state in a magnetic field, usually spectra can be recorded for octahedral complexes.46 The spectra reported in traces a and b of Fig. 6 can be interpreted with a nearly isotropic g tensor with g factors of 2.158 and 2.085 (298 K, trace a) and 2.182 and 2.080 (77 K, trace b), in agreement with the structure determined by X-ray diffraction analysis.
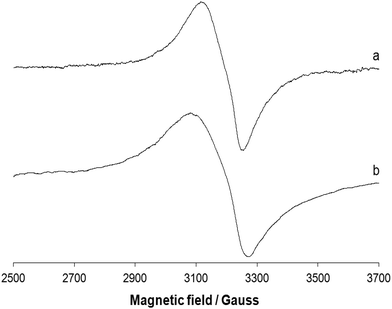 |
| | Fig. 6 X-band EPR spectra of the polycrystalline complex 1 at (a) 298 and (b) 77 K. | |
The EPR signal disappears almost completely when the solid complex 1 is dissolved in a coordinating solvent such as DMF (or DMSO, spectrum not shown) and in a weakly coordinating solvent such as CH3CN (Fig. 7). This indicates a diamagnetic ground state with S = 0, which can be associated with a square planar geometry.47 This means that in the presence of a coordinating solvent the two bridges are broken and mononuclear units are formed with the coordination of the tridentate ligand and a solvent molecule in the fourth equatorial position (Scheme 1). The tendency of polynuclear metal complexes to dissociate in solution is now a well-accepted fact in the literature and has been demonstrated in many cases, for example in the case of di- and polymeric Cu(II) species.48
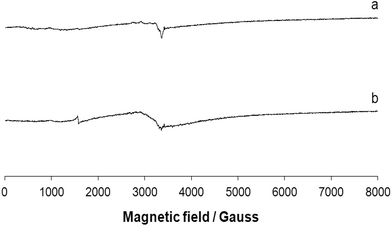 |
| | Fig. 7 Anisotropic X-band EPR spectra of the complex 1 dissolved in (a) DMF and (b) CH3CN. | |
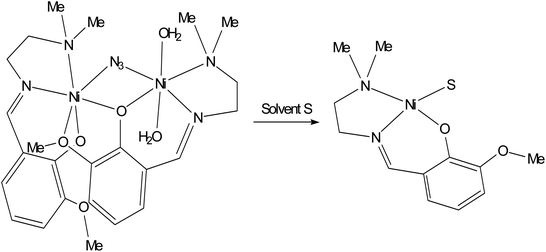 |
| | Scheme 1 Dissociation of complex 1 in the presence of a coordinating solvent S (S = DMF, DMSO, CH3CN). | |
Magnetic moment
The temperature variation of the magnetic properties (in the temperature range from 5 to 300 K under an external field of 10![[thin space (1/6-em)]](https://www.rsc.org/images/entities/char_2009.gif) 000 Oe) of complex 1 in the form of a χmT vs. T (χmvs. T inset) plot is shown in Fig. 8 (χm is the molar susceptibility for two Ni(II) ions). At room temperature, the χmT value is 4.33 emu K G−1 mol−1. When lowering the temperature, the χmT value increases gradually to a maximum value of 5.82 emu K G−1 mol−1 at 18 K. It then decreases sharply with decreasing temperature and reaches a minimum of 4.81 emu K G−1 mol−1 at 5 K. This behaviour suggests that there are ferromagnetic interactions between the bridging binuclear Ni(II) ions (S = 1), because of the super-exchange interaction.
000 Oe) of complex 1 in the form of a χmT vs. T (χmvs. T inset) plot is shown in Fig. 8 (χm is the molar susceptibility for two Ni(II) ions). At room temperature, the χmT value is 4.33 emu K G−1 mol−1. When lowering the temperature, the χmT value increases gradually to a maximum value of 5.82 emu K G−1 mol−1 at 18 K. It then decreases sharply with decreasing temperature and reaches a minimum of 4.81 emu K G−1 mol−1 at 5 K. This behaviour suggests that there are ferromagnetic interactions between the bridging binuclear Ni(II) ions (S = 1), because of the super-exchange interaction.
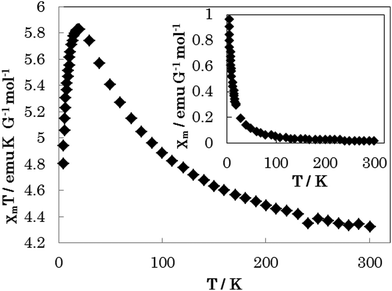 |
| | Fig. 8 The temperature-dependent magnetic susceptibility data for 1 were measured in the temperature range from 5 to 300 K under an external field of 10![[thin space (1/6-em)]](https://www.rsc.org/images/entities/char_2009.gif) 000 Oe. 000 Oe. | |
Antimycobacterial activity
In the anti-mycobacterial assay, HL and complex 1 were tested against M. tuberculosis H37Rv and M. tuberculosis H37Ra strains as well as against two clinical strains (strain-1 and strain-2). The results are shown in Table 5. M. tuberculosis H37Rv and M. tuberculosis H37Ra, a well-known indicator, are used for the drug sensitivity tests.12 The MIC and the MBC of HL for M. tuberculosis H37Rv are 4 and 8 μg mL−1, while the MIC and MBC of complex 1 are 8 μg mL−1. Although HL shows the same MIC value against M. tuberculosis H37Rv and M. tuberculosis H37Ra, the MBC value against M. tuberculosis H37Ra is higher than that against M. tuberculosis H37Rv. On the other hand, the highest MIC and MBC values in the clinical isolates have been found for strain-1 (MIC 16 μg mL−1 and MBC 32 μg mL−1) in the case of HL and for strain-2 (MIC 32 μg mL−1 and MBC 64 μg mL−1) in the case of complex 1. The results show that the compounds exhibit antimycobacterial activity against the tested drug resistant and drug susceptible M. tuberculosis strains with MIC at 4 μg ml−1 and MBC in the range of 8–16 μg mL−1. Clinical strains are also affected by the compounds with MIC 8–32 μg mL−1 and MBC 16–64 μg mL−1 (Table 5). Both HL and complex 1 show bactericidal activity. The ligand HL is more effective against drug resistant and drug susceptible M. tuberculosis and clinical isolates than complex 1 (Fig. 9). In this study, we state that both compounds show a considerable efficacy on the mycobacterial strains. The mycobacterial cell wall includes a large amount of complex lipids, lipopolysaccharides and mycolic acids. This constitution makes the cell wall a strong hydrophobic barrier against antimicrobial agents.49
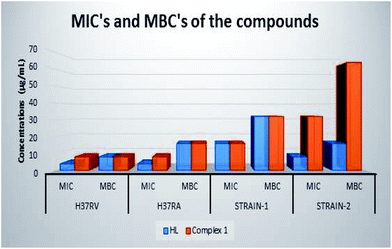 |
| | Fig. 9 MIC's and MBC's of HL and complex 1. | |
Table 5 Minimal inhibitory concentration (MIC) and minimal bactericidal concentration (MBC) of HL and complex 1 (μg mL−1)
| Compounds |
Bacteria |
| Drug resistant and drug susceptible M. tuberculosis |
Clinical isolates |
| H37Rv |
H37Ra |
Strain-1 |
Strain-2 |
| MIC |
MBC |
MIC |
MBC |
MIC |
MBC |
MIC |
MBC |
| HL |
4 |
8 |
4 |
16 |
16 |
32 |
8 |
16 |
| Complex 1 |
8 |
8 |
8 |
16 |
16 |
32 |
32 |
64 |
| Concentrations of antimycobacterial drugs (μg mL−1) |
| Streptomycin |
0.65 |
0.65 |
0.65 |
1.29 |
2.59 |
5.18 |
0.65 |
— |
| Isoniazid |
0.13 |
1.03 |
0.51 |
1.03 |
0.51 |
1.03 |
0.51 |
0.51 |
| Rifampicin |
0.65 |
5.18 |
0.32 |
2.59 |
0.65 |
0.65 |
0.65 |
5.18 |
| Ethambutol |
3.744 |
7.48 |
1.87 |
1.87 |
3.74 |
3.74 |
1.87 |
— |
Cytotoxicity study
The ligand, HL, and complex 1 were investigated for cytotoxic effects on three cancer cell lines, namely A-549 (non-small cell lung cancer), MCF-7 (breast cancer), and CaCo-2 (colon cancer cell line), and on one healthy cell line, CRL-2522 (human normal fibroblast). Generally, cytotoxic effects of the substances increase in conjunction with an increase in concentration. While HL has 24.82 > 55.38 > 79.71 μg mL−1 downward IC50 values on CaCo-2 > A-549 > MCF-7 respectively, it has the highest IC50 value (306.75) on the healthy cell line CRL-2522 (see ESI, Table S2†). This result is desirable for drug development methods and for that reason, HL is a candidate molecule for target drugs. CRL-2522 (human normal fibroblast) shows an apoptotic effect under 1% at both IC50 and IC50/2 concentrations (Fig. 10).
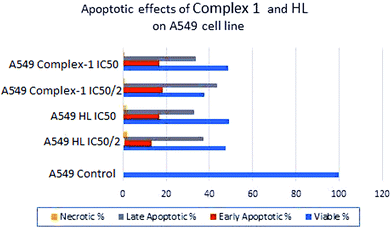 |
| | Fig. 10 The ligand HL and complex 1 induced apoptosis in A-549 cells in a concentration-dependent fashion. In the case of MCF-7, Caco-2 and CRL-2522 cell lines, minimum apoptotic effects are obtained (data not shown). | |
Apoptosis detection by staining with Annexin V-fluorescein isothiocyanate and propidium iodide (FACS)
To determine and measure apoptotic events, the expression of phosphatidylserine at the cell surface is effected by flow cytometry (FCM) with Annexin-V-fluorescein isothiocyanate (FITC) and propidium iodide (PI). To study late apoptotic events, DNA strand breaks are determined compared with the PI.50 The early apoptotic cells were Annexin V-positive and PI-negative, and the late apoptotic and dead cells were Annexin V-positive and PI-positive.51 In the IC50 and IC50/2 concentrations of complex 1, the total apoptosis rate exceeds 50% on the A-549 cell line. The MTT analysis indicates that complex 1 represses cell proliferation in a dose-subordinate procedure and this is confirmed by flow cytometric experiments using Annexin V–PI. The highest apoptotic rate is observed after treatment with complex 1 at IC50/2 (21.05 μg mL−1). Circumstantially, the higher dosages (IC50) of complex 1 (42.301 μg mL−1) result in relatively lower apoptotic rates (see ESI, Table S3†). CRL-2522 (human normal fibroblast) shows an apoptotic effect under 1% at both IC50 and IC50/2 concentrations. Complex 1 could be considered the best candidate for a drug active material since it needs a minimum concentration level to show cytotoxic activity on three cancer lines and is non-toxic even at high concentrations on the healthy cell line fibroblast.
Docking study with enoyl acyl carrier protein reductase of M. tuberculosis H37Rv
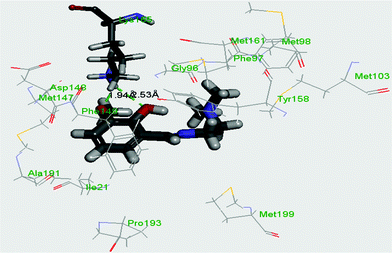
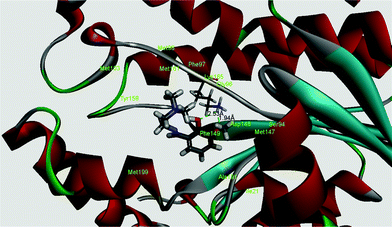
InhA, the enoyl acyl carrier protein reductase (ENR) from M. tuberculosis, is one of the key enzymes involved in the mycobacterial fatty acid elongation cycle and has been validated as an effective antimicrobial target. Isoniazid is a well-known tuberculosis drug that binds in the pocket of enoyl acyl carrier protein reductase and inhibits the action of fatty acid synthase. Pyrrolidine carboxamides52 are reported as a novel class of potent InhA inhibitors. By theoretical calculation we have tried to establish whether the ligand HL can act as a new InhA inhibitor. The crystallographic structures of the enoyl acyl carrier protein reductase of M. tuberculosis H37Rv and of the pyrollidium carboxamide complex were downloaded from the RCSB protein data bank (PDB ID: 4U0K); they were resolved at 1.09 Å using X-ray diffraction analysis. The energy-minimized structure of the ligand was used in situ for the protein–ligand docking studies in the cavity of the enzyme. To perform the docking study with HL and the enoyl acyl carrier protein reductase, we have selected the binding cavity of pyrollidium carboxamides. A total of fourteen amino acids (Ile21, Gly96, Phe97, Met98, Met103, Met147, Asp148, Phe149, Tyr158, Met161, Lys165, Ala193, Pro193, Met199) were present in the cavity sites. The ligand HL interacts with the protein forming two hydrogen bonds with Lys165 (1.94 and 2.53 Å, Fig. 11 and 12). The relevant data of the docking study are given in Tables 6 and 7. The surface area of the active site cavity (with respect to the H-bond donors/acceptors) is depicted in Fig. 13. We have removed the pyrollidium carboxamides from the binding cavity and docked inside the cavity. The best docked pose of the enoyl acyl carrier protein reductase and of pyrollidium carboxamides is comparable to the reported crystal data (4U0K) (see ESI, Fig. S4†). We have compared the Gibbs free energies of the protein–molecule complex for pyrollidium carboxamides and the ligand, HL. The protein–molecule complex for pyrollidium carboxamide is slightly more stable than the complex with the ligand (Table 6).
 |
| | Fig. 11 Best docked pose of the ligand (HL) inside the binding pocket of enoyl acyl carrier protein reductase (PDB id 4U0K) of M. tuberculosis H37Rv (2D view). | |
 |
| | Fig. 12 Best docked pose of the ligand (HL) (3D view) and the enoyl acyl carrier protein reductase (PDB id 4U0K) of M. tuberculosis H37Rv (3D view). | |
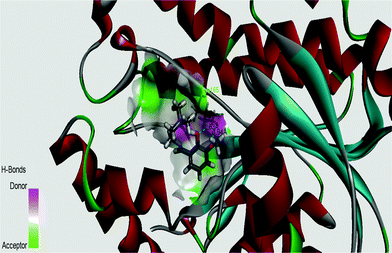 |
| | Fig. 13 Surface area (with respect to the H-bond donors & acceptors) of the binding pocket in the best docked pose of the ligand and protein. | |
Table 6 Details of the docking studiesa
| Compound |
CDOCKER interaction energy |
Energy of the protein–molecule complex (kcal mol−1) |
Ligand energy (kcal mol−1) |
Protein energy (kcal mol−1) |
Binding energy (kcal mol−1) |
|
EnergyBinding = EnergyComplex − EnergyLigand − EnergyReceptor.
|
|
4U0K@HL |
−17.46 |
−10![[thin space (1/6-em)]](https://www.rsc.org/images/entities/char_2009.gif) 299.00 299.00 |
23.86 |
−10![[thin space (1/6-em)]](https://www.rsc.org/images/entities/char_2009.gif) 272.18 272.18 |
−50.67 |
|
4U0K@pyrollidium carboxamides |
−22.76 |
−10![[thin space (1/6-em)]](https://www.rsc.org/images/entities/char_2009.gif) 324.26 324.26 |
−12.58 |
−10![[thin space (1/6-em)]](https://www.rsc.org/images/entities/char_2009.gif) 272.18 272.18 |
−39.50 |
Table 7 Details of the interactions present in the most stable protein–ligand complex
| Compounds |
Hydrogen bonds |
| No. of hydrogen bonds |
End 1 |
End 2 |
Bond distances (Å) |
Angle DHA |
| HL |
2 |
Lys165 |
O-Atom of the phenolic group |
2.63 |
132.19 |
| Lys165 |
O-Atom of the methoxy group |
1.94 |
126.43 |
| Pyrollidium carboxamides |
1 |
Tyr158 |
O-Atom of carbonyl carbon |
1.93 |
164.5 |
Druglikeness and ADMET prediction
Druglikeness and ADMET properties of HL have been checked following Lipinski's rule of five and the ADMET prediction module of Discovery Studio 4.0. The ligand has passed Lipinski's filter, and according to the ADMET (absorption, distribution, metabolism, excretion and toxicity) prediction it is non-mutagenic and shows optimal druglikeness. Predicted data are summarized in Table 8.
Table 8 ADMET prediction for HLa
| Compounds |
Molecular weight |
ADMET solubility (aqueous) |
ADMET solubility level |
ADMET absorption levela |
ADMET_A log![[thin space (1/6-em)]](https://www.rsc.org/images/entities/char_2009.gif) P98 P98 |
No of H-bond acceptors |
No. of H-bond donors |
Lipinski's filter |
Drug likeness inference |
Ames prediction |
|
ADMET absorption level: 0, good; 1, moderate; 2, low.
|
| HL |
222.84 |
−1.886 |
4 |
0 (good) |
1.73 |
4 |
1 |
Yes |
Yes, optimal |
Non-mutagen |
Conclusions
A potential tetradentate monoanionic N2O2 chelator, HL, is synthesized which affords the corresponding nickel derivative, [Ni(L)(μ1,1-N3)Ni(L)(OH2)2]·ClO4 (1) (HL, [2-[{[2-(dimethylamino)ethyl]imino}methyl]-6-methoxyphenol]) when reacting with nickel perchlorate and sodium azide. The solid state structure of 1 shows that both the Ni atoms possess an octahedral N3O3 environment. The complex has been thoroughly characterized by means of different spectral analyses. The temperature dependent magnetic moment shows the existence of ferromagnetic interactions between the bridging dinuclear Ni(II) ions. Both the ligand HL and complex 1 exhibit moderate anti-mycobacterial activity and considerable efficacy on the M. tuberculosis H37Rv ATCC 27294 and M. tuberculosis H37Ra ATCC 25177 strains. As regards the cytotoxicity study, it has been proven that both the ligand and the complex respond well on cancer cell lines (A-549, MCF-7 and Caco-2); however complex 1 shows low toxicity on healthy cell lines like CRL-2522. Further investigations in this area involving other metal ions integrated with new organic precursors and considering the chemo-sensor activities of the ligands for selective detection of metal ions are currently being carried out in our laboratories.
Acknowledgements
KD and CS would like to thank West Bengal DST, Kolkata, India for the grant (228/1(10)/(Sanc.)/ST/P/S&T/9G-16/2012). AD would like to thank The National Science Council, Taiwan for financial assistance. We also thank Mr Kana Kobayashi for his valuable suggestions regarding the magnetic studies.
References
-
(a) P. Zanello, S. Tamburini, P. A. Vigato and G. A. Mazzochim, Coord. Chem. Rev., 1987, 77, 165–273 CrossRef CAS;
(b) P. A. Vigato, S. Tamburini and D. E. Fenton, Coord. Chem. Rev., 1990, 106, 25–170 CrossRef CAS;
(c) G. A. Morris, H. Zhou, C. L. Stern and S. T. Nguyen, Inorg. Chem., 2001, 40, 3222–3227 CrossRef CAS PubMed;
(d) N. N. Murthy, M. M. Tahir and K. D. Karlin, J. Am. Chem. Soc., 1993, 115, 10404–10405 CrossRef CAS;
(e) K. Bertoncello, G. D. Fallon, J. H. Hodgkin and K. S. Murray, Inorg. Chem., 1988, 27, 4750–4758 CrossRef CAS;
(f) N. R. Sangeetha, C. K. Pal, P. Ghosh and S. Pal, J. Chem. Soc., Dalton Trans., 1996, 3293–3296 RSC;
(g) N. R. Sangeetha, K. Baradi, R. Gupta, C. K. Pal, V. Manivannan and S. Pal, Polyhedron, 1999, 18, 1425–1429 CrossRef CAS.
-
(a) S. H. Strauss, Chem. Rev., 1993, 93, 927–942 CrossRef CAS;
(b) S. O. Kang, R. A. Begum and K. Bowman-James, Angew. Chem., Int. Ed., 2006, 45, 7882–7884 CrossRef CAS PubMed;
(c) J. H. Han, J. W. Shin and K. S. Min, Bull. Korean Chem. Soc., 2009, 30, 1113–1117 CrossRef CAS.
-
(a) S. K. Dey, N. Mondal, M. S. El Fallah, R. Vicente, A. Escuer, X. Solans, M. F. Bardia, T. Matsushita, V. Gramlich and S. Mitra, Inorg. Chem., 2004, 43, 2427–2434 CrossRef CAS PubMed;
(b) P. Talukder, A. Datta, S. Mitra, G. Rosair, M. S. El Fallah and J. Ribas, Dalton Trans., 2004, 4161–4167 RSC;
(c) N. K. Karan, S. Mitra, T. Matsushita, V. Gramlich and G. Rosair, Inorg. Chim. Acta, 2002, 332, 87–91 CrossRef CAS.
-
(a) S. Naiya, C. Biswas, M. G. B. Drew, C. J. Gómez-Garcıa, J. M. Clemente-Juan and A. Ghosh, Inorg. Chem., 2010, 49, 6616–6627 CrossRef CAS PubMed;
(b) O. Sengupta and P. S. Mukherjee, Inorg. Chem., 2010, 49, 8583–8590 CrossRef CAS PubMed;
(c) O. Sengupta, G. Bappaditya, S. Mukherjee and P. S. Mukherjee, Dalton Trans., 2010, 39, 7451–7465 RSC;
(d) K. C. Mondal, M. G. B. Drew and P. S. Mukherjee, Inorg. Chem., 2007, 46, 5625–5629 CrossRef CAS PubMed.
- E. Ruiz, J. Cano, S. Alvarez and P. Alemany, J. Am. Chem. Soc., 1998, 120, 11122–11129 CrossRef CAS.
-
(a) C. P. Landee and R. D. Willett, Inorg. Chem., 1981, 20, 2521–2525 CrossRef CAS;
(b) J. C. Jansen, H. van Koningsveld, J. A. C. vah Ooijen and J. Reedijk, Inorg. Chem., 1980, 19, 170–174 CrossRef CAS;
(c) R. J. Butcher and E. Sinn, Inorg. Chem., 1977, 16, 2334–2343 CrossRef CAS;
(d) H. S. Preston and C. H. L. Kennard, J. Chem. Soc. A, 1969, 2682–2686 RSC.
-
(a) A. P. Ginsberg, R. L. Martin, R. W. Brookes and R. C. Sherwood, Inorg. Chem., 1972, 11, 2884–2889 CrossRef CAS;
(b) T. Rojo, L. Lezama, R. Cortes, J. L. Mesa, M. I. Arriortua and G. Villeneuve, J. Magn. Magn. Mater., 1990, 83, 519–521 CrossRef CAS.
- O. Kahn, Inorg. Chim. Acta, 1982, 62, 3–14 CrossRef CAS.
-
(a) N. Mondal, S. Mitra, V. Gramlich, S. O. Ghodsi and K. M. A. Malik, Polyhedron, 2001, 20, 135–141 CrossRef CAS;
(b) M. Amirnasr, K. J. Schenk, S. Meghdadi and M. Morshedi, Polyhedron, 2006, 25, 671–677 CrossRef CAS PubMed.
- A. L. Okunade and M. P. F. Elvin-Lewis, Phytochemistry, 2004, 65, 1017–1032 CrossRef CAS PubMed.
- N. Lall, M. D. Sarma, B. Hazra and J. J. Meyer, J. Antimicrob. Chemother., 2003, 51, 435–438 CrossRef CAS PubMed.
- E. Banfi, M. G. Mamolo, D. Zampieri, L. Vio and C. M. Bragadin, J. Antimicrob. Chemother., 2001, 48, 705–711 CrossRef CAS PubMed.
- E. Vattemi and P. P. Claudio, Drug News Perspect., 2007, 20, 511–520 CAS.
- K. C. Zimmermann, C. Bonzon and D. R. Green, Pharmacol. Ther., 2001, 92, 57–70 CrossRef CAS.
-
(a) N. A. Thornberry, T. A. Rano, E. P. Peterson, D. M. Rasper, T. Timkey, M. Garcia-Calvo, V. M. Houtzager, P. A. Nordstrom, S. Roy, J. P. Vaillancourt, K. T. Chapman and D. W. Nicholson, J. Biol. Chem., 1997, 272, 17907–17911 CrossRef CAS PubMed;
(b) A. Marin-Hernandez, I. Gracia-Mora, L. Ruiz-Ramirez and R. Moreno-Sanchez, Biochem. Pharmacol., 2003, 65, 1979–1989 CrossRef CAS.
- R. Koner, S. Hazra, M. Fleck, A. Jana, C. R. Lucas and S. Mohanta, Eur. J. Inorg. Chem., 2009, 4982–4988 CrossRef CAS PubMed.
-
(a) S. Sen, P. Talukder, S. K. Dey, S. Mitra, G. Rosair, D. L. Hughes, G. P. A. Yap, G. Pilet, V. Gramlich and T. Matsushita, Dalton Trans., 2006, 1758–1767 RSC;
(b) S. Basak, S. Sen, S. Banerjee, S. Mitra, G. Rosair and M. T. G. Rodriguez, Polyhedron, 2007, 26, 5104–5112 CrossRef CAS PubMed;
(c) C. R. Choudhury, S. K. Dey, R. Karmakar, C.-D. Wu, C.-Z. Lu, M. S. El Fallah and S. Mitra, New J. Chem., 2003, 27, 1360–1366 RSC;
(d) G. Das, R. Shukla, S. Mandal, R. Singh and P. K. Bharadwaz, Inorg. Chem., 1997, 36, 323–329 CrossRef CAS.
- D. F. Eaten, Pure Appl. Chem., 1988, 60, 1107–1114 Search PubMed.
- S. R. Stoyanov, J. M. Villegas and D. P. Rillema, Inorg. Chem., 2002, 41, 2941–2945 CrossRef CAS PubMed.
-
(a)
SADABS Bruker AXS, Madison, Wisconsin, USA, 2004 Search PubMed
SAINT, Software Users Guide, Version 6.0, Bruker Analytical X-ray Systems, Madison, WI, 1999 Search PubMed
(b)
G. M. Sheldrick, SADABS v2.03: Area-Detector Absorption Correction, University of Göttingen, Germany, 1999 Search PubMed.
- A. Altomare, M. C. Burla, M. Camalli, G. L. Cascarano, C. Giacovazzo, A. Guagliardi, A. G. G. Moliterni, G. Polidori and R. Spagna, J. Appl. Crystallogr., 1999, 32, 115–119 CrossRef CAS.
- G. M. Sheldrick, Acta Crystallogr., Sect. A: Fundam. Crystallogr., 2008, 64, 112–122 CrossRef CAS PubMed.
- L. J. Farrugia, J. Appl. Crystallogr., 1999, 32, 837–838 CrossRef CAS.
- C. Lee, W. Yang and R. G. Parr, Phys. Rev. B: Condens. Matter, 1988, 37, 785–789 CrossRef CAS.
-
M. J. Frisch, G. W. Trucks, H. B. Schlegel, G. E. Scuseria, M. A. Robb, J. R. Cheeseman, J. A. Montgomery Jr., T. Vreven, K. N. Kudin, J. C. Burant, J. M. Millam, S. S. Iyengar, J. Tomasi, V. Barone, B. Mennucci, M. Cossi, G. Scalmani, N. Rega, G. A. Petersson, H. Nakatsuji, M. Hada, M. Ehara, K. Toyota, R. Fukuda, J. Hasegawa, M. Ishida, T. Nakajima, Y. Honda, O. Kitao, H. Nakai, M. Klene, X. Li, J. E. Knox, H. P. Hratchian, J. B. Cross, V. Bakken, C. Adamo, J. Jaramillo, R. Gomperts, R. E. Stratmann, O. Yazyev, A. J. Austin, R. Cammi, C. Pomelli, J. W. Ochterski, P. Y. Ayala, K. Morokuma, G. A. Voth, P. Salvador, J. J. Dannenberg, V. G. Zakrzewski, S. Dapprich, A. D. Daniels, M. C. Strain, O. Farkas, D. K. Malick, A. D. Rabuck, K. Raghavachari, J. B. Foresman, J. V. Ortiz, Q. Cui, A. G. Baboul, S. Clifford, J. Cioslowski, B. B. Stefanov, G. Liu, A. Liashenko, P. Piskorz, I. Komaromi, R. L. Martin, D. J. Fox, T. Keith, M. A. Al-Laham, C. Y. Peng, A. Nanayakkara, M. Challacombe, P. M. W. Gill, B. Johnson, W. Chen, M. W. Wong, C. Gonzalez and J. A. Pople, GAUSSIAN 03 Revision D 01, Gaussian Inc., Wallingford, CT, 2004 Search PubMed.
-
GaussView3.0, Gaussian, Pittsburgh, PA Search PubMed.
- P. J. Hay and W. R. Wadt, J. Chem. Phys., 1985, 82, 270–283 CrossRef CAS PubMed.
- R. Bauernschmitt and R. Ahlrichs, Chem. Phys. Lett., 1996, 256, 454–464 CrossRef CAS.
- M. K. Casida, C. Jamorski, K. C. Casida and D. R. Salahub, J. Chem. Phys., 1998, 108, 4439–4449 CrossRef CAS PubMed.
- R. E. Stratmann, G. E. Scuseria and M. J. Frisch, J. Chem. Phys., 1998, 109, 8218–8224 CrossRef CAS PubMed.
- M. Cossi, N. Rega, G. Scalmani and V. Barone, Comput. Chem., 2003, 24, 669–681 CrossRef CAS PubMed.
- N. M. O'Boyle, A. L. Tenderholt and K. M. Langner, J. Comput. Chem., 2008, 29, 839–845 CrossRef PubMed.
-
B. D. Becton
, Dickinson and Company Newsletter BD Bactec MGIT 960 SIRE kit now FDA-cleared for susceptibility testing of Mycobacterium tuberculosis. Microbiology News & Ideas 13: 4-4, 2002.
- NCCLS (2003). National Committee for Clinical Laboratory Standards (NCCLS). Susceptibility Testing of Mycobacteria, Nocardiae, and Other Aerobic Actinomycetes; Approved Standard. NCCLS document M24-A [ISBN 1-56238-500-3]. NCCLS, 940 West Valley Road, Suite 1400, Wayne, Pennsylvania 19087-1898, USA, 2003.
- L. Collins and S. G. Franzblau, Antimicrob. Agents Chemother., 1997, 41, 1004–1009 CAS.
- A. Jimenez-Arellanes, M. Meckes, R. Ramirez, J. Torres and J. Luna-Herrera, Phytother. Res., 2003, 17, 903–908 CrossRef PubMed.
-
(a) G. R. Battu and B. M. Kumar, Willd. Pharmacogn. J., 2010, 2, 456–463 CrossRef;
(b) P. Bontempo, V. Carafa, R. Grassi, A. Basile, G. C. Tenore, C. Formisano, D. Rigano and L. Altucci, Food Chem. Toxicol., 2013, 304–312 CrossRef CAS PubMed.
- T. Mosman, J. Immunol. Methods, 1983, 65, 55–63 CrossRef.
- C. A. Lipinski, F. Lombardo, B. W. Dominy and P. J. Feeney, Adv. Drug Delivery Rev., 2001, 46, 3–26 CrossRef CAS.
- C. A. Lipinski, Drug Discovery Today: Technol., 2004, 1, 337–341 CrossRef CAS PubMed.
- Discovery Studio 4.0 is a product of Accelrys Inc., San Diego, CA, USA.
-
K. Nakamoto, Infrared and Raman Spectra of Inorganic and Coordination Compounds, Parts A and B, John Wiley, New York, 5th edn, 1997 Search PubMed.
- S. Ferrer, J. G. Haasnoot, J. Reedijk, E. Muller, M. B. Cingi, M. Lanfranchi, A. M. M. Lanfredi and J. Ribas, Inorg. Chem., 2000, 39, 1859–1867 CrossRef CAS.
-
A. B. P. Lever, Inorganic Electronic Spectroscopy, Elsevier, New York, 2nd edn, 1984 Search PubMed.
-
(a) J. L. Kropp and M. W. Windsor, J. Chem. Phys., 1963, 39, 2769–2770 CrossRef CAS PubMed;
(b) J. L. Kropp and M. W. Windsor, J. Chem. Phys., 1965, 42, 1599–1608 CrossRef CAS PubMed.
-
A. Bencini and D. Gatteschi, in Transition Metal Chemistry, ed. G. A. Melson and B. N. Figgis, Marcel Dekker, New York, 1982, vol. 8, pp. 1–178 Search PubMed.
-
F. A. Cotton, G. Wilkinson, C. A. Murillo and M. Bochmann, Advanced Inorganic Chemistry, John Wiley & Sons, Inc., New York, 6th edn, 1999 Search PubMed.
-
(a) J. C. Jeffery, J. P. Maher, C. A. Otter, P. Thornton and M. D. Ward, J. Chem. Soc., Dalton Trans., 1995, 819–824 RSC;
(b) W. A. Alves, R. H. A. Santos, A. Paduan-Filho, C. C. Becerra, A. C. Borin and A. M. D. C. Ferreira, Inorg. Chim. Acta, 2004, 357, 2269–2278 CrossRef CAS PubMed;
(c) M. A. Ali, A. H. Mirza, R. J. Fereday, R. J. Butcher, J. M. Fuller, S. C. Drew, L. R. Gahan, G. R. Hanson, B. Moubaraki and K. S. Murray, Inorg. Chim. Acta, 2005, 358, 3937–3948 CrossRef CAS PubMed;
(d) I. A. Koval, M. Sgobba, M. Huisman, M. Lüken, E. Saint-Aman, P. Gamez, B. Krebs and J. Reedijk, Inorg. Chim. Acta, 2006, 359, 4071–4078 CrossRef CAS PubMed;
(e) S. Thakurta, J. Chakraborty, G. Rosair, J. Tercero, M. S. El Fallah, E. Garribba and S. Mitra, Inorg. Chem., 2008, 47, 6227–6235 CrossRef CAS PubMed;
(f) S. Thakurta, P. Roy, G. Rosair, C. J. Gomez-Garcia, E. Garribba and S. Mitra, Polyhedron, 2009, 28, 695–702 CrossRef CAS PubMed;
(g) S. Saha, A. Sasmal, C. R. Choudhury, C. J. Gomez-Garcia, E. Garribba and S. Mitra, Polyhedron, 2014, 69, 262–269 CrossRef CAS PubMed.
-
(a)
D. E. Minnikin and M. Goodfellow, in Microbiological classification and identification, ed. R. G. Board, Academic, London, 1980, p. 189 Search PubMed;
(b)
D. E. Minnikin, Lipids; complex lipids, their chemistry, biosynthesis and roles, in The biology of mycobacteria, ed. C. Ratledge and J. Stanford, Academic Press, Inc., London, 1982, p. 95 Search PubMed.
- M. Martinez-Losa, J. Cortijo, G. Juan, M. Ramón, M. J. Sanz and E. J. Morcillo, Modulatory effects of N-acetyl-L-cysteine on human eosinophil apoptosis, ERJ, 2007, 30, 436 CrossRef CAS PubMed.
- T. Nakanoma, M. Ueno, M. Iida, R. Hirata and N. Deguchi, Int. J. Urol., 2001, 8, 623–630 CrossRef CAS.
- X. He, A. Alian, R. Stroud and P. R. Ortiz de Montellano, J. Med. Chem., 2006, 49, 6308–6323 CrossRef CAS PubMed.
Footnote |
| † Electronic supplementary information (ESI) available. CCDC 894363. For ESI and crystallographic data in CIF or other electronic format see DOI: 10.1039/c5qi00060b |
|
| This journal is © the Partner Organisations 2015 |
Click here to see how this site uses Cookies. View our privacy policy here.  Open Access Article
![[double bond, length as m-dash]](https://www.rsc.org/images/entities/char_e001.gif) CH–C6H3(O−)(OCH3). The complex has been characterized by X-ray diffraction analysis and different spectroscopic techniques. The coordination geometry around the Ni(II) centres is a distorted octahedron, with the azide ligand and the phenolato oxygen atom bridging in μ1,1 and μ2 mode, respectively. The EPR spectra, recorded at liquid nitrogen temperature (77 K) and room temperature (298 K), show g factors of 2.080 and 2.085, in agreement with the structure determined by X-ray diffraction analysis. The VTM study confirms that there are ferromagnetic interactions between the bridging binuclear Ni(II) ions (S = 1). The evaluation of cytotoxic effects on different human cancer cell lines (A-549, MCF-7 and CaCo-2) suggests that both the ligand and complex 1 have potential anticancer properties. Furthermore, they also exhibit anti-mycobacterial activity against M. tuberculosis H37Rv (ATCC 27294) and M. tuberculosis H37Ra (ATCC 25177) strains. Molecular docking of HL with the enoyl acyl carrier protein reductase of M. tuberculosis H37Rv (PDB ID: 4U0K) has been examined, showing that HL forms two hydrogen bonds with Lys165 (1.94 and 2.53 Å) in its best docked pose.
CH–C6H3(O−)(OCH3). The complex has been characterized by X-ray diffraction analysis and different spectroscopic techniques. The coordination geometry around the Ni(II) centres is a distorted octahedron, with the azide ligand and the phenolato oxygen atom bridging in μ1,1 and μ2 mode, respectively. The EPR spectra, recorded at liquid nitrogen temperature (77 K) and room temperature (298 K), show g factors of 2.080 and 2.085, in agreement with the structure determined by X-ray diffraction analysis. The VTM study confirms that there are ferromagnetic interactions between the bridging binuclear Ni(II) ions (S = 1). The evaluation of cytotoxic effects on different human cancer cell lines (A-549, MCF-7 and CaCo-2) suggests that both the ligand and complex 1 have potential anticancer properties. Furthermore, they also exhibit anti-mycobacterial activity against M. tuberculosis H37Rv (ATCC 27294) and M. tuberculosis H37Ra (ATCC 25177) strains. Molecular docking of HL with the enoyl acyl carrier protein reductase of M. tuberculosis H37Rv (PDB ID: 4U0K) has been examined, showing that HL forms two hydrogen bonds with Lys165 (1.94 and 2.53 Å) in its best docked pose.![[double bond, length as m-dash]](https://www.rsc.org/images/entities/char_e001.gif) CH–C6H3(O−)(OCH3);17 additionally, the spectral properties and temperature-dependent magnetic behaviour of the complex are elucidated. Both the ligand HL and complex 1 exhibit anti-mycobacterial activity on M. tuberculosis H37Rv (ATCC 27294) and M. tuberculosis H37Ra (ATCC 25177) strains. The anti-mycobacterial efficiency of HL has been examined by molecular docking with the enoyl acyl carrier protein reductase of M. tuberculosis H37Rv (PDB ID: 4U0K) and has been compared with the first line drug isoniazide.
CH–C6H3(O−)(OCH3);17 additionally, the spectral properties and temperature-dependent magnetic behaviour of the complex are elucidated. Both the ligand HL and complex 1 exhibit anti-mycobacterial activity on M. tuberculosis H37Rv (ATCC 27294) and M. tuberculosis H37Ra (ATCC 25177) strains. The anti-mycobacterial efficiency of HL has been examined by molecular docking with the enoyl acyl carrier protein reductase of M. tuberculosis H37Rv (PDB ID: 4U0K) and has been compared with the first line drug isoniazide.![[thin space (1/6-em)]](https://www.rsc.org/images/entities/char_2009.gif) 000 Gauss in the temperature range 77–298 K with an X-band (9.4 GHz) Bruker EMX spectrometer equipped with an HP 53150A microwave frequency counter. Magnetic properties were investigated with a Quantum Design MPMS-XL superconducting quantum interference device magnetometer (SQUID) at an applied field of 10
000 Gauss in the temperature range 77–298 K with an X-band (9.4 GHz) Bruker EMX spectrometer equipped with an HP 53150A microwave frequency counter. Magnetic properties were investigated with a Quantum Design MPMS-XL superconducting quantum interference device magnetometer (SQUID) at an applied field of 10![[thin space (1/6-em)]](https://www.rsc.org/images/entities/char_2009.gif) 000 Oe in the temperature range 5–300 K. Diamagnetic correction was carried out by using Pascal constants.
000 Oe in the temperature range 5–300 K. Diamagnetic correction was carried out by using Pascal constants.![[thin space (1/6-em)]](https://www.rsc.org/images/entities/char_2009.gif) 015/8462 [R(int) = 0.0416
015/8462 [R(int) = 0.0416![[thin space (1/6-em)]](https://www.rsc.org/images/entities/char_2009.gif) a
a![[thin space (1/6-em)]](https://www.rsc.org/images/entities/char_2009.gif) :
:![[thin space (1/6-em)]](https://www.rsc.org/images/entities/char_2009.gif) 4 ratio using sterile saline. Inoculums, prepared from a day 1 to day 5 MGIT 7 mL positive tube, range between 0.8 × 10⁵ and 3.2 × 10⁵ CFU per mL. Each assay is performed according to the MGIT manual fluorometric susceptibility test procedure recommended by the manufacturer.33,34
4 ratio using sterile saline. Inoculums, prepared from a day 1 to day 5 MGIT 7 mL positive tube, range between 0.8 × 10⁵ and 3.2 × 10⁵ CFU per mL. Each assay is performed according to the MGIT manual fluorometric susceptibility test procedure recommended by the manufacturer.33,34
![[thin space (1/6-em)]](https://www.rsc.org/images/entities/char_2009.gif) :
:![[thin space (1/6-em)]](https://www.rsc.org/images/entities/char_2009.gif) 2 dilutions. 100 μl of excess medium was discarded from the wells in column 10. Final test concentration ranges were 512–1 μg ml−1 in the mixture. Microplates were inoculated with the bacterial suspension (20 μL per well) except for the negative control and incubated at 37 °C for 6 days. Presto blue (15 μL, Life Technologies) was then added to the bacterial growth control wells (without compound) and the microplates were incubated at 37 °C for an additional 24 h. If the dye turned from blue to pink/red (indicating positive bacterial growth), the Presto blue solution was added to the other wells to determine the MIC values. All tests were performed in triplicate. The minimal inhibitory concentration (MIC) was defined as the lowest concentration of the sample that prevents a colour change to pink/red. To determine the minimal bactericidal concentration (MBC) values, MIC concentration-wells and higher concentration wells were used. To each well it was transferred fresh 7H9 broth (185 μL) and added a mycobacterial suspension (15 μL). Plates were incubated at 37 °C for 6 days. The MBC corresponded to the minimum compound concentration which does not cause a colour change in the cultures when re-incubated in fresh medium.37 Streptomycin (STR), ethambutol (EMB), rifampicin (RFP) and isoniazid (INH) were used as standard drugs.
2 dilutions. 100 μl of excess medium was discarded from the wells in column 10. Final test concentration ranges were 512–1 μg ml−1 in the mixture. Microplates were inoculated with the bacterial suspension (20 μL per well) except for the negative control and incubated at 37 °C for 6 days. Presto blue (15 μL, Life Technologies) was then added to the bacterial growth control wells (without compound) and the microplates were incubated at 37 °C for an additional 24 h. If the dye turned from blue to pink/red (indicating positive bacterial growth), the Presto blue solution was added to the other wells to determine the MIC values. All tests were performed in triplicate. The minimal inhibitory concentration (MIC) was defined as the lowest concentration of the sample that prevents a colour change to pink/red. To determine the minimal bactericidal concentration (MBC) values, MIC concentration-wells and higher concentration wells were used. To each well it was transferred fresh 7H9 broth (185 μL) and added a mycobacterial suspension (15 μL). Plates were incubated at 37 °C for 6 days. The MBC corresponded to the minimum compound concentration which does not cause a colour change in the cultures when re-incubated in fresh medium.37 Streptomycin (STR), ethambutol (EMB), rifampicin (RFP) and isoniazid (INH) were used as standard drugs.
![[thin space (1/6-em)]](https://www.rsc.org/images/entities/char_2009.gif) :
:![[thin space (1/6-em)]](https://www.rsc.org/images/entities/char_2009.gif) 1 mole proportion) in methanol. HL was then reacted with Ni(ClO4)2·6H2O and NaN3 in a methanol/water mixture to yield [Ni(L)(μ1,1-N3)Ni(L)(OH2)2]·ClO4 (1), where L = Me2N(CH2)2N
1 mole proportion) in methanol. HL was then reacted with Ni(ClO4)2·6H2O and NaN3 in a methanol/water mixture to yield [Ni(L)(μ1,1-N3)Ni(L)(OH2)2]·ClO4 (1), where L = Me2N(CH2)2N![[double bond, length as m-dash]](https://www.rsc.org/images/entities/char_e001.gif) CH–C6H3(O−)(OCH3), by slow evaporation of the solvent. The 1H NMR spectrum of HL shows singlet signals at δ 12.80 and 9.90 ppm for –OH and –CH
CH–C6H3(O−)(OCH3), by slow evaporation of the solvent. The 1H NMR spectrum of HL shows singlet signals at δ 12.80 and 9.90 ppm for –OH and –CH![[double bond, length as m-dash]](https://www.rsc.org/images/entities/char_e001.gif) N protons, respectively. Furthermore, the singlet signals at δ 3.86 ppm and 2.29 ppm refer to –OCH3 and –N(CH3)2 protons, respectively. In addition, two triplet signals at δ 3.45 and 3.07 ppm are assigned to 7-H and 8-H protons with J values of 4.5 and 3.4 Hz respectively. The corresponding aromatic protons appear as doublet and triplet signals in the region 6.46–6.86 ppm. The FTIR spectrum of the free ligand shows bands at 3436 cm−1 and 1660 cm−1 which are due to the stretching frequencies of ν(O–H) and ν(C
N protons, respectively. Furthermore, the singlet signals at δ 3.86 ppm and 2.29 ppm refer to –OCH3 and –N(CH3)2 protons, respectively. In addition, two triplet signals at δ 3.45 and 3.07 ppm are assigned to 7-H and 8-H protons with J values of 4.5 and 3.4 Hz respectively. The corresponding aromatic protons appear as doublet and triplet signals in the region 6.46–6.86 ppm. The FTIR spectrum of the free ligand shows bands at 3436 cm−1 and 1660 cm−1 which are due to the stretching frequencies of ν(O–H) and ν(C![[double bond, length as m-dash]](https://www.rsc.org/images/entities/char_e001.gif) N) respectively. The two ν(C–O) bands for C–OH and C–OMe are observed at 1260 and 1086 cm−1 respectively.42 In the complex, a distinct band appears at 1634 cm−1 corresponding to the azomethine (C
N) respectively. The two ν(C–O) bands for C–OH and C–OMe are observed at 1260 and 1086 cm−1 respectively.42 In the complex, a distinct band appears at 1634 cm−1 corresponding to the azomethine (C![[double bond, length as m-dash]](https://www.rsc.org/images/entities/char_e001.gif) N) functional group.43 The lowering of the stretching frequency from 1660 to 1634 cm−1 indicates the coordination to the metal center. The ν(C–O) band is shifted to 1217 cm−1 on complexation. Furthermore, the complex shows one sharp band at 2072 cm−1, which indicates the presence of N3 as a bridging ligand. Bands in agreement with the non-coordinated perchlorate anion could also be observed at 1110 cm−1 along with a weak shoulder at 629 cm−1. The ν(M–N) and ν(M–O) stretching frequencies are observed at 462, 339 and 278 cm−1.
N) functional group.43 The lowering of the stretching frequency from 1660 to 1634 cm−1 indicates the coordination to the metal center. The ν(C–O) band is shifted to 1217 cm−1 on complexation. Furthermore, the complex shows one sharp band at 2072 cm−1, which indicates the presence of N3 as a bridging ligand. Bands in agreement with the non-coordinated perchlorate anion could also be observed at 1110 cm−1 along with a weak shoulder at 629 cm−1. The ν(M–N) and ν(M–O) stretching frequencies are observed at 462, 339 and 278 cm−1.

![[thin space (1/6-em)]](https://www.rsc.org/images/entities/char_2009.gif) a
a


![[thin space (1/6-em)]](https://www.rsc.org/images/entities/char_2009.gif) 000 Oe) of complex 1 in the form of a χmT vs. T (χmvs. T inset) plot is shown in Fig. 8 (χm is the molar susceptibility for two Ni(II) ions). At room temperature, the χmT value is 4.33 emu K G−1 mol−1. When lowering the temperature, the χmT value increases gradually to a maximum value of 5.82 emu K G−1 mol−1 at 18 K. It then decreases sharply with decreasing temperature and reaches a minimum of 4.81 emu K G−1 mol−1 at 5 K. This behaviour suggests that there are ferromagnetic interactions between the bridging binuclear Ni(II) ions (S = 1), because of the super-exchange interaction.
000 Oe) of complex 1 in the form of a χmT vs. T (χmvs. T inset) plot is shown in Fig. 8 (χm is the molar susceptibility for two Ni(II) ions). At room temperature, the χmT value is 4.33 emu K G−1 mol−1. When lowering the temperature, the χmT value increases gradually to a maximum value of 5.82 emu K G−1 mol−1 at 18 K. It then decreases sharply with decreasing temperature and reaches a minimum of 4.81 emu K G−1 mol−1 at 5 K. This behaviour suggests that there are ferromagnetic interactions between the bridging binuclear Ni(II) ions (S = 1), because of the super-exchange interaction.

![[thin space (1/6-em)]](https://www.rsc.org/images/entities/char_2009.gif) 000 Oe.
000 Oe.


![[thin space (1/6-em)]](https://www.rsc.org/images/entities/char_2009.gif) 299.00
299.00![[thin space (1/6-em)]](https://www.rsc.org/images/entities/char_2009.gif) 272.18
272.18![[thin space (1/6-em)]](https://www.rsc.org/images/entities/char_2009.gif) 324.26
324.26![[thin space (1/6-em)]](https://www.rsc.org/images/entities/char_2009.gif) 272.18
272.18![[thin space (1/6-em)]](https://www.rsc.org/images/entities/char_2009.gif) P98
P98


