Cation deficiency effect on negative thermal expansion of ferroelectric PbTiO3†
Xin
Peng
a,
Yangchun
Rong
a,
Longlong
Fan
a,
Kun
Lin
a,
He
Zhu
a,
Jinxia
Deng
b,
Jun
Chen
a and
Xianran
Xing
*a
aDepartment of Physical Chemistry, University of Science and Technology Beijing, Beijing, 100083, P. R. China
bDepartment of Chemistry, University of Science and Technology Beijing, Beijing, 100083, P. R. China. E-mail: xing@ustb.edu.cn; Fax: +86 10 6233 2525; Tel: +86 10 62334200
First published on 6th October 2015
Abstract
It is known that negative thermal expansion (NTE) in PbTiO3 (PT) ferroelectrics can be controlled by chemical substitutions. In the present work, however, we report a method to change the NTE of PT by introducing cation deficiency at both the A (Pb2+) and B sites (Ti4+). We investigated the spontaneous polarization, tetragonality c/a, coefficient of thermal expansion, and Curie temperature TC with 8% Pb2+ deficient PT (P92T), 2% Ti4+ deficient PT (PT98), and pure PT. We found that while Pb2+ deficiency distinctively weakens the NTE, the effect of B-site deficiency could be ignored. These phenomena are ascribed to the NTE mechanism of spontaneous volume ferroelectrostriction. The present study provides a possible way to control the NTE of PT-based materials.
Introduction
It is well known that most materials expand upon heating due to the inherent anharmonicity of bond vibrations. Over the past decades, however, negative thermal expansion (NTE) has been reported in some materials,1–15 and its discovery has made it possible to reduce thermal shock in various applications. PbTiO3 (PT) is a very popular NTE material featuring spontaneous polarization (Ps) parallel to the polar direction of the c axis.16,17 In our group, the NTE of PT was found in the temperature range of 25–490 °C.15 Afterward, systematic investigations have been carried out to adjust the NTE in PT-based compounds.18–22 Chemical substitutions of Pb and Ti cations are used to achieve wide control of the coefficient of thermal expansion (CTE). For example, in the systems of (1 − x)PbTiO3–xBiFeO3![[thin space (1/6-em)]](https://www.rsc.org/images/entities/char_2009.gif) 18 and (Pb1−xCdx)TiO3,19 chemical substitutions enhanced NTEs, resulting in a CTE of −3.92 × 10⁻⁵ °C−1 for x = 0.6 and −2.40 × 10⁻⁵ °C−1 for x = 0.06 in the corresponding compound. Furthermore, in (1 − x)PbTiO3–xBi(Zn1/2Ti1/2)O3
18 and (Pb1−xCdx)TiO3,19 chemical substitutions enhanced NTEs, resulting in a CTE of −3.92 × 10⁻⁵ °C−1 for x = 0.6 and −2.40 × 10⁻⁵ °C−1 for x = 0.06 in the corresponding compound. Furthermore, in (1 − x)PbTiO3–xBi(Zn1/2Ti1/2)O3![[thin space (1/6-em)]](https://www.rsc.org/images/entities/char_2009.gif) 20 and (1 − x)PbTiO3–xBi(Ni1/2Ti1/2)O3,21 near zero thermal expansions were achieved. Cation doping cripples NTE of PT in most cases. For example, the NTEs of PbTi1−xFexO3 are reduced to −1.49 × 10⁻⁵ °C−1 and −1.13 × 10⁻⁵ °C−1 when x = 0.05 and 0.10,22 respectively. All this evidence16 shows a strong correlation between the spontaneous polarization and NTE for PT-based ferroelectrics, known as spontaneous volume ferroelectrostriction (SVFS), which is a newly identified mechanism in ferroelectric NTE compounds.23
20 and (1 − x)PbTiO3–xBi(Ni1/2Ti1/2)O3,21 near zero thermal expansions were achieved. Cation doping cripples NTE of PT in most cases. For example, the NTEs of PbTi1−xFexO3 are reduced to −1.49 × 10⁻⁵ °C−1 and −1.13 × 10⁻⁵ °C−1 when x = 0.05 and 0.10,22 respectively. All this evidence16 shows a strong correlation between the spontaneous polarization and NTE for PT-based ferroelectrics, known as spontaneous volume ferroelectrostriction (SVFS), which is a newly identified mechanism in ferroelectric NTE compounds.23
To date, the influence of A/B-site deficiency on NTE in PbTiO3 has not been reported. In the present work, we prepared nonstoichiometric PT samples to introduce Pb2+/Ti4+ deficiencies. The Pb2+/Ti4+ deficiencies can cause a spontaneous polarization displacement change, which in turn causes a distortion of the primitive cell, and thus controls its CTE. The experimental results show that the CTE of PT with 2% Ti4+ deficiency (PT98) is nearly equal to that of pure PT, while the NTE of an 8% Pb2+ deficient compound (P92T) is significantly weakened.
Experimental
Solid solution samples with Pb2+/Ti4+ deficiencies were prepared using a conventional solid state reaction route. Analytical reagent grade raw materials of PbO and TiO2 were weighed in stoichiometric proportions and pestled for an hour in an ethanol medium. The mixed powders were calcined at 850 °C for 5 hours for perovskite phase formation. Then, the solid solution samples were sintered at 900 °C for two hours. In the A-site deficiency experiment, we set TiO2![[thin space (1/6-em)]](https://www.rsc.org/images/entities/char_2009.gif) :
:![[thin space (1/6-em)]](https://www.rsc.org/images/entities/char_2009.gif) PbO = 1
PbO = 1![[thin space (1/6-em)]](https://www.rsc.org/images/entities/char_2009.gif) :
:![[thin space (1/6-em)]](https://www.rsc.org/images/entities/char_2009.gif) x, x < 1; and in the B-site deficiency testing, we set PbO
x, x < 1; and in the B-site deficiency testing, we set PbO![[thin space (1/6-em)]](https://www.rsc.org/images/entities/char_2009.gif) :
:![[thin space (1/6-em)]](https://www.rsc.org/images/entities/char_2009.gif) TiO2 = 1
TiO2 = 1![[thin space (1/6-em)]](https://www.rsc.org/images/entities/char_2009.gif) :
:![[thin space (1/6-em)]](https://www.rsc.org/images/entities/char_2009.gif) x, x < 1. The X-ray diffraction (XRD) patterns of the sintered samples were taken using a laboratory diffractometer (PANalytical X’ PertIII, Holland) (Cu Kα radiation). The high-temperature powder X-ray diffraction patterns were collected using the same diffractometer and an Anton Paar HTK 1200 high-temperature attachment was used. Data were collected from 25–700 °C over a 2θ range from 20 to 80°. The heating rate was 10 °C min−1 and the sample was held for 5 min at a specified temperature to reach heating equilibrium. The structure was refined using the Rietveld method using FULLPROF software. The TC (the temperature where the ferroelectric transforms into a paraelectric one in lead titanate) of these samples was defined using DSC (Labsys Evo, Setaram, France). The heating rate was 10 °C min−1 in air conditions and the rate of the airflow was 25 mL min−1. Raman measurements were performed using a LabRAM HR Evolution Raman spectrometer (Jobin Yvon, France). The 532 nm line of an argon ion laser was used as the excitation light. The output power of the laser was kept within 0.4 mW. The compositions of the samples were identified using energy-dispersive spectroscopy (SEM-EDS) (FE-SEM, SUPRA-40, Carl Zeiss) and inductively coupled plasma optical emission spectroscopy (ICPOES; Thermo IRIS Intrepid II). Ion oxidation states in the samples were analyzed using X-ray photoelectron spectroscopy (ESCALAB 250Xi, Thermo Fisher). Experimental details are included in the ESI.†
x, x < 1. The X-ray diffraction (XRD) patterns of the sintered samples were taken using a laboratory diffractometer (PANalytical X’ PertIII, Holland) (Cu Kα radiation). The high-temperature powder X-ray diffraction patterns were collected using the same diffractometer and an Anton Paar HTK 1200 high-temperature attachment was used. Data were collected from 25–700 °C over a 2θ range from 20 to 80°. The heating rate was 10 °C min−1 and the sample was held for 5 min at a specified temperature to reach heating equilibrium. The structure was refined using the Rietveld method using FULLPROF software. The TC (the temperature where the ferroelectric transforms into a paraelectric one in lead titanate) of these samples was defined using DSC (Labsys Evo, Setaram, France). The heating rate was 10 °C min−1 in air conditions and the rate of the airflow was 25 mL min−1. Raman measurements were performed using a LabRAM HR Evolution Raman spectrometer (Jobin Yvon, France). The 532 nm line of an argon ion laser was used as the excitation light. The output power of the laser was kept within 0.4 mW. The compositions of the samples were identified using energy-dispersive spectroscopy (SEM-EDS) (FE-SEM, SUPRA-40, Carl Zeiss) and inductively coupled plasma optical emission spectroscopy (ICPOES; Thermo IRIS Intrepid II). Ion oxidation states in the samples were analyzed using X-ray photoelectron spectroscopy (ESCALAB 250Xi, Thermo Fisher). Experimental details are included in the ESI.†
Results and discussion
PT has a perovskite structure (ABO3) where large Pb atoms occupy the A-site and small Ti atoms occupy the B-site. It is known that a perovskite structure has a flexible crystal structure that allows cation deficiency at the A/B site. A single perovskite phase can be achieved with various concentrations of A/B site deficiency, and while a larger amount of deficiency can be stabilized at the A site, an impure phase appears when more deficiency is introduced. To study the B-site deficiency of PT, we set Pb2+![[thin space (1/6-em)]](https://www.rsc.org/images/entities/char_2009.gif) :
:![[thin space (1/6-em)]](https://www.rsc.org/images/entities/char_2009.gif) Ti4+ = 1
Ti4+ = 1![[thin space (1/6-em)]](https://www.rsc.org/images/entities/char_2009.gif) :
:![[thin space (1/6-em)]](https://www.rsc.org/images/entities/char_2009.gif) x. The prepared sample is not in a single phase when x < 0.98. Similarly, in the A-site Pb2+ deficiency situation with the chemical ratio of Ti4+
x. The prepared sample is not in a single phase when x < 0.98. Similarly, in the A-site Pb2+ deficiency situation with the chemical ratio of Ti4+![[thin space (1/6-em)]](https://www.rsc.org/images/entities/char_2009.gif) :
:![[thin space (1/6-em)]](https://www.rsc.org/images/entities/char_2009.gif) Pb2+ = 1
Pb2+ = 1![[thin space (1/6-em)]](https://www.rsc.org/images/entities/char_2009.gif) :
:![[thin space (1/6-em)]](https://www.rsc.org/images/entities/char_2009.gif) x, the impurity is detected in the sample with x < 0.92. For example, the PbO and PbTi3O7 impurity phases are detected in the nominal PT97 and P91T samples. To study the actual compositions of the prepared samples, SEM-EDS measurements were carried out. The averaged measured results (Table 1) agree well with the nominal compositions (error <5%, the individual ones can be seen in Tables S2–S4 in ESI†). The EDS results of the different areas are close to each other, indicating the compositional homogeneity. Also ICP tests were adopted to confirm the results. The Pb2+/Ti4+ ratios from the ICP tests are 1/1.00, 0.94/1 and 1/0.97 for PT, P92T and PT98, respectively, confirming the EDS measurements. In addition, the XPS results reveal that the valence states of the Ti4+ and Pb2+ ions exist only, while oxygen vacancies increase with more introduced cations (Fig. S4 and S5 in ESI†). These results show that a large amount of deficiencies can be stabilized at the A-site but not in the B-site. We know that the TiO6 octahedron is the framework of the perovskite structure of PbTiO3 and the Pb atom is in the cave of the framework, surrounded by twelve oxygen atoms to form a PbO12 polyhedron. We can thus reasonably speculate that this is why the amount of Pb2+ deficiency could be much bigger than the Ti4+ deficiency in single phase PT.
x, the impurity is detected in the sample with x < 0.92. For example, the PbO and PbTi3O7 impurity phases are detected in the nominal PT97 and P91T samples. To study the actual compositions of the prepared samples, SEM-EDS measurements were carried out. The averaged measured results (Table 1) agree well with the nominal compositions (error <5%, the individual ones can be seen in Tables S2–S4 in ESI†). The EDS results of the different areas are close to each other, indicating the compositional homogeneity. Also ICP tests were adopted to confirm the results. The Pb2+/Ti4+ ratios from the ICP tests are 1/1.00, 0.94/1 and 1/0.97 for PT, P92T and PT98, respectively, confirming the EDS measurements. In addition, the XPS results reveal that the valence states of the Ti4+ and Pb2+ ions exist only, while oxygen vacancies increase with more introduced cations (Fig. S4 and S5 in ESI†). These results show that a large amount of deficiencies can be stabilized at the A-site but not in the B-site. We know that the TiO6 octahedron is the framework of the perovskite structure of PbTiO3 and the Pb atom is in the cave of the framework, surrounded by twelve oxygen atoms to form a PbO12 polyhedron. We can thus reasonably speculate that this is why the amount of Pb2+ deficiency could be much bigger than the Ti4+ deficiency in single phase PT.
| PT | P92T | PT98 | |
|---|---|---|---|
Composition (Pb![[thin space (1/6-em)]](https://www.rsc.org/images/entities/char_2009.gif) : :![[thin space (1/6-em)]](https://www.rsc.org/images/entities/char_2009.gif) Ti) Ti) |
0.9979![[thin space (1/6-em)]](https://www.rsc.org/images/entities/char_2009.gif) : :![[thin space (1/6-em)]](https://www.rsc.org/images/entities/char_2009.gif) 1 1 |
0.9395![[thin space (1/6-em)]](https://www.rsc.org/images/entities/char_2009.gif) : :![[thin space (1/6-em)]](https://www.rsc.org/images/entities/char_2009.gif) 1 1 |
1![[thin space (1/6-em)]](https://www.rsc.org/images/entities/char_2009.gif) : :![[thin space (1/6-em)]](https://www.rsc.org/images/entities/char_2009.gif) 0.9843 0.9843 |
| a/Å | 3.8990(1) | 3.9019(2) | 3.8994(1) |
| c/Å | 4.1542(1) | 4.1384(3) | 4.1540(1) |
| c/a | 1.065 | 1.060 | 1.065 |
| V/Å3 | 63.153(2) | 63.006(7) | 63.163(2) |
| δz Ti/Å | 0.395(7) | 0.368(8) | 0.400(9) |
| δz Pb/Å | 0.523(4) | 0.497(4) | 0.524(4) |
| P s/μC cm−2 | 66.6(9) | 62.7(10) | 67.1(11) |
| T C/°C | 490.6 | 484.3 | 491.3 |
| CTE/°C−1 | −1.99 × 10⁻⁵ | −1.68 × 10⁻⁵ | −2.00 × 10⁻⁵ |
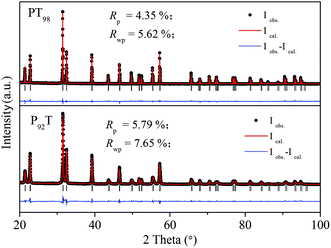
As shown in Fig. 1, PT98 and P92T samples are in pure tetragonal phases, and the crystal structure can be well refined using the same structure model with PT (P4mm). In Table 1, we compare the c/a, cell volume, Ps at room temperature and TC of P92T, PT98 and PT. It is found that PT and PT98 are very similar in their structural properties, whereas P92T is greatly different from PT. The c axis of P92T is also smaller than that of PT, while the a axis is bigger than that of PT. Thus, the c/a of P92T (1.060) is smaller than that of PT which has a value of 1.065. The unit cell volume of P92T at room temperature is also smaller than that of PT. It is known that the ferroelectric dipole is aligned with the direction of the c axis, which strongly correlates with the lattice and the Ps displacement. As shown in Table 1, the A-site Ps displacement of Pb2+(δzPb) decreases from 0.524 Å of PT to 0.497 Å of P92T, while the B-site Ps displacement of Ti4+(δzTi) decreases from 0.400 Å to 0.368 Å. This indicates that the reduction in the c axis is due to its close relation with the decrease in the Ps displacement. Due to the more covalent bonding of Ti with the four adjacent oxygens (O2) in the ab plane (dsp hybridization), the linkage of O1–Ti–O1 along the c axis becomes more flexible than the stiff Ti–O2 bonds24,25 during compression and elongation. On the other hand, for the B-site deficiency, the crystal structure properties of PT are rarely affected due to the fact that only a small concentration of B-site vacancies can be introduced. Therefore, the ferroelectric properties cannot be significantly affected, and thus the NTE does not change apparently.
 | ||
| Fig. 1 XRD patterns of PT98 and P92T. Observed (point), calculated (line) and difference profiles at room temperature after Rietveld refinement using the P4mm space group for PT98 and P92T. | ||
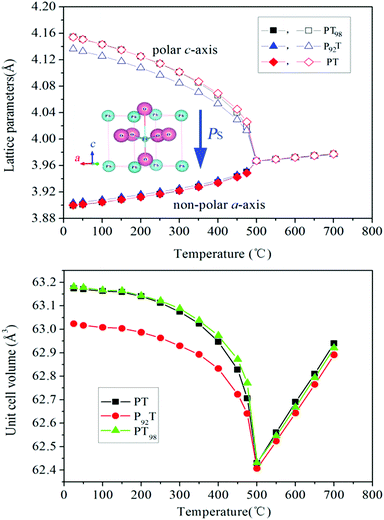
High temperature X-ray diffraction measurements from RT to 700 °C were performed to determine the evolution of the cell parameters of PT, P92T and PT98. As shown in Fig. 2(a), the a axis in all three compositions increases upon heating, while the c axis decreases with increasing temperature below TC. The c axis of P92T is also smaller than that of the other two compositions, which reduces the unit cell volume (Fig. 2b). As a result, the NTE of P92T is weakened significantly, while the NTE of PT98 is nearly identical to that of PT. The CTE of P92T is −1.58 × 10⁻⁵ per °C, which is smaller than that for PT (−1.99 × 10⁻⁵ per °C). As shown in Fig. 2b, the difference in the NTE is mainly due to the change in the c-axis. It has been known that there is coupling between the c-axis and Ps for PT-based ferroelectrics. In the P92T sample, the Ps displacements are reduced at both A and B-sites compared with PT, but not for PT98 (Table 1), thus indicating that ferroelectricity is reduced significantly in P92T. It is therefore possible to conclude that the weakened NTE of P92T is a result of the reduction in ferroelectricity. The present study is in good agreement with previous studies.1
 | ||
| Fig. 2 Temperature dependence of the (a) lattice constant, and (b) unit cell volume of PT, P92T and PT98. The error bar is too small to view as it is smaller than the experimental data icon. | ||
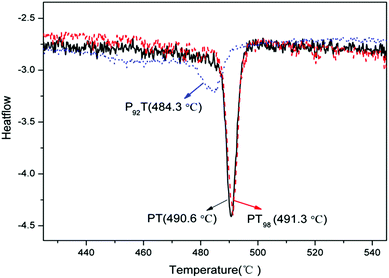
Additionally, the phase transition temperatures from tetragonal to cubic have been measured using DSC measurements as shown in Fig. 3. The TC values of PT, P92T and PT98 are determined to be 490.6 °C, 491.3 °C and 484.3 °C, respectively. The reduction in TC indicates a reduced Ps, which is consistent with the structure refinement results.
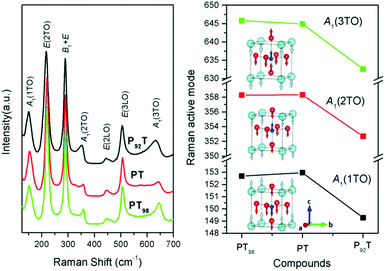
The Raman spectra of PT, PT98 and P92T are shown in Fig. 4. PT has a tetragonal space group symmetry C4v1 with an ABO3 formula unit cell, and is composed of 12 optical modes that can be divided into three categories: three A1-symmetry modes, eight E-symmetry modes, and one B1-symmetry mode. The three transverse optical (TO) modes of A1-symmetry (A1(1TO), A1(2TO), and A1(3TO)) are important for PbTiO3-based ferroelectric compounds because the vibrations are along the direction of the Ps.26 Specifically, the A1(1TO) soft mode is composed of the displacement of the TiO6 octahedron relative to the lead atoms, while the A1(2TO) soft mode is composed of the displacements of the titanium ion relative to the oxygen and lead ions. In A1(3TO) soft mode, titanium ions, with oxygen ions lying inbetween, move in the c-axis direction.26,27 The change in these A1-symmetry modes are highly correlative with the Ps. The results show that the Raman active modes of A1(1TO), A1(2TO) and A1(3TO) soften from PT to P92T, but remain relatively similar from PT to PT98 (Fig. 4). This indicates that the Ps displacements are reduced at both the A- and B-sites in P92T, but not in PT98. Furthermore, the ferroelectricity is reduced in P92T, but not in PT98, which confirms the results described above.
In view of these findings, we can thus conclude that the decrease in the Ps displacement is caused by the defects in PT. To clarify, the c axis is closely related with Ps displacement such that the decrease of Ps displacement triggers the decrease in the c axis. As shown in Table 1, both δzTi and δzPb of P92T are smaller than those for PT at room temperature. This is why the c axis of P92T is much smaller than that of PT; on the other hand, the a axis is related with the TiO6 octahedron which is stable in a single phase, so the change in the a axis is small. This explains why the unit cell volume of P92T is smaller than that of PT in the ferroelectric phase below TC (Fig. 2(b)). Furthermore, at TC, the ferroelectric phase transforms to a paraelectric cubic one and the Ps displacements disappear, making the unit cell volume at TC similar for both PT and P92T, thus causing the NTE of P92T to clearly decrease. In addition, the TC of P92T is found to be smaller than that of PT due to the small Ps displacement of P92T and less energy is needed for the phase transition, which can be described by the Landau theory.28
Conclusions
In summary, we studied the cation deficiency effect on negative thermal expansion in PbTiO3. The resulting structural refinements and softening of A1(TO) modes suggest that Pb2+ deficiency in PT leads to a Ps displacement reduction and a slight decrease of TC. As a result, the NTE is weakened from −1.99 × 10⁻⁵ per °C to −1.68 × 10⁻⁵ per °C. However, due to the limited concentration of B-site vacancies, the Ti4+ deficient sample does not show apparent changes in Ps displacement and CTE. The present study provides further evidence to support our previous finding that the NTE of PT-based compounds has a close relationship with Ps displacement. Our experimental result provides a possible method to control the NTE of PT-based compounds and other NTE materials by the introduction of a deficiency.Acknowledgements
This work was supported by the National Natural Science Foundation of China (grant no. 91022016, 91422301, and 21231001), the Program for Changjiang Scholars and the Innovative Research Team in University (IRT1207), and the Fundamental Research Funds for the Central Universities, China (grant no. FRF-SD-13-008A).Notes and references
- F. A. Hummel, J. Am. Ceram. Soc., 1951, 34, 235 CrossRef CAS PubMed.
- G. Shirane, S. Hoshino and K. Suzuki, Phys. Rev., 1950, 80, 1150 Search PubMed.
- T. A. Mary, J. S. O. Evans, T. Vogt and A. W. Sleight, Science, 1996, 272, 90 CAS.
- J. Chen, J. L. Hu, J. X. Deng and X. R. Xing, Chem. Soc. Rev., 2015, 44, 3522 RSC.
- A. W. Sleight, Inorg. Chem., 1998, 37, 2854 CrossRef CAS.
- J. S. O. Evans, J. Chem. Soc., Dalton Trans., 1999, 3317 RSC.
- P. Mohn, Nature, 1999, 400, 18 CrossRef CAS.
- S. Margadonna, K. Prassides and A. N. Fitch, J. Am. Chem. Soc., 2004, 126, 15390 CrossRef CAS PubMed.
- A. Sleight, Nature, 2003, 425, 674 CrossRef CAS PubMed.
- R. Roy, D. K. Agrawal and H. A. McKinstry, Annu. Rev. Mater. Sci., 1989, 19, 59 CrossRef CAS.
- Y. K. Kwon, S. Berber and D. Tománek, Phys. Rev. Lett., 2004, 92, 015901–015901 CrossRef.
- J. Arvanitidis, K. Papagelis, S. Margadonna, K. Prassides and A. N. Fitch, Nature, 2003, 425, 599 CrossRef CAS PubMed.
- A. L. Goodwin and C. J. Kepert, Phys. Rev. B: Condens. Matter, 2005, 71, 140301–140301 CrossRef.
- J. Chen, X. R. Xing, R. B. Yu and G. R. Liu, J. Am. Ceram. Soc., 2005, 88, 1356 CrossRef CAS PubMed.
- X. R. Xing, J. X. Deng, J. Chen and G. R. Liu, Rare Met., 2003, 20, 4 Search PubMed.
- X. R. Xing, J. Chen, J. X. Deng and G. R. Liu, J. Alloys Compd., 2004, 360, 286 CrossRef.
- D. Taylor, Br. Ceram. Trans. J., 1985, 84, 181 CAS.
- J. Chen, X. R. Xing, C. Sun, P. Hu, R. B. Yu, X. W. Wang and L. H. Li, J. Am. Chem. Soc., 2008, 130, 1144 CrossRef CAS PubMed.
- P. Hu, J. Chen, J. X. Deng and X. R. Xing, J. Am. Chem. Soc., 2010, 132, 1925 CrossRef CAS PubMed.
- J. Chen, X. R. Xing, G. R. Liu, J. H. Li and Y. T. Liu, Appl. Phys. Lett., 2006, 89, 101914 CrossRef PubMed.
- J. Chen, X. R. Xing, R. B. Yu and G. R. Liu, Appl. Phys. Lett., 2005, 87, 231915 CrossRef PubMed.
- C. Sun, Z. M. Cao, J. Chen, R. B. Yu, X. Y. Sun, P. H. Hu, G. R. Liu and X. R. Xing, Phys. Status Solidi B, 2008, 245, 11 Search PubMed.
- J. Chen, K. Nittala, J. S. Forrester, J. L. Jones, J. X. Deng, R. B. Yu and X. R. Xing, J. Am. Chem. Soc., 2011, 133, 11144 Search PubMed.
- R. E. Cohen, Nature, 1992, 358, 136–138 CrossRef CAS PubMed.
- Y. Kuroiwa, S. Aoyagi, A. Sawada, J. Harada, E. Nishibori, M. Takata and M. Sakata, Phys. Rev. Lett., 2001, 87, 217601 CrossRef CAS.
- J. D. Freire and R. S. Katiyar, Phys. Rev. B: Condens. Matter., 1988, 37, 2074–2085 CrossRef CAS.
- J. Frantti, V. Lantto, S. Nishio and M. Kakihana, Phys. Rev. B: Condens. Matter., 1999, 59, 12 CrossRef CAS.
- R. A. Cowley, Adv. Phys., 1980, 29, 1 CrossRef CAS PubMed.
Footnote |
| † Electronic supplementary information (ESI) available. See DOI: 10.1039/c5qi00154d |
| This journal is © the Partner Organisations 2015 |


