DOI:
10.1039/C4RA07412B
(Paper)
RSC Adv., 2015,
5, 6976-6984
Investigation of templated and supported polyaniline adsorbent materials
Received
22nd July 2014
, Accepted 11th December 2014
First published on 12th December 2014
Abstract
Various structural forms of poly(aniline) (PANI) were synthesized in aqueous solution with different acids and/or a chitosan template support to afford nanoparticle PANI (NP; synthesized in water), bulk-PANI (aqueous acetic acid (HAc), hydrochloric acid (HCl) and sulfuric acid (SA) and a chitosan–PANI composite (CH) material. The polymer materials were characterized using spectroscopy (1H NMR, FT-IR, UV-vis), TGA and P-XRD. The polymer materials were structurally diverse according to their unique morphology related to the ratio between quinoid and benzenoid monomer units of PANI. The sorption and kinetic uptake properties of PANI materials with methylene blue (MB) in aqueous solution were studied where variable sorption capacity was observed, as follows: NP > HAc > HCl > SA > CH. The Sips isotherm model describes the adsorptive equilibrium uptake while the pseudo-second order kinetic model describes the time dependent uptake of MB. The monolayer sorption capacities (Qm) reported herein are among the highest (ca. 6-fold greater) relative to other Qm values reported for PANI materials in the literature.
Introduction
The use and uncontrolled release of organic and inorganic dyes into aquatic environments is a consequence of various industrial processes. Discharge of dyes through wastewater release to the environment adversely affects ground and surface water environments, human and ecosystem health.1,2 Methylene blue (MB) is a widely used industrial textile dye and there have been many approaches to sequestration of MB from industrial wastewater that differ by their efficiency, cost and environmental impact.3,4 The aromatic structure of MB contributes to its relative stability and recalcitrant nature; thus, a range of removal methods have been investigated that include oxidation,5 catalytic degradation,6 electrocatalytic,7,8 thermocatalytic,9 photocatalytic10 and adsorption.11 Adsorption is a practical removal method for waterborne because of its general versatility, facile operation, relatively low cost, and energy efficiency.1,2,7,12,13
Several common adsorbents such as alumina, silica gel, zeolites, activated carbon (AC), and biomaterial adsorbents have been used for the removal of dyes.1,2,14,15 In the case of AC, it exists in various structural forms suitable for the purification of air and various pollutants from industrial wastewaters; powdered (PAC), granulated (GAC), pellet (ACP), and fiber (ACF).14,16–19 In part, this is due to highly porous structure and surface area of AC,20 in agreement with the variable uptake MB (21.5–980 mg g−1).11,21–23 The material and regeneration costs of AC are high and the attenuation of it sorptive efficiency after recycling limits its wider applicability for specialized remediation problems.24,25
Polyaniline (PANI) is a unique adsorbent material because of its relatively low cost, facile synthesis, chemical stability, and tunable properties.26 Structural tunability of PANI is evidenced by the formation of hybrid polymers with different morphology (e.g., ribbons,27 dendritic,28 fibers and wires,29 and sheets30). Synthetic modification of PANI is related to its unique protolytic behaviour (cf. Scheme 1),31 as evidenced by the imine nitrogen sites of the emeraldine base (EB) and emeraldine salt (ES) forms of PANI. ES is an acid–base complex between a nitrogen group and a base which affords a composite or doped PANI material.32 PANI materials are used in rechargeable batteries, solar cells, sensors, anti-static and anti-corrosion coatings, asymmetric films, and membranes.33 PANI sorbent materials used for the uptake of sulfonated dyes34 and Direct Blue 78 from water.35 Conventional PANI, PANI nanoparticles (PANI-NPs) and PANI nanotubes (PANI-NTs) and its composites were reported to adsorb MB and malachite green.4,36–38 The sorptive uptake properties of PANI-based adsorbents are limited by their limited surface area; however, modified materials such as PANI-NPs and/or composites may display improved properties.4,36,39
 |
| | Scheme 1 Illustration of the synthesis, chemical structure, acid–base doping/de-doping chemistry of polyaniline/sulfuric acid and ammonium sulfate by-products. | |
Herein, we report the synthesis and characterization of different structural of PANI at variable conditions (i.e. acid strength, dilution, and polymer template). The uptake properties of PANI materials at equilibrium and kinetic conditions were investigated using methylene blue (MB).4,27,28
Materials and methods
Materials
Aniline (99.5% pure), acetic acid, methylene blue (MB), chitosan (low molecular weight, 75–85% deacetylated), dimethyl sulfoxide (DMSO) and semi-permeable dialysis tubing were purchased from Sigma-Aldrich Canada Ltd. Ammonium peroxydisulfate (APS, 98.0% pure), ammonia, hydrochloric acid and sulfuric acid were obtained from Alfa Aesar, BDH, Fisher scientific and EMD USA respectively. Dialysis tubing closures purchased from the Spectra/Por company. All chemicals were used as received without further purification unless stated otherwise.
Synthesis of water-catalyzed PANI
PANI nanoparticles (nano-PANI; NP) were synthesized by adding of 0.978 mL aniline (0.0107 mol) in 200 mL of Millipore water with stirring for 30 min. Separately, 2.94 g APS (0.0129 mol) was added to 200 mL of Millipore water with a molar ratio of 1.2![[thin space (1/6-em)]](https://www.rsc.org/images/entities/char_2009.gif) :1 relative to aniline. The diluted products were mixed for 30 min. with subsequent addition of APS into the aniline solution. The resulting solution was stirred for 24 h. The products were washed with excess Millipore water, vacuum filtered, and dried for 24 h at room temperature. The dried PANI product was deprotonated with excess 0.1 M ammonia. The product obtained was 0.740 g and [74.2% yield].
:1 relative to aniline. The diluted products were mixed for 30 min. with subsequent addition of APS into the aniline solution. The resulting solution was stirred for 24 h. The products were washed with excess Millipore water, vacuum filtered, and dried for 24 h at room temperature. The dried PANI product was deprotonated with excess 0.1 M ammonia. The product obtained was 0.740 g and [74.2% yield].
Synthesis of acid-catalyzed PANI
PANI in bulk solution (bulk-PANI) was synthesized similarly as the NP; however aniline and APS were likewise diluted 10-fold in 20 mL of 0.1 M of HCl. The other PANI polymers were prepared by substituting 20 mL of HCl with 20 mL of 0.1 M acetic acid 0.1 M sulfuric acid. The weight of bulk-PANI products and the yields (%) were as follows: (HCl): 0.922 g [92.5%], acetic acid (HAc): 0.951 g [95.4%], sulfuric acid (HS): 1.315 g [82.7%].
Synthesis of composite PANI
Chitosan (0.2 g) was dissolved in 20 mL of 0.1 M HCl for 1 h until a clear solution was obtained. Separately, 0.365 mL of aniline dissolved in 20 mL of 0.1 M HCl was stirred for 1 h and allowed to equilibrate for 24 h. After 24 h, a solution of 1.2:1 APS to aniline (1.095 g) in 20 mL of 0.1 M HCl was added to the mixture and left to mix for 1 h. The addition of the APS solution to the chitosan/aniline solution was followed by an additional hour of mixing. The combined solutions were mixed for 24 h and then washed with excess Millipore water vacuum filtration, followed by drying for 24 h at ambient conditions. The product (CH) was deprotonated with 0.1 M ammonia until a neutral pH was achieved yield 0.623 g [31.2%].
Preparation of MB solutions
MB with the molecular formula C16H18N3ClS (formula weight = 319.85 g mol−1) was used as the dye adsorbate in this study. MB displays a maximum wavelength of absorbance at approximately 663 nm. A calibration curve was created in order to determine the molar absorptivity at λ = 663 nm to establish the working range of concentrations. A 10 mM MB stock solution was prepared by dissolving 1.5 g of MB in 0.5 L of Millipore water (0.3% w/w) with appropriate dilution in water of the stock MB solution to achieve the required concentration as determined by the Beer–Lambert law.
Characterization of polymers
Thermograms of the polymers were obtained using thermogravimetric analysis, TGA (Q500 TA Instruments). Samples were heated in open platinum pans at 25 °C and allowed to equilibrate for 5 min prior to heating at a scan rate of 5 °C min−1 up to 900 °C. FT-IR spectra were obtained with a Bio-RAD FTS-40 spectrophotometer where samples were analyzed as powders in reflectance mode. Solid samples were prepared by co-grinding polymers (about 5 mg) with pure spectroscopic grade KBr (50 mg) in a small mortar and pestle. The DRIFT (Diffuse Reflectance Infrared Fourier Transform) spectra were obtained at 295 K with a resolution of 4 cm−1 over the 400–4000 cm−1 region. DRIFT spectra were recorded with multiple scans in reflectance mode and corrected relative to spectroscopic grade KBr. The intensity of the DRIFT spectra is reported in Kubelka–Munk units. 1H-NMR was done with a wide-bore (89 mm) 11.7 T Oxford superconducting magnet system equipped with 5 mm PATX1 probe operating at 500 MHz. Operating parameters were controlled using a SSSC 500 console and workstation running X-WIN NMR 3.5 (Bruker Bio Spin Corp; Billerica, MA, USA). The Top Spin 1.3 software included the various standard pulse programs for collection of all NMR spectra. A Varian Cary 100 Scan UV-vis spectrophotometer was used to measure MB absorbance (λmax = 663 nm) spectra in aqueous solution and to analyze electronic transitions of the PANI materials dissolved in DMSO. Structural properties of the PANI materials were studied using powder X-ray diffraction (P-XRD). Diffractograms were collected using PANalytical Empyrean powder X-ray diffractometer using monochromatic Co-Kα1 radiation. The applied voltage and current were set to 40 kV and 45 mA, respectively. The samples were mounted in a horizontal configuration after evaporation of hexane films. The PXRD patterns were measured in continuous mode over a 2θ range of 6–45° with a scan rate of 3.2° min−1.
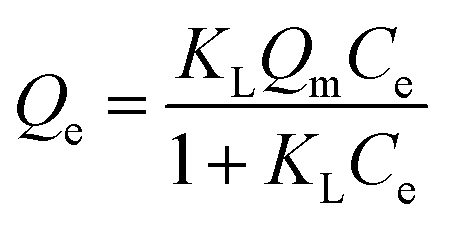
Adsorption isotherms and modeling
Fixed amounts (∼10 mg) of the powdered and sieved polymer materials were mixed with 3 mL of aqueous solution containing different amounts of aqueous dye (0.1–1.5 mM) after equilibration on a horizontal shaker (SCILOGEX SK-O330-Pro) for 24 h. The initial (Co) and final (Ce) values for MB solutions were determined by measuring absorbance at 663 nm by using UV-vis absorption spectroscopy. The sorption isotherms are depicted as plots of the adsorbed amount of MB in the polymer phase per mass of sorbent (Qe; mmol g−1) versus the residual equilibrium concentration of MB (Ce). The value of Qe is defined by eqn (1) where Co is the initial MB concentration, V is the volume of solution, and m is the mass of sorbent.| |
 | (1) |
The sorption isotherms were fitted using Langmuir,40 Freundlich41 and Sips42 isotherm models (cf. eqn (2)–(4)). The Langmuir model assumes that the adsorbent surface is homogeneous, while the Freundlich and Sips models account for surface heterogeneities. The binding constant is represented by an equilibrium parameter (Ki). The sum of square of errors (SSE) was used as a criterion of the “best fit” while a lower SSE value (cf. eqn (5)) indicates an overall greater goodness-of-fit. The optimal fit was obtained by minimizing the SSE for all data across the range of conditions investigated. Qei is the experimental value, Qef is the fitted value, and N is the number of Qe data points.
| |
 | (2) |
| |
 | (4) |
| |
 | (5) |
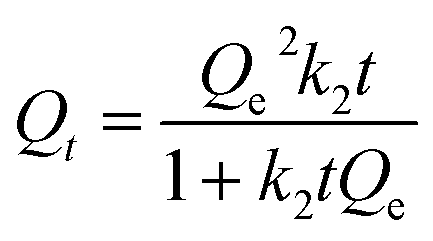
Adsorption kinetics and modeling
Relative kinetic uptake experiments were performed using an in situ one pot set-up. Briefly, a length of the dialysis tubing (6 cm) was cut to size and soaked in the aqueous MB solution for ∼2 h. One end of the tubing was clipped using the weighted closures. 10 mg of each respective PANI material was added and the opposite end was closed. The tubing housed with the powdered copolymer was immersed in a 120 mL MB solution. 3.00 mL of the dye was pipetted out at variable time intervals and quantified using UV-vis spectroscopy at λmax = 664 nm without further dilution. The data was fit using a pseudo-first order (PFO)43 and pseudo-second order (PSO)44 model, as described by eqn (6) and (7), respectively. Qt and Qe are the amount of dye adsorbed at any time (t) and at equilibrium, respectively. ki is a rate constant (k1; i = 1) for PFO and k2 (where i = 2) for the PSO, and t is the time. Similar to the equilibrium isotherms, the SSE (cf. eqn (5)) was used as a criterion of the “best fit” between theory and experiment.| |
 | (7) |
Results and discussion
The DRIFT spectra were normalized in order to compare the relative differences between the respective PANI materials. Fig. 1 shows the IR region of interest (2000–500 cm−1) where the quinoid (Q) ring stretching is observed at 1590 and 1586 cm−1 for strong and weak acids, respectively.45 In this work (cf. Table 1), a blue shift of the C–C skeletal modes is observed with increased acidity, in agreement with a previous report.45 The benzenoid (B) ring stretching band occurs at 1507 cm−1 for strong acids; whereas, a band appears at 1505 cm−1 for weak acids such as water.45 Similar blue shifts were observed in Table 1. The presence of both B and Q signatures support the conclusion by Kaplan et al. where the PANI-EB form consists of alternating benzenoid diamine and quinoid diimine units.46 The ratio of peak areas for Q ring stretching relative to that for B decreases with increased acidity, as follows: 1.21 (NP), 1.19 (AC), 1.17 (HC), and 1.10 (HS). This infers that the amount of Q rings relative to B ring units vary with acid strength. In all cases, the observed C![[double bond, length as m-dash]](https://www.rsc.org/images/entities/char_e001.gif) C stretching of aromatic rings and NN stretching occurred ∼1446 cm−1 for all the PANI materials except for the chitosan supported PANI. However, the band intensity becomes attenuated with increased acidity. The phenazine ring stretching is seen at 1414 cm−1 for the PANI materials except for NP observed at 1416 cm−1. The C–N stretching vibration band is observed ∼1375 cm−1 (C–N stretching a Q ring)47 for all PANI materials except NP. The C–N band overlaps with the band centered at ∼1300 cm−1. The integrated peak area increases with greater acid strength: HAc (4.65), HCl (4.88) and HS (4.92), while the peak ∼1041 cm−1 (present in all materials except for the PANI composite) is attributed to the HSO4−/SO3− group on sulfonated aromatic ring systems.48 This band is attenuated with increased acidity, as evidenced by the relative peak areas: NP (4.30), HAc (3.77), HCl (3.53), and HS (3.28). The bands near 831–691 cm−1 are attributed to substituted ring systems where the cumulative peaks areas are as follows: HAc (11.9), HCl (12.8), HS (11.9) and NP (14.7). The IR results indicate that NP has more phenazine-like structures relative to bulk PANI.
C stretching of aromatic rings and NN stretching occurred ∼1446 cm−1 for all the PANI materials except for the chitosan supported PANI. However, the band intensity becomes attenuated with increased acidity. The phenazine ring stretching is seen at 1414 cm−1 for the PANI materials except for NP observed at 1416 cm−1. The C–N stretching vibration band is observed ∼1375 cm−1 (C–N stretching a Q ring)47 for all PANI materials except NP. The C–N band overlaps with the band centered at ∼1300 cm−1. The integrated peak area increases with greater acid strength: HAc (4.65), HCl (4.88) and HS (4.92), while the peak ∼1041 cm−1 (present in all materials except for the PANI composite) is attributed to the HSO4−/SO3− group on sulfonated aromatic ring systems.48 This band is attenuated with increased acidity, as evidenced by the relative peak areas: NP (4.30), HAc (3.77), HCl (3.53), and HS (3.28). The bands near 831–691 cm−1 are attributed to substituted ring systems where the cumulative peaks areas are as follows: HAc (11.9), HCl (12.8), HS (11.9) and NP (14.7). The IR results indicate that NP has more phenazine-like structures relative to bulk PANI.
 |
| | Fig. 1 Normalized FTIR spectra of the PANI materials. | |
Table 1 FT-IR bands in the 2000–500 cm−1 region for the main absorption bands of each PANI material
| Wavenumber (cm−1) |
Assignment |
| HAc |
HCl |
HS |
NP |
CH |
| 1587.6 |
1587.8 |
1588.5 |
1587.5 |
1594.1 |
Quinoid (Q) ring stretching |
| 1508.4 |
1509.3 |
1511.1 |
1513.0 |
1504.9 |
Benzenoid (B) ring stretching |
| 1446.6 |
1446.6 |
1447.0 |
1446.5 |
— |
CC stretching of aromatic ring/NN stretching |
| 1414.8 |
1414.7 |
1414.6 |
1416.1 |
1415.0 |
Phenazine ring-stretching |
| 1375.2 |
1376.2 |
1375.5 |
— |
1378.0 |
C–N stretching in QBQ units |
| 1301.6 |
1308.3 |
1311.9 |
1300.0 |
1314.1 |
ν(C–N) of secondary aromatic amine |
| 1240.6 |
1237.8 |
1241.9 |
1236.8 |
1246.3 |
ν(C–N) BBB unit |
| 1167.1 |
1176.9 |
1180.7 |
1175.0 |
1168.0 |
NQN/δ(C–H) |
| 1150.0 |
1148.3 |
1151.7 |
1151.7 |
1155.2 |
B–NH–B/δ(C–H) |
| 1041.2 |
1041.1 |
1040.5 |
1041.4 |
— |
HSO4−/SO3− group on sulfonated aromatic ring |
| 856.0 |
858.5 |
862.3 |
858.1 |
851.5 |
γ(C–H) (1,2,4-trisubstituted ring)/B ring deformation |
| 831.9 |
829.4 |
830.7 |
836.8 |
827.5 |
γ(C–H) (1,4-disubstituted ring)/Q ring deformation |
| 740.7 |
756.2 |
740.8 |
760.4 |
744.4 |
γ(C–H) (mono- vs. 1,2-disubstituted ring) |
| 695.6 |
694.5 |
697.6 |
697.2 |
691.1 |
Out-of-plane ring bending (mono-substitution) |
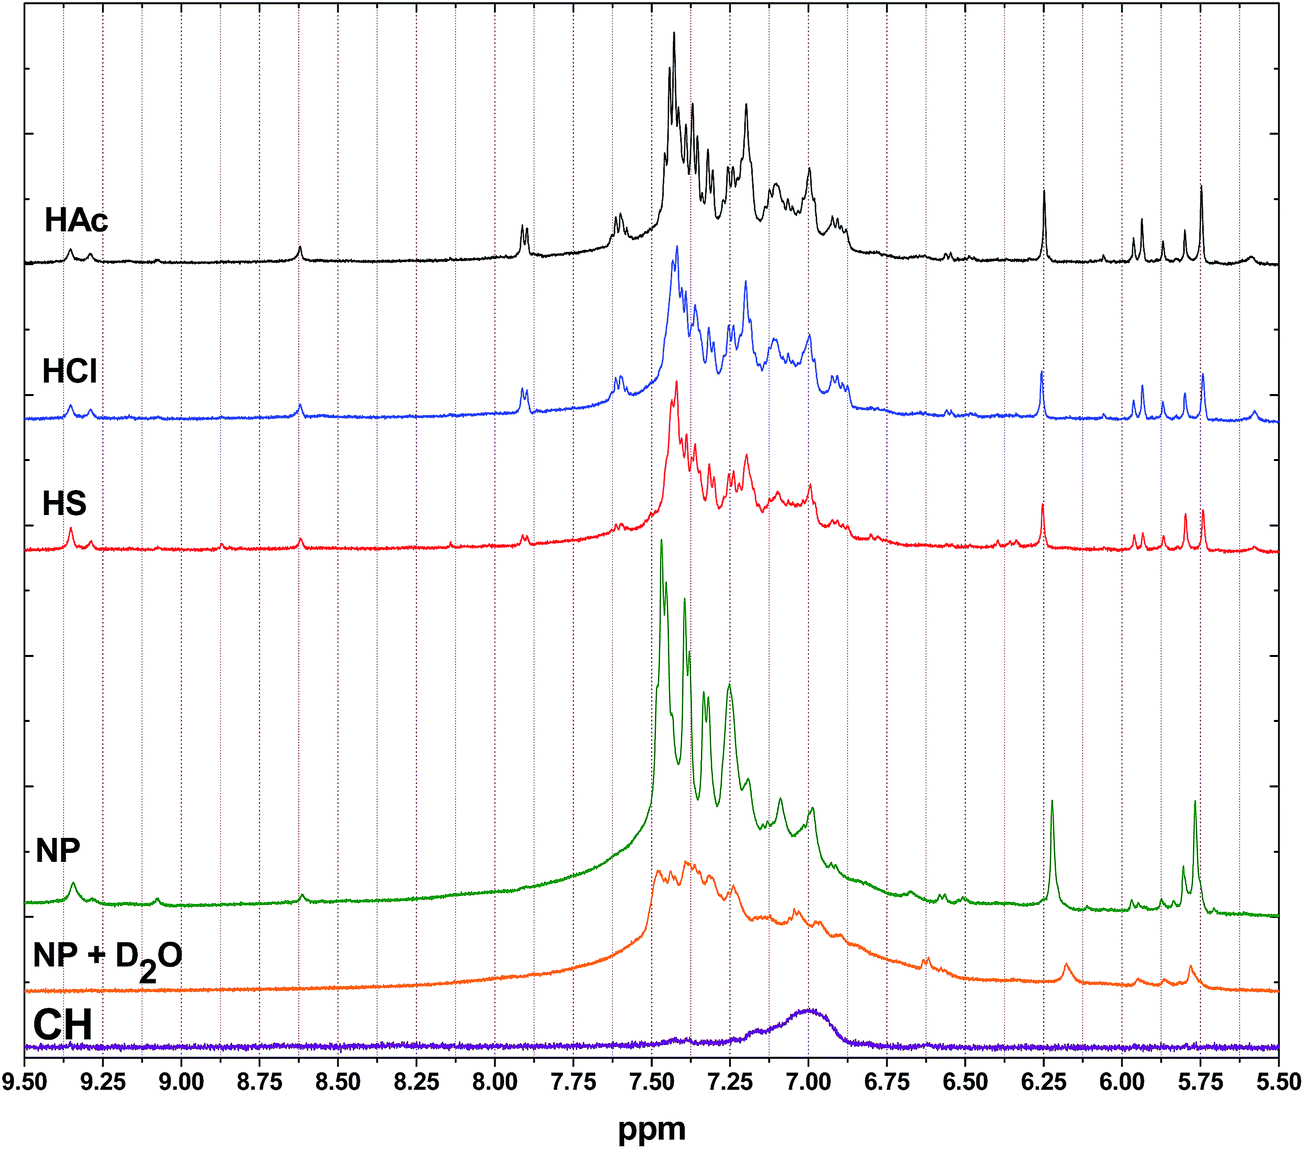
Fig. 2 shows the 1H NMR spectra for the PANI materials in the low field region (δ = 9.5–5.5 ppm), where δ = 9.35, 9.30 and 9.08 ppm are assigned to the intermolecular H-bond via the carbonyl group.49,50 The chemical shift ∼8.6 ppm is assigned to amine proton while the signals at δ = 9.5–8.6 ppm disappear when D2O is added to NP (cf. Fig. 2). The aromatic protons are observed downfield at δ = 7.93–6.99 ppm. The spectral region between 6.26 and 5.50 ppm is assigned to protons from the hetero-junction structural regions.50 Specifically, the protons near δ = 6.2 and 5.7 ppm are attributed to the presence of substituted 1,4-p-benzoquinones.49 CH shows a single broad resonance between 7.25 and 6.75 ppm indicating the aromatic ring system of PANI.
 |
| | Fig. 2 1H NMR spectra recorded at 295 K and 500 MHz in DMSO-d6. Chemical shifts are reference to TMS (δ = 0.0 ppm). | |
First derivative TGA plots are shown in Fig. 3 and the accompanying thermal parameters are listed in Table 2. There are four thermal events with weight loss profiles observed for the PANI materials across the temperature range. The first thermal event (cf. Table 2) is attributed to desorption of water since PANI is known to be hygroscopic.51 Since the TGA experiments were conducted in an open pan environment where surface dehydration occurs below 100 °C. Water loss appears at different temperatures for all the materials. NP has the lowest intensity peak water loss followed by bulk-PANI and subsequently the composite material. Table 1 illustrates similar trends for other PANI materials for the loss of water. The second thermal event for NP has a lower maximum decomposition temperature; Tmax-d (300 °C) compared to the bulk-PANI, a follows: 322 (HAc), 323 (HCl) and 341 °C (HS). This agrees with a previous report inferring that NP has more oligomer components relative to the bulk-PANI because of its more granular morphology.48 Results from the weight loss profiles show that NP reveals a higher weight loss (24.6%) compared to the bulk-PANI as follows: 14.0% (HAc), 14.1% (HCl), and 9.42% (HS). As the acid strength increases, the PANI materials become more globular in nature. TGA evidence of such structural features is observed from the third thermal event where a similar trend is shown for the Tmax-d, % weight loss and peak area (cf. Table 2). The peak area ratio of the third and the second thermal events are as follows: 2.00 (HAc), 2.00 (HCl), 3.17 (HS) and 0.764 (NP). The relative peak areas provide support that NP morphology is more linear in nature whereas HS is more globular in nature. It is noteworthy that the second thermal event has low temperature shoulders for each of the PANI materials indicates that decomposition is a heterogeneous process. The fourth thermal event in the high temperature regime is similar the materials (Tmax-d ∼ 750 °C). As well, the ratio of weight loss (%) for the latter thermal event relative to the sum of the second and third thermal events are as follows: 0.210 (HAc), 0.232 (HCl), 0.248 (HS), and 0.216 (NP). The TGA for CH is different from the other materials in terms of the thermal events (2 and 3) with the former representing decomposition of chitosan and the latter is attributed to PANI. TGA results for pure chitosan (not shown) show a single thermal event with a Tmax-d at 295 °C with a 48.1% weight loss. By comparison, CH reveals two thermal events that provide additional evidence for the presence of PANI in the composite material.
 |
| | Fig. 3 First derivative TGA plots (weight loss per °C vs. temperature) of PANI materials. | |
Table 2 Temperature range, weight loss (%), Tmax-d (°C) and peak area (% min per °C) for the four (1–4) thermal events (cf. Fig. 3) of the various PANI materials
| Material |
Parameters |
Thermal events |
| 1 |
2 |
3 |
4 |
| HAc |
Temp. Range (°C) |
25.0–126 |
126–366 |
366–652 |
652–900 |
| Weight loss (%) |
2.98 |
14.0 |
28.0 |
8.84 |
| Tmax-d (°C) |
53.6 |
322 |
507 |
749 |
| Peak area (% min per °C) |
0.192 |
1.92 |
2.74 |
0.600 |
| HCl |
Temp. Range (°C) |
25.0–117 |
117–375 |
375–651 |
651–900 |
| Weight loss (%) |
2.50 |
14.1 |
27.9 |
9.75 |
| Tmax-d (°C) |
50.5 |
323 |
509 |
753 |
| Peak area (% min per °C) |
0.269 |
2.00 |
2.52 |
1.12 |
| HS |
Temp. Range (°C) |
25.0–134 |
134–381 |
381–661 |
661–900 |
| Weight loss (%) |
3.75 |
9.42 |
29.9 |
9.74 |
| Tmax-d (°C) |
58.9 |
341 |
518 |
752 |
| Peak area (% min per °C) |
0.567 |
1.79 |
3.04 |
1.57 |
| NP |
Temp. Range (°C) |
25–131 |
131–407 |
407–648 |
648–900 |
| Weight loss (%) |
2.81 |
24.6 |
18.8 |
9.36 |
| Tmax-d (°C) |
38.2 |
300 |
487 |
751 |
| Peak area (% min per °C) |
0.538 |
3.25 |
2.73 |
1.36 |
| CH |
Temp. Range (°C) |
25.0–177 |
177–376 |
376–666 |
666–900 |
| Weight loss (%) |
5.01 |
21.1 |
23.5 |
3.29 |
| Tmax-d (°C) |
99.2 |
254 |
485 |
880 |
| Peak area (% min per °C) |
0.255 |
3.59 |
4.00 |
0.0524 |
P-XRD for PANI materials (cf. Fig. 4) show similar spectra except for CH which is highly amorphous in nature. The diffraction lines of the other PANI materials are less sharp (more amorphous) with increasing acid strength. This supports the TGA evidence that PANI materials prepared with strong acid afford more granular morphology while water catalyzed PANI (NP) affords linear (oligomers) PANI. Linear PANI enables more efficient packing and long-range order which is further evidenced by the distinctive strong and sharp peak observed at 2θ = 7.61°. The diffraction results indicate the presence of oligomers and phenazine-like units.52 Moreover, the signatures indicate the organization of the PANI chains into nanotubes or lamellae.48,53,54 As shown in Fig. 4, the intensity of the peak decreases in the following order: NP > HAc > HCl > HS. Additional diffraction peaks are observed (upon magnification of the P-XRD) for the NP materials are denoted by the following lines: 2θ = 21.9°, 23.3°, 27.3°, 30.3°, 31.3°, 33.4° and 34.2°. The other PANI materials show reduced scattering due to band broadening. Interestingly, HS has two broad peaks (not observed in the other materials) at 2θ = 11.0° and 17.8°. PANI-EB has been reported to have a single broad peak55–57 or several other P-XRD peaks54,58 between from 2θ = 15–35°. In this work, the PANI-EB materials prepared herein are more crystalline as evidenced by the appearance of several distinctive peaks. These results support the idea that the acid-catalyzed PANI adopts a more granular morphology which increases as the acid strength increases. On the other hand, NP has a more linear morphology, according to the synthetic conditions, as evidenced by the presence of linear oligomers.
 |
| | Fig. 4 Powder X-ray diffraction spectra of PANI materials at 295 K. | |
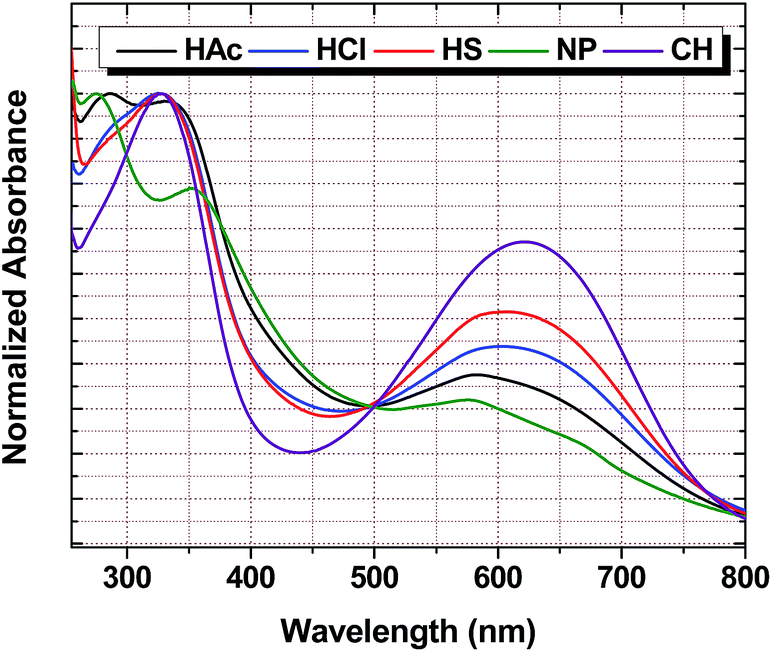
Fig. 5 shows the UV-vis spectra of the PANI materials. The de-doped form of PANI exhibit two absorption maxima at ∼320–326 nm and 598–620 nm represents the π–π* transition of the benzenoid ring and n–π* transition between the HOMO of the benzenoid ring (N nonbonding electrons) and the LUMO (π*) of the quinoid ring, respectively.59–62 In this work, the UV-vis absorption maxima vary for each material (HAc and NP) where two absorption maxima are seen in the region between 250–400 nm. The λmax for HAc is 296 nm and 341 nm and the bands for NP are observed at 283 and 358 nm. The other PANI materials display a signature with a λmax in the same region (333 nm for HCl and HS; 329 nm for CH). In the 500–800 nm region, NP is the only material that displays two bands (peak deconvolution using Origin Lab 8); 592 and 621 nm. The other materials display λmax at the following values: 624 (HAc), 627 (HCl), 624 (HS) and 649 nm (CH). The latter region is associated with the n–π* transition which tends to have an increased intensity from NP to bulk-PANI (with increasing acid strength) and composite PANI has the highest intensity. This infers that the number of benzenoid diamine units increase relative to quinoid diimine units which lead to an increased electronic transition between the two types of materials. This observation is supported by the IR results as discussed above on the peak ratios of Q relative to B.
 |
| | Fig. 5 UV-vis spectra for the PANI materials in DMSO solution. | |
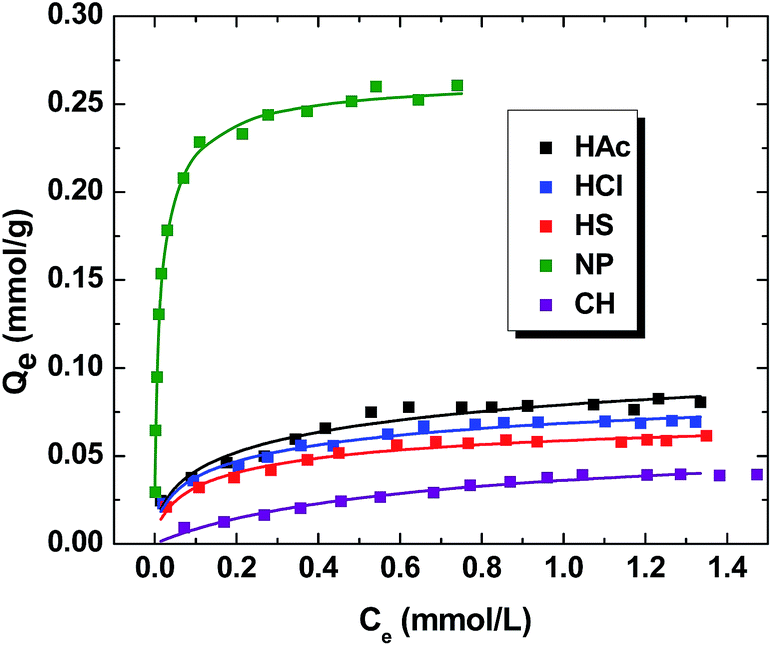
The isotherm results for the sorption of MB by the various PANI materials (i.e. HAc, HCl, HS, NP and CH) are shown in Fig. 6. The value of Qe increases nonlinearly as the total concentration of MB increases, reaching monolayer saturation conditions at higher values of Ce. The relative magnitude of Qe varies according the solvent system used for the synthesis of the PANI materials. The Sips model provides the “best-fit” the three models employed (cf. eqn (2)–(4)), as evidenced by the minimized SSE values by eqn (5). In the case of NP, the uptake of MB increases markedly at low Ce values, achieving saturation of the adsorption sites near 0.2 mM. The other PANI materials reveal a gradual increase of Qe as Ce increases, attaining a monolayer surface coverage (Qm ∼ 0.7 mM). The Qm value (parentheses; mmol g−1) obtained from the Sips isotherm model decreases in the following order: NP (0.267) > HAc (0.139) > HCl (0.109) > HS (0.0813) > CH (0.0624). This trend indicates that PANI materials prepared in dilute acid display greater Qm values. Moreover, the chitosan supported material had the lowest uptake of MB. The binding affinity (Ks; mM−1) can be derived from the Sips isotherm parameter (Ks) where the units are given in parentheses in descending order: NP (27.6) > HS (2.60) > HCl (1.68) > CH (1.37) > HAc (1.33). NP has the highest sorption affinity, which correlates with its greater sorption capacity. However, there is no correlation between Qm and Ks for the bulk-PANI and composite material, as reflected by the heterogeneity parameter (ns; eqn (4)). Bulk-PANI prepared with strong acids has greater sorption affinity despite its lower sorption capacity. This suggests that the morphology affects the sorptive affinity of MB towards the PANI materials. The sorptive uptake capacities of MB obtained herein are significantly greater than other reported studies of PANI or its supported materials reported in the literature (cf. Table 3).
 |
| | Fig. 6 Adsorption isotherms of MB PANI materials at pH 7.00 and 295 K. | |
Table 3 Comparison of the monolayer sorption capacities (Qm) of MB with various PANI and supported materials from the literature and this study
| Sorbent material |
Sorption capacity (mg g−1) |
Reference |
Solvent system |
| PANI-EB-NTs/silica composite |
10.3 |
36 |
0.1 M acetic acid |
| PANI-EB-NTs |
9.21 |
4 |
0.5 M acetic acid |
| PANI-EB |
13.9 |
37 |
0.1 M hydrochloric acid |
| PANI-EB |
11.5 |
38 |
32% hydrochloric acid |
| NP |
85.4 |
This work |
Water |
| HAc |
44.5 |
0.1 M acetic acid |
| HCl |
34.9 |
0.1 M hydrochloric acid |
| HS |
26.0 |
0.1 M sulphuric acid |
| CH |
20.0 |
0.1 M hydrochloric acid |
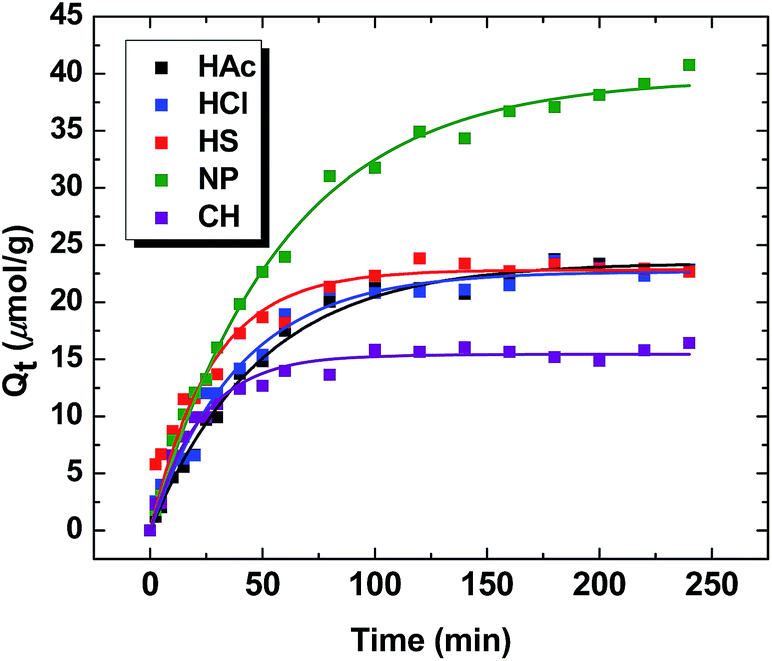
Fig. 7 illustrates the time dependent sorptive uptake of MB with the various PANI materials. The kinetic uptake of MB varies significantly between NP, bulk-PANI, or the CH composite material. The time dependent uptake for each system is well described by the PFO model (cf. eqn (6)), as evidenced by the “best-fit” in Fig. 7. The value of Qe given in parentheses (μmol g−1) for the various PANI materials: NP (39.6), HAc (23.4), HCl (22.7), HS (22.8) and CH (15.4). As expected, kinetic uptake shows a similar trend observed for the isotherm adsorption studies. Similarly, the value of k1 (parentheses; min−1) are as follows: NP (0.0171), HAc (0.0206), HCl (0.0254), HS (0.0371) and CH (0.0445). The trend for the k1 values are opposite to that shown for Qe. This effect may be related to the fractional coverage, θ (Qe/Qm) where the θ values increase in the following order: NP (0.148) < HAc (0.168) < HCl (0.208) < CH (0.247) < HS (0.280).
 |
| | Fig. 7 Kinetic uptake studies of MB with the PANI materials at pH 7.00 and 295 K. | |
Conclusions
A series of water insoluble PANI nanomaterials and a chitosan supported polymer were prepared using acid catalyzed reactions. Variable yields (31% to 95%) and characterization methods (1H NMR and DRIFT spectroscopy) provided strong evidence for the PANI materials. The use of different acids and chitosan afforded PANI materials with variable structure due to changes in the relative proportion of PANI containing benzenoid vs. quinoid rings. Quinoid rings are generally formed with increasing acid strength, as evidenced by the electronic transitions (n–π* transition between the HOMO of the benzenoid ring and the LUMO of the quinoid ring), according to the UV-vis spectroscopy results. IR spectroscopy indicates the presence of phenazine-like structures for all the materials, especially NP because it has greater content when compared with bulk-PANI. TGA results indicate that the morphology of the various PANI materials differ from NP because it has greater oligomer whilst bulk-PANI possesses a granular morphology. The incorporation of PANI onto chitosan supports is confirmed by P-XRD and TGA. The equilibrium and kinetic uptake properties of the PANI materials vary considerably between NP, bulk-PANIs, and CH. NP shows the greatest uptake of MB (6-fold greater Qm) compared to related materials reported (cf. Table 3) to date. Thus, the synthetic strategy reported herein affords materials with enhanced uptake properties; however, the rate processes are attenuated with reduced fractional coverage. In the case of NP, it has the lowest rate of uptake and this may be due to competitive hydration arising from intraparticle diffusion which arises from differences between bulk and nanoparticle systems. This work has contributed to the development of PANI with diverse structural forms (NP, bulk, and CH supported materials). Further studies are underway to further examine the structure-function relationship of such materials with regard to their adsorption properties. We anticipate that the controlled synthesis of PANI in diverse structural forms will contribute to the development of unique materials for diverse applications that include optical sensors and molecular wires for electrochemical devices, among others.63,64
Acknowledgements
The authors are grateful to the University of Saskatchewan for supporting this research. MHM acknowledges the MITACS Accelerate Program and Nanostruck Technologies Inc. for PDF funding for this research.
References
- M. T. Yagub, T. K. Sen, S. Afroze and H. M. Ang, Adv. Colloid Interface Sci., 2014, 209, 172–184 CrossRef CAS PubMed.
- M. A. M. Salleh, D. K. Mahmoud, W. A. W. A. Karim and A. Idris, Desalination, 2011, 280, 1–13 CrossRef CAS PubMed.
- P. Sharma, N. Hussain, D. J. Borah and M. R. Das, J. Chem. Eng. Data, 2013, 58, 3477–3488 CrossRef CAS.
- M. M. Ayad and A. A. El-Nasr, J. Phys. Chem. C, 2010, 114, 14377–14383 CAS.
- H. Sun, S. Liu, S. Liu and S. Wang, Appl. Catal., B, 2014, 146, 162–168 CrossRef CAS PubMed.
- Q. Wang, S. Tian, J. Long and P. Ning, Catal. Today, 2014, 224, 41–48 CrossRef CAS PubMed.
- E. Forgacs, T. Cserháti and G. Oros, Environ. Int., 2004, 30, 953–971 CrossRef CAS PubMed.
- T. Robinson, G. McMullan, R. Marchant and P. Nigam, Bioresour. Technol., 2001, 77, 247–255 CrossRef CAS.
- K. Li, X. Luo, X. Lin, F. Qi and P. Wu, J. Mol. Catal. A: Chem., 2014, 383-384, 1–9 CrossRef CAS PubMed.
- E. S. Baeissa, J. Alloys Compd., 2014, 590, 303–308 CrossRef CAS PubMed.
- U. Iriarte-Velasco, N. Chimeno-Alanís, M. P. González-Marcos and J. I. Álvarez-Uriarte, J. Chem. Eng. Data, 2011, 56, 2100–2109 CrossRef CAS.
- L. D. Wilson, Water Conditioning & Purification International, 2014, 56, 28–33 Search PubMed.
- G. Z. Kyzas, N. K. Lazaridis and M. Kostoglou, Chem. Eng. Sci., 2012, 81, 220–230 CrossRef CAS PubMed.
- V. K. Gupta and Suhas, J. Environ. Manage., 2009, 90, 2313–2342 CrossRef CAS PubMed.
- G. Kyzas and M. Kostoglou, Materials, 2014, 7, 333–364 CrossRef CAS PubMed.
- M. J. Martin, A. Artola, M. D. Balaguer and M. Rigola, Chem. Eng. J., 2003, 94, 231–239 CrossRef CAS.
- K. Suresh Kumar Reddy, A. Al Shoaibi and C. Srinivasakannan, Environ. Technol., 2013, 35, 18–26 CrossRef.
- G. Mezohegyi, F. P. van der Zee, J. Font, A. Fortuny and A. Fabregat, J. Environ. Manage., 2012, 102, 148–164 CrossRef CAS PubMed.
- A. Demirbas, J. Hazard. Mater., 2009, 167, 1–9 CrossRef CAS PubMed.
- P. J. M. Carrott, M. M. L. R. Carrott and R. A. Roberts, Colloids Surf., 1991, 58, 385–400 CrossRef CAS.
- N. Kannan and M. M. Sundaram, Dyes Pigm., 2001, 51, 25–40 CrossRef CAS.
- J. Yener, T. Kopac, G. Dogu and T. Dogu, Chem. Eng. J., 2008, 144, 400–406 CrossRef CAS PubMed.
- Y. Yao, F. Xu, M. Chen, Z. Xu and Z. Zhu, Bioresour. Technol., 2010, 101, 3040–3046 CrossRef CAS PubMed.
- M. A. Rauf and S. Salman Ashraf, Chem. Eng. J., 2012, 209, 520–530 CrossRef CAS PubMed.
- V. C. Srivastava, I. D. Mall and I. M. Mishra, Chem. Eng. J., 2007, 132, 267–278 CrossRef CAS PubMed.
- D. Li, J. Huang and R. B. Kaner, Acc. Chem. Res., 2008, 42, 135–145 CrossRef PubMed.
- D. Passeri, A. Biagioni, M. Rossi, E. Tamburri and M. L. Terranova, Eur. Polym. J., 2013, 49, 991–998 CrossRef CAS PubMed.
- Y. Gao, Z.-H. Kang, X. Li, X.-J. Cui and J. Gong, CrystEngComm, 2011, 13, 3370–3372 RSC.
- Q. M. Jia, J. B. Li, L. F. Wang, J. W. Zhu and M. Zheng, Mater. Sci. Eng., A, 2007, 448, 356–360 CrossRef PubMed.
- J. Wang, J. Wang, Z. Yang, Z. Wang, F. Zhang and S. Wang, React. Funct. Polym., 2008, 68, 1435–1440 CrossRef CAS PubMed.
- G. Ćirić-Marjanović, Synth. Met., 2013, 177, 1–47 CrossRef PubMed.
- M. M. Ostwal, B. Qi, J. Pellegrino, A. G. Fadeev, I. D. Norris, T. T. Tsotsis, M. Sahimi and B. R. Mattes, Ind. Eng. Chem. Res., 2006, 45, 6021–6031 CrossRef CAS.
- J. Wang, L. Xu, C. Cheng, Y. Meng and A. Li, Chem. Eng. J., 2012, 193–194, 31–38 CrossRef CAS PubMed.
- Y. Zheng, Y. Liu and A. Wang, Ind. Eng. Chem. Res., 2012, 51, 10079–10087 CrossRef CAS.
- M. A. Salem, React. Funct. Polym., 2010, 70, 707–714 CrossRef CAS PubMed.
- M. M. Ayad, A. Abu El-Nasr and J. Stejskal, J. Ind. Eng. Chem., 2012, 18, 1964–1969 CrossRef CAS PubMed.
- M. Ayad and S. Zaghlol, Chem. Eng. J., 2012, 204–206, 79–86 CrossRef CAS PubMed.
- A. N. Chowdhury, S. R. Jesmeen and M. M. Hossain, Polym. Adv. Technol., 2004, 15, 633–638 CrossRef CAS.
- M. Ayad, G. El-Hefnawy and S. Zaghlol, Chem. Eng. J., 2013, 217, 460–465 CrossRef CAS PubMed.
- I. Langmuir, J. Am. Chem. Soc., 1918, 40, 1361–1402 CrossRef CAS.
- H. M. F. Freundlich, J. Phys. Chem. A, 1906, 57, 385–470 CAS.
- R. Sips, J. Chem. Phys., 1948, 16, 490–495 CrossRef CAS PubMed.
- S. Lagergren, K. Sven. Vetenskapsakad. Handl., 1898, 24, 1–39 Search PubMed.
- Y. S. Ho and G. McKay, Process Saf. Environ. Prot., 1998, 76, 183–191 CrossRef CAS.
- M. Trchová and J. Stejskal, Pure Appl. Chem., 2011, 83, 1803–1817 CrossRef.
- S. Kaplan, E. M. Conwell, A. F. Richter and A. G. MacDiarmid, J. Am. Chem. Soc., 1988, 110, 7647–7651 CrossRef CAS.
- E. T. Kang, K. G. Neoh and K. L. Tan, Prog. Polym. Sci., 1998, 23, 277–324 CrossRef CAS.
- M. Trchová, I. Šeděnková, E. N. Konyushenko, J. Stejskal, P. Holler and G. Ćirić-Marjanović, J. Phys. Chem. B, 2006, 110, 9461–9468 CrossRef PubMed.
- E. C. Venancio, P.-C. Wang and A. G. MacDiarmid, Synth. Met., 2006, 156, 357–369 CrossRef CAS PubMed.
- X. Wang, T. Sun, C. Wang, C. Wang, W. Zhang and Y. Wei, Macromol. Chem. Phys., 2010, 211, 1814–1819 CrossRef CAS.
- W. Luzny and M. Sniechowski, Fibres Text. East. Eur., 2003, 11, 75–79 Search PubMed.
- C. Su, G. Wang, F. Huang and X. Li, J. Mater. Sci., 2008, 43, 197–202 CrossRef CAS PubMed.
- C. Dhand, M. Das, G. Sumana, A. K. Srivastava, M. K. Pandey, C. G. Kim, M. Datta and B. D. Malhotra, Nanoscale, 2010, 2, 747–754 RSC.
- A. R. Hopkins, R. A. Lipeles and S.-J. Hwang, Synth. Met., 2008, 158, 594–601 CrossRef CAS PubMed.
- D. K. Bandgar, G. D. Khuspe, R. C. Pawar, C. S. Lee and V. B. Patil, Appl. Nanosci., 2014, 4, 27–36 CrossRef CAS PubMed.
- I. Arafa, H. El-Ghanem and K. Bani-Doumi, J. Inorg. Organomet. Polym. Mater., 2013, 23, 365–372 CrossRef CAS PubMed.
- G. D. Khuspe, S. T. Navale, D. K. Bandgar, R. D. Sakhare, M. A. Chougule and V. B. Patil, Electron. Mater. Lett., 2014, 10, 191–197 CrossRef CAS PubMed.
- R. S. Biscaro, M. C. Rezende and R. Faez, Polym. Adv. Technol., 2009, 20, 28–34 CrossRef CAS.
- T. Thanpitcha, A. Sirivat, A. Jamieson and R. Rujiravanit, J. Nanopart. Res., 2009, 11, 1167–1177 CrossRef CAS.
- L.-M. Huang, W.-R. Tang and T.-C. Wen, J. Power Sources, 2007, 164, 519–526 CrossRef CAS PubMed.
- G. Zhang and F. Yang, Phys. Chem. Chem. Phys., 2011, 13, 3291–3302 RSC.
- Z. D. Zujovic, M. Gizdavic-Nikolaidis and G. A. Bowmaker, Chem. N. Z., 2013, 77, 87–91 CAS.
- F. Gu, X. Yin, H. Yu, P. Wang and L. Tong, Opt. Express, 2009, 17(13), 11230–11235 CrossRef CAS.
- M. Grigoras and L. Stafie, Supramol. Chem., 2010, 22(4), 237–248 CrossRef CAS , and references cited therein.
|
| This journal is © The Royal Society of Chemistry 2015 |
Click here to see how this site uses Cookies. View our privacy policy here.