Polyelectrolyte assembled graphene oxide coated silica composite as sorbent for solid-phase extraction of cinnamic acid and its derivatives
Houmei Liuab,
Xiaojing Lianga,
Xusheng Wanga,
Yong Guo*a and
Xia Liu*a
aKey Laboratory of Chemistry of Northwestern Plant Resources and Key Laboratory for Natural Medicine of Gansu Province, Lanzhou Institute of Chemical Physics, Chinese Academy of Sciences, Lanzhou 730000, China. E-mail: gsliuxia@lzb.ac.cn; guoyong@licp.cas.cn; Fax: +86 931 8277088; Tel: +86 931 4968203
bUniversity of Chinese Academy of Sciences, Chinese Academy of Sciences, Beijing 100049, China
First published on 9th December 2014
Abstract
In this paper, a novel sorbent, poly(diallyldimethylammonium chloride) assembled graphene oxide coated silica (PDDA@GO@SiO2), was prepared and used as a sorbent for solid-phase extraction of cinnamic acid and its derivatives. The synthesized sorbent material was characterized by elemental analysis and field emission scanning electron microscopy, which confirmed the success of binding and assembling. The extraction properties of the resultant sorbent were evaluated by using cinnamic acid and its derivatives (caffeic acid, trans-4-hydroxycinnamic acid, isoferulic acid, 3,4-dimethoxycinnamic acid, cinnamic acid and 4-methylcinnamic acid) as the test analytes. Extraction efficiencies of PDDA@GO@SiO2 were apparently superior to those of PDDA@SiO2 and commercial C18 sorbents. Under the optimal conditions, good linearities with R2 ranging from 99.8% to 100% were obtained and the LODs and LOQs were found to be in the range of 0.5–2 μg L−1 and 3–5 μg L−1, respectively. The proposed method was successfully applied for the analysis of cinnamic acid in Gobi sherry and isoferulic acid in BuzhongYiqi pill.
1. Introduction
Cinnamic acid and its derivatives are active ingredients existing in many Chinese herbal medicines. Research shows that these organic acids possess excellent therapeutic effects. For example, fumalic acid and isoferulic acid are active ingredients in rhizoma Cimicifugae, which have clearing-heat and detoxifying effects.1–3 Caffeic acid and trans-4-hydroxycinnamic belong to phenolic acid compounds and they have antioxidant, antibacterial and antiviral effects.4–7 Cinnamic acid is an effective constituent found in Cinnamomum cassia and it is widely known because of its antisepsis, antiphlogosis and antioxygenation.8 Nowadays, cinnamic acid and its derivatives have been widely used in pharmaceutical products and food additives.Solid-phase extraction (SPE), as a powerful sample preparation technique, has been developed and widely used because of its many strengths, such as high recovery, high enrichment factor, short extraction time, low consumption of reagents and minimal cost.9–11 Selection of sorbent material is critical in SPE, determining the selectivity and sensitivity of the method. Currently, some of sorbents have been developed and applied, such as C18 silica,12 polymeric sorbents,13 and polyurethane foam.14 However, the applications of these sorbents mentioned above are often limited to a number of analytes and they are not suitable for the extraction of analytes with moderate and strong polarity and even charged species.10,15 Thus, to effectively extract cinnamic acid and its derivatives, the development of sorbent is a key part.
Poly(diallyldimethylammonium chloride) (abbreviated as PDDA), as one of cationic polyelectrolyte agents, has been widely used in many fields.16–24 One of the features of PDDA is that it carries strong positive charge, which leads to the generation of strong electrostatic attractions between the adsorbent and acidic compounds. Originally, we prepared composite of PDDA wrapping pure silica (abbreviated as PDDA@SiO2). However, in our experiment process, we found that PDDA had been losing and the 5 μm pore size polyethylene frits in cartridges were often been blocked up by the lost PDDA from the surface of silica during SPE procedure. The occurrence of this problem resulted in the decrease of extraction capacity of PDDA@SiO2.
In order to solve the issue mentioned above, we put forward bringing graphene oxide (GO) to the construction of sorbent material. GO is an oxidized derivative of graphene (G). G has many beneficial properties, including large specific surface area, large delocalized π-electron system, and soft and flexible physical property.25–28 Besides the excellent properties of G mentioned above, GO has other attracting features. Due to the existing of various oxygen-containing groups (hydroxy, carboxyl, epoxy, carbonyl, etc.), GO is strongly hydrophilic and has more reactive groups.29,30 Because of the flexible physical property and rich of reactive groups, GO can easily be attached onto the surface of silica. So, when the composite of GO modified silica (GO@SiO2) was formed, PDDA was assembled to. Then the composite of PDDA assembled to GO@SiO2 (PDDA@GO@SiO2) was developed. The positively charged PDDA can generate strong electrostatic and π-stacking interactions with GO. So, PDDA will be stable on the surface of GO@SiO2 substrate.
In this work, a novel PDDA@GO@SiO2 composite was prepared and used as the SPE sorbent. PDDA@SiO2 was also evaluated. Meanwhile, we compared the extraction capacities of both PDDA@GO@SiO2 and commercial C18 sorbent. Caffeic acid (CafA), trans-4-hydroxycinnamic acid (ThcA), isoferulic acid (IsfA), 3,4-dimethoxycinnamic acid (DmcA), cinnamic acid (CinA) and 4-methylcinnamic acid (MecA) were selected as the model analytes to evaluate the adsorption capacities of sorbents. The main parameters, such as volume of sample loading, pH of loading sample, sample loading velocity, type of eluent, pH of eluent and volume of eluent, were investigated in detail. Under the optimal conditions, the proposed method for PDDA@GO@SiO2 was set up and employed for the analysis of cinnamic acid in Gobi sherry and isoferulic acid in BuzhongYiqi pill.
2. Experimental
2.1. Chemicals and materials
Poly(diallydimethylammonium chloride) (PDDA) was purchased from Tianjin Heowns Biochem LLC (Tianjin, China) and its average Mw is 100![[thin space (1/6-em)]](https://www.rsc.org/images/entities/char_2009.gif) 000–200
000–200![[thin space (1/6-em)]](https://www.rsc.org/images/entities/char_2009.gif) 000. The purchased PDDA solution was 20 wt% in H2O. (3-Aminopropyl)triethoxysilane (APTES), N,N-dimethylformamide (DMF) and N,N-dicyclohexylcarbodie (DCC) were purchased from the Aladdin Chemical Reagent Co. (Shanghai, China). GO was purchased from Nanoon Co. (Beijing, China). Porous silica particles were synthesized using the polymerization-induced colloid aggregation method in our laboratory with an average diameter of 15 μm, a pore size of 16 nm and a surface area of 150 m2 g−1.31 The real sample of Gobi sherry was produced by Gansu ZiXuan wine industry (Gansu, China) and BuzhongYiqi pill (Gansu, China) was produced by Gansu FoCi pharmaceutical Co. Ltd.
000. The purchased PDDA solution was 20 wt% in H2O. (3-Aminopropyl)triethoxysilane (APTES), N,N-dimethylformamide (DMF) and N,N-dicyclohexylcarbodie (DCC) were purchased from the Aladdin Chemical Reagent Co. (Shanghai, China). GO was purchased from Nanoon Co. (Beijing, China). Porous silica particles were synthesized using the polymerization-induced colloid aggregation method in our laboratory with an average diameter of 15 μm, a pore size of 16 nm and a surface area of 150 m2 g−1.31 The real sample of Gobi sherry was produced by Gansu ZiXuan wine industry (Gansu, China) and BuzhongYiqi pill (Gansu, China) was produced by Gansu FoCi pharmaceutical Co. Ltd.
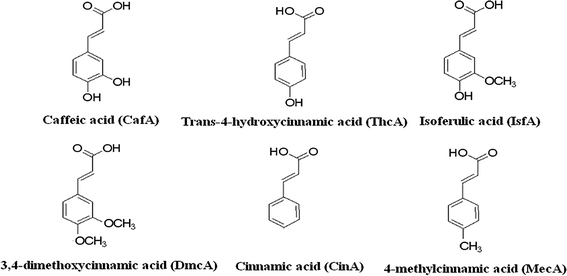
All other reagents were of analytical-grade. Caffeic acid (CafA), trans-4-hydroxycinnamic acid (ThcA), isoferulic acid (IsfA), 3,4-dimethoxycinnamic acid (DmcA), cinnamic acid (CinA) and 4-methylcinnamic acid (MecA) were selected to evaluate the sorbent and were purchased from the Aladdin Chemical Reagent Co. (Shanghai, China). The structures of the six analytes are shown in Fig. 1. SPE cartridges (3 mL) and polyethylene frits (5 μm pore size) were purchased from Shenzhen Biocomma Biotech Corp. (Shenzhen, China). Welchrom® C18 SPE cartridges (200 mg, 3 mL) were purchased from Welch Materials, Inc. (Tianjin, China).
2.2. Instruments
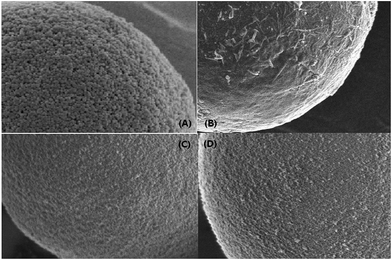
The elemental analysis of aminopropylated silica, GO@SiO2, PDDA@SiO2 and PDDA@GO@SiO2 were performed on a Vario EL (Elementar, Germany). The surface morphologies of SiO2 and GO@SiO2 were examined on a TF20 scanning electron microscope (SEM) (FEI, U.S.A). All chromatographic tests were performed on an Agilent 1100 Series modular HPLC system with a UV-Vis detector (Agilent Technologies, U.S.A). The SPE procedure was performed on a HGC-8 numerical control solid phase extraction system (Hegong Scientific Instrument Corp., Shanghai, China).2.3. Preparation of PDDA@SiO2 and PDDA@GO@SiO2 sorbents
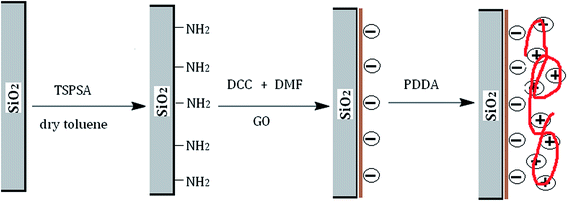
Silica particles were first activated in concentrated hydrochloric acid (12 mol L−1) for 24 h and then repeatedly rinsed with deionized water until the pH of deionized water was neutral. Five grams of 20 wt% PDDA stock solution was diluted to 100 g with distilled water. Then 5 g activated silicas was added into the diluted PDDA solution and dispersed by ultrasonication. The suspension was continuously stirred for 5 h at room temperature to form PDDA@SiO2. Afterwards, PDDA@SiO2 was washed with deionized water to remove excess PDDA and dried under vacuum for 12 h at 60 °C.The activated silicas (10.0 g) and an excess of APTES (10.0 mL) were suspended in 150 mL of dry toluene. The suspension was mechanically stirred and refluxed for 24 h at 120 °C. Subsequently, the aminopropylated modified silica was washed with toluene, ethanol and methanol in turn. After that, GO (0.10 g) was added to 100 mL of DMF under 2 hours ultrasonic treatment. When GO was well dispersed, Ten grams of dried aminopropylated silica particles and 0.08 g of DCC were added. Then the mixture was stirred at 30 °C for 24 h for the bonding of GO (GO@SiO2). Ten grams of 20 wt% PDDA stock solution was diluted to 200 g with distilled water. Then 10 g GO@SiO2 was added into the diluted PDDA solution and dispersed by ultrasonication. The suspension was continuously stirred for 5 h at room temperature to form PDDA@GO@SiO2. Afterwards, PDDA@GO@SiO2 was washed with deionized water to remove excess PDDA and dried under vacuum for 12 h at 60 °C.
A schematic diagram of the synthesis approach for the preparation of PDDA@GO@SiO2 is outlined in Fig. 2. In the diagram, electrical property of GO is denoted by negative charges. Similarly, electrical property of PDDA is electropositivity and denoted by positive charges.
2.4. Preparation of sample solutions
The stock solutions of six cinnamic acid and its derivatives were all prepared in methanol at a concentration of 1 mg mL−1 and stored at 4 °C. For the optimization of extraction parameters, working solutions at a concentration of 100 ng mL−1 were prepared by diluting the stock solutions with deionized water.2.5. Chromatographic conditions
The analytical ODS column (150 mm × 4.6 mm I.D., 5 μm) was packed using the commercial octadecyl-silylated silica purchased from FuShi Corp. (Japan). Mobile phase was composed of 0.2% H3PO4 aqueous (A) and methanol (B). The mobile phase employed the gradient elution: 0–7 min 40% B; 7–12 min 40–50% B; 12–13 min 50–60% B. The flow rate was 1.0 mL min−1 and the column temperature was maintained at 25 °C. The UV-Vis detector wavelength was 300 nm. The injection volume was 20 μL.2.6. Solid-phase extraction procedure
Fifty milligrams of the dried PDDA@GO@SiO2 sorbents were packed into empty 3 mL SPE cartridges between two 5 μm polyethylene frits. The sorbents were first conditioned with 5 mL of methanol and 5 mL of water. Then, 50 mL of working solution at a concentration of 100 ng mL−1 was loaded onto the sorbent at a flow rate of 2 mL min−1. Then air was used to dry the sorbent for 5 minutes. The retained analytes were eluted with 1 mL of methanol and water mixture (2![[thin space (1/6-em)]](https://www.rsc.org/images/entities/char_2009.gif) :
:![[thin space (1/6-em)]](https://www.rsc.org/images/entities/char_2009.gif) 1) at pH 1.4 adjusted by HCl. The desorption solution was collected for the HPLC analysis. In this work, the study was repeated three times and the final data were all average values.
1) at pH 1.4 adjusted by HCl. The desorption solution was collected for the HPLC analysis. In this work, the study was repeated three times and the final data were all average values.
During the assessment process of PDDA@SiO2 sorbent and commercial C18 sorbent, all experiment parameters are the same as those of PDDA@GO@SiO2 sorbent.
2.7. Analysis of real samples (Gobi sherry and BuzhongYiqi pill)
The Gobi sherry was purchased from the local supermarket in Lanzhou, China. 50 mL of Gobi sherry was directly loaded with no any pretreatment process.When BuzhongYiqi pill was analyzed, the pretreatment process was necessary. One gram pills was weighted and ground into powder. Then the 1 g pill powder was dissolved into 500 mL methanol and water mixture (30![[thin space (1/6-em)]](https://www.rsc.org/images/entities/char_2009.gif) :
:![[thin space (1/6-em)]](https://www.rsc.org/images/entities/char_2009.gif) 70, v/v). Afterwards, the solution was filtered through a 0.45 μm nylon membranes before the SPE procedure.
70, v/v). Afterwards, the solution was filtered through a 0.45 μm nylon membranes before the SPE procedure.
3. Results and discussion
3.1. Characterization of the polyelectrolyte modified graphene oxide coated silica sorbent
| Different particles | Elemental analysis data | ||
|---|---|---|---|
| C (%) | N (%) | H (%) | |
| Aminopropylated silica | 2.46 (0.13) | 1.21 (0.24) | 1.13 (0.22) |
| GO@SiO2 | 3.62 (0.20) | 0.87 (0.11) | 1.24 (0.14) |
| PDDA@GO@SiO2 | 9.06 (0.41) | 1.47 (0.32) | 1.55 (0.30) |
| PDDA@SiO2 | 4.85 (0.22) | 0.52 (0.06) | 1.04 (0.24) |
3.2. Optimization of SPE parameters of PDDA@GO@SiO2
As for the six analytes, the pKa is in the range of 3.0–4.5. So, when the pH of the loading sample is greater than 4.5, analytes exist as anions and are expected to be retained on the cationic surface of PDDA@GO@SiO2 composite via electrostatic interactions. From Fig. 5, it can be seen that the recoveries maintained high level over a wide pH range. However, the recoveries were not satisfactory at low and high pH. This phenomenon is attributed to that when pH is low, part of analytes exist as molecular form; when pH is high, there are lots of dissociative hydroxyl ions, which can occupy part of the sites on the surface of PDDA@GO@SiO2 composite. The two main reasons mentioned above lead to the low recoveries at low and high pH. As can be seen in Fig. 5, when pH was 6.0 and 6.6, the performance were almostly the same and satisfactory. At last, pH 6.6 was used in the subsequent study.
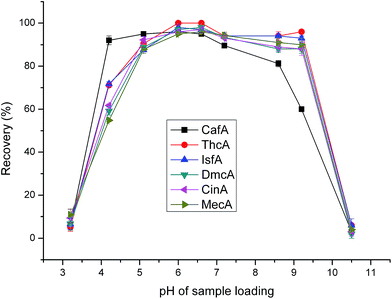 | ||
| Fig. 5 Effect of loading sample pH on extraction efficiency. Sample loading volume is 50 mL. Other parameters are the same as in Fig. 4. | ||
To investigate the effect of sample loading velocity, we tested 1.0 mL min−1, 1.5 mL min−1, 2.0 mL min−1, 2.5 mL min−1, 3.0 mL min−1, respectively. As shown in Fig. 6, when the sample loading velocity was less than 2 mL min−1, the recoveries have no apparent change and all maintained satisfactory levels. While, when the velocity increased from 2.0 to 2.5 mL min−1, the recoveries decreased dramatically. The reason is that when the velocity of sample loading is too fast, the analytes can not make full contact with the sorbents, leading to poor extractions. When we try our best to increase the analysis speed, meantime we must guarantee the recoveries. Overall consideration, 2.0 mL min−1 was chosen as the optimal sample loading velocity.
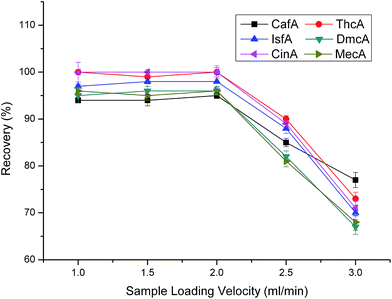 | ||
| Fig. 6 Effect of sample loading velocity on extraction efficiency. Sample loading volume is 50 mL. Other parameters are the same as in Fig. 4. | ||
![[thin space (1/6-em)]](https://www.rsc.org/images/entities/char_2009.gif) :
:![[thin space (1/6-em)]](https://www.rsc.org/images/entities/char_2009.gif) 1 the recoveries were the highest. Meantime, we can notice that when the volume ration of methanol and water ranged from 0
1 the recoveries were the highest. Meantime, we can notice that when the volume ration of methanol and water ranged from 0![[thin space (1/6-em)]](https://www.rsc.org/images/entities/char_2009.gif) :
:![[thin space (1/6-em)]](https://www.rsc.org/images/entities/char_2009.gif) 1 to 3
1 to 3![[thin space (1/6-em)]](https://www.rsc.org/images/entities/char_2009.gif) :
:![[thin space (1/6-em)]](https://www.rsc.org/images/entities/char_2009.gif) 1, the recoveries all maintain relatively high levels. However, when the eluent was 100% methanol, the performance was rather poor. We can attribute the phenomenon to that there is a small amount of hydrogen protons in the pure methanol which was not favour of the ion exchange leading to the poor elution ability.
1, the recoveries all maintain relatively high levels. However, when the eluent was 100% methanol, the performance was rather poor. We can attribute the phenomenon to that there is a small amount of hydrogen protons in the pure methanol which was not favour of the ion exchange leading to the poor elution ability.
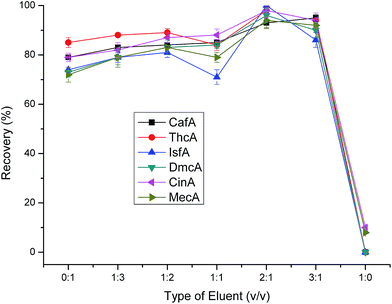 | ||
| Fig. 7 Effect of eluent type on extraction efficiency. Sample loading volume is 50 mL. Other parameters are the same as in Fig. 4. | ||
The pH of eluent is a very important factor affecting the performance of elution. When the pH of eluent changes, the elution power always differs, especially for ionization compounds. We tested the pH ranging from 1.4 to 2.7. From Fig. 8, it showed that the recoveries decreased with the pH increasing. The six anionic analytes were retained on cationic surface of the sorbents via electrostatic interactions. When the eluent of low pH through the sorbent, the target analytes will transform from ionic form to molecular form, which will weaken the electrostatic interactions between analytes and sorbents. Although the recoveries had no big differences at pH 1.4 and 1.6, we select pH 1.4 as the final one based on the optimal principle.
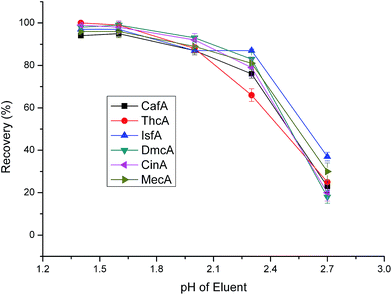 | ||
| Fig. 8 Effect of eluent pH on extraction efficiency. Sample loading volume is 50 mL. Other parameters are the same as in Fig. 4. | ||
After determining the type of eluent and optimal pH, the volume of eluent was investigated. In this work, four volumes of 0.5 mL, 1.0 mL, 1.5 mL and 2.0 mL were tested. From Fig. 9, we can know that when the volume was greater than 1.0 mL the recoveries had no apparent difference and all maintained high levels. The optimal volume of eluent, on one hand, should be sufficient enough to elute all the analytes from the sorbent. On the other hand, it should be as small as possible to increase the enrichment factor. Overall consideration, 1 mL is optimal volume of eluent.
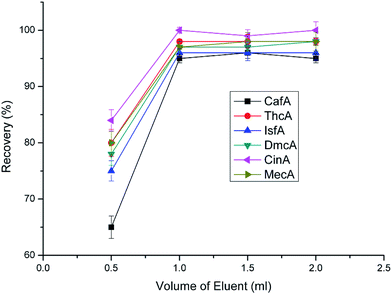 | ||
| Fig. 9 Effect of eluent volume on extraction efficiency. Sample loading volume is 50 mL. Other parameters are the same as in Fig. 4. | ||
3.3. SPE performance of PDDA@SiO2
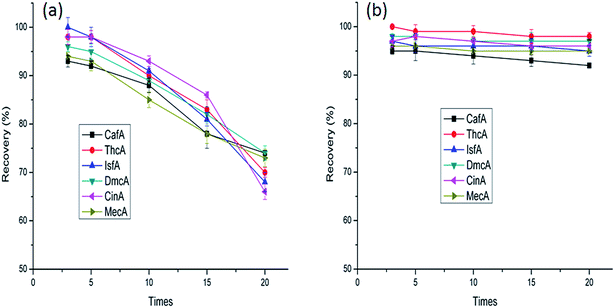
The reproducibility tests of PDDA@GO@SiO2 and PDDA@SiO2 were conducted under the same SPE conditions. From the results shown in Fig. 10, PDDA@GO@SiO2 has excellent repeatability. However, the reproducibility of PDDA@SiO2 was disappointed. With the increase of repeat time, the recoveries were getting worse. The occurrence of this phenomenon was ascribed to the loss of PDDA on the surface of SiO2. The force between PDDA and SiO2 was not strong. During the SPE process, the water-soluble PDDA was lost. To verify our guess, carbon contents analysis of PDDA@SiO2 and PDDA@GO@SiO2 according to different recyclable performance were conducted. From the results shown in Table 2, they clearly show that the PDDA was indeed losing during the extraction process. Consequently, the occurrence of this phenomenon stated that PDDA@SiO2 was not suitable for the SPE experiment. Meanwhile, it showed the GO was indispensable part.| Different particles | C% according to the different recyclable performance | ||
|---|---|---|---|
| 3 | 10 | 20 | |
| PDDA@SiO2 | 4.21 (0.21) | 3.57 (0.32) | 2.39 (0.13) |
| PDDA@GO@SiO2 | 9.04 (0.33) | 8.97 (0.41) | 8.88 (0.26) |
3.4. Comparison with commercial C18 sorbents
The comparison between Welchrom® C18 and PDDA@GO@SiO2 was conducted at concentrations of 50 and 100 μg L−1. The results are shown in Table 3 with mean percentage recoveries and RSD values. The results apparently showed that the commercial C18 SPE sorbent was not suitable for the extraction of the six analytes, especially for CafA, ThcA and IsfA. The low recoveries (3.2–55.7%) of C18 sorbent at both concentrations were disappointed. However, the recoveries (93.4–100.3%) of PDDA@GO@SiO2 all maintained high levels.| Analytes | Welchrom® C18 | PDDA@GO@SiO2 | ||
|---|---|---|---|---|
| Spiking (μg L−1) | Spiking (μg L−1) | |||
| 50 | 100 | 50 | 100 | |
| CafA | 7.0 (1.3) | 8.4 (2.3) | 93.4 (1.6) | 95.1 (2.5) |
| ThcA | 5.5 (0.6) | 6.0 (2.6) | 98.6 (2.2) | 94.7 (2.7) |
| IsfA | 3.4 (1.1) | 3.2 (1.2) | 100.3 (2.6) | 99.4 (1.8) |
| DmcA | 42.7 (2.1) | 33.4 (3.1) | 96.8 (1.7) | 97.3 (3.5) |
| CinA | 52.2 (3.6) | 50.6 (2.7) | 98.1 (3.3) | 94.4 (2.9) |
| MecA | 55.7 (2.5) | 54.5 (2.4) | 94.6 (2.4) | 93.8 (2.4) |
3.5. Method validation for PDDA@GO@SiO2
Method validation such as linearity, correlation coefficients, LODs and LOQs were investigated. The results in Table 4 show that good linearities are obtained in the range of 5–100 μg L−1 for CafA and 3–100 μg L−1 for the other analytes with correlation coefficients better than 99.8%. LODs (S/N = 3) are 0.5 μg L−1 for CinA and MecA, 1 μg L−1 for ThcA, IsfA and DmcA, and 2 μg L−1 for CafA. LOQs (S/N = 10) were 5 μg L−1 for CafA, and 3 μg L−1 for other five analytes.| QAs | Linear range (μg L−1) | R2 | LOD (μg L−1) | LOQ (μg L−1) |
|---|---|---|---|---|
| CafA | 5–100 | 0.999 | 2 | 5 |
| ThcA | 3–100 | 0.999 | 1 | 3 |
| IsfA | 3–100 | 1 | 1 | 3 |
| DmcA | 3–100 | 0.998 | 1 | 3 |
| CinA | 3–100 | 0.999 | 0.5 | 3 |
| MecA | 3–100 | 0.998 | 0.5 | 3 |
3.6. Application to real samples
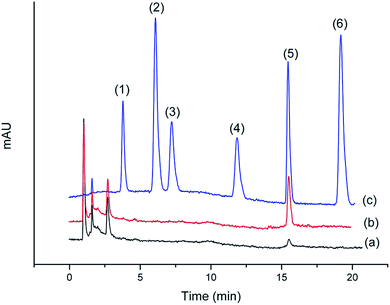
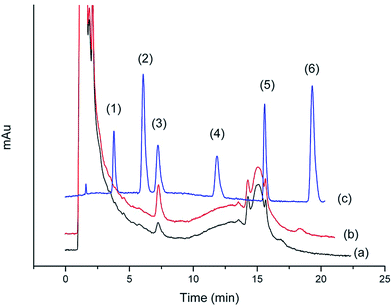
To assess the applicability of the proposed method for the quantitative analysis of the six cinnamic acid and its derivatives in real samples, the proposed technique was employed for Gobi sherry and BuzhongYiqi pill.Chromatograms shown in Fig. 11 and 12 were obtained from the Gobi sherry sample and BuzhongYiqi pill, respectively. As can been seen in Fig. 11 and 12, CinA was detected from Gobi sherry sample, and IsfA from BuzhongYiqi pill was quantified at 9.74 μg L−1. As shown in Table 5, the recoveries of CinA and IsfA were 92.3% and 89.6%, respectively. The results of our study demonstrated the suitability of the proposed method for the practical applications.
| Real samples | Compounds | Contents (μg L−1) | Recovery for standard addition (n = 3, %) |
|---|---|---|---|
| Gobi sherry | CinA | Detected but not quantified | 92.3 ± 2.5 |
| BuzhongYiqi pill | IsfA | 9.47 ± 0.4 | 89.6 ± 4.3 |
4. Conclusions
In this paper, a novel PDDA@GO@SiO2 material was prepared and applied as the sorbent for solid phase extraction of six cinnamic acid and its derivatives. The newly developed sorbent shows excellent capability for the extraction of the six target analytes (enrichment factor = 50), which is mainly attributed to the electrostatic interactions between the sorbent and analytes. Extraction performance of PDDA@GO@SiO2 was apparently superior to those of PDDA@SiO2 and commercial C18 sorbents. Through a series of optimization studies, the main parameters having great impact on extraction performance were set up. The developed SPE-HPLC-DAD method was successfully applied to determine cinnamic acid and its derivatives in Gobi sherry and BuzhongYiqi pill and satisfactory results were obtained. Consequently, the developed sorbent material has a certain practicability and operability.Acknowledgements
Financial supports from the National Natural Science Foundation of China (21105107, 21175143, 21475143) are gratefully acknowledged.References
- Y. L. Pan and D. H. Chen, Chin. J. Pharm. Anal., 2000, 20, 396–398 Search PubMed.
- Y. Liu and X. Q. Zhang, Chin. Herb. Med., 2005, 36, 1402–1404 CAS.
- T. Zhang, Drug Stand. China, 2002, 3, 41–42 Search PubMed.
- M. M. Saha, U. K. Mallik and A. K. Mallik, Phytochemistry, 1991, 30, 3834–3836 CrossRef CAS.
- S. C. Barber, A. Higginbottom, R. J. Mead, S. Barber and P. J. Shaw, Free Radical Biol. Med., 2009, 46, 1127–1138 CrossRef CAS PubMed.
- M. K. Moon, Y. J. Lee, J. S. Kmi, D. G. Kang and H. S. Lee, Biol. Pharm. Bull., 2009, 32, 1371–1377 CAS.
- N. R. Prasad, K. Jeyanthimala and S. Ramachandran, J. Photochem. Photobiol., B, 2009, 95, 196–203 CrossRef CAS PubMed.
- W. S. Chan, P. C. Wen and H. C. Chiang, Anticancer Res., 1995, 15, 703–705 CAS.
- Y. k. Wang, S. T. Gao, X. H. Zang, J. C. Li and J. J. Ma, Anal. Chim. Acta, 2012, 716, 112–118 CrossRef CAS PubMed.
- H. Tabani, A. R. Fakhari, A. Shahsavani, M. Behbahani, M. Salarian and A. Bagheri, J. Chromatogr. A, 2013, 1300, 227–235 CrossRef CAS PubMed.
- E. Tahmasebi and Y. Yamini, Anal. Chim. Acta, 2012, 756, 13–22 CrossRef CAS PubMed.
- P. K. Jak, S. Patel and B. K. Mishra, Talanta, 2004, 62, 1005–1028 CrossRef PubMed.
- T. P. Rao, R. S. Praven and S. Daniel, Crit. Rev. Anal. Chem., 2004, 34, 177–193 CrossRef CAS.
- V. A. Lemos, M. S. Santos, E. S. Santos, M. J. S. Santos, W. N. L. d. Santos, A. S. Souza, D. S. de Jesus, C. F. d. Virges, M. S. Carvalho, N. Oleszczuk, M. G. R. Vale, B. Welz and S. L. C. Ferreira, Spectrochim. Acta, Part B, 2007, 62, 4–12 CrossRef PubMed.
- T. T. Wang, Y. H. Chen, J. F. Ma and M. L. Chen, J. Chromatogr. A, 2013, 1308, 63–72 CrossRef CAS PubMed.
- Y. Wang, X. Wang, B. Wu, Z. Zhao, F. Yin, S. Li, X. Qin and Q. Chen, Sens. Actuators, B, 2008, 130, 809–815 CrossRef CAS PubMed.
- K. M. Manesh, H. T. Kim, P. Santhosh, A. I. Gopalan and K. P. Lee, Biosens. Bioelectron., 2008, 23, 771–779 CrossRef CAS PubMed.
- S. Wang, S. P. Jiang and X. Wang, Nanotechnology, 2008, 19, 265601–265607 CrossRef PubMed.
- Z. Du, Y. L. Yu and J. H. Wang, Macromol. Biosci., 2009, 9, 55–62 CrossRef CAS PubMed.
- Q. S. Qu, C. H. Gu, Y. Q. Shen, C. Y. Wang and X. Y. Hu, J. Chromatogr. A, 2013, 1282, 95–101 CrossRef CAS PubMed.
- B. M. Luo, X. B. Yan, S. Xu and Q. J. Xue, Electrochim. Acta, 2012, 59, 429–434 CrossRef CAS PubMed.
- B. P. Tripathi, N. C. Dubey and M. Stamm, J. Hazard. Mater., 2013, 252, 401–412 CrossRef PubMed.
- M. J. Yin, B. B. Gu, Q. Zhao, J. W. Qian, A. Zhang, Q. F. An and S. He, Anal. Bioanal. Chem., 2011, 399, 3623–3631 CrossRef CAS PubMed.
- X. X. Zhang, M. L. Chen, Y. L. Yu, T. Yang and J. H. Wang, Anal. Methods, 2011, 3, 457 RSC.
- M. D. Stoller, S. J. Park, Y. W. Zhu, J. H. An and R. S. Ruoff, Nano Lett., 2008, 8, 3498–3502 CrossRef CAS PubMed.
- M. J. Allen, V. C. Tung and R. B. Kaner, Chem. Rev., 2010, 110, 132–145 CrossRef CAS PubMed.
- D. R. Dreyer, S. Park, C. W. Bielawski and R. S. Ruoff, Chem. Soc. Rev., 2010, 39, 228–240 RSC.
- J. W. Liu, Q. Zhang, X. W. Chen and J. H. Wang, Chem.–Eur. J., 2011, 17, 4864–4870 CrossRef CAS PubMed.
- G. I. Titelman, V. Gelman, S. Bron, R. L. Khalfin, Y. Cohen and H. B. Peled, Carbon, 2005, 43, 641–649 CrossRef CAS PubMed.
- S. Park and R. S. Ruoff, Nat. Nanotechnol., 2009, 4, 217–224 CrossRef CAS PubMed.
- Z. R. Lu, Chem. Reagents, 1995, 17, 279–283 CAS.
| This journal is © The Royal Society of Chemistry 2015 |

