DOI:
10.1039/C4RA13821J
(Paper)
RSC Adv., 2015,
5, 21290-21296
Enhanced visible-light-driven photocatalytic degradation of tetracycline by Cr3+ doping SrTiO3 cubic nanoparticles†
Received
4th November 2014
, Accepted 29th January 2015
First published on 30th January 2015
Abstract
The removal of tetracyclines (TC), the extensively used antibiotics, from the environment has become an important issue. Recently, photocatalytic oxidation on the surface of semiconductors has been found to provide a good tool for the degradation of TC; however, most of these reactions are UV-light driven rather than visible-light driven. Here, Cr doping of SrTiO3 results in a large decrease in the band gap energy, making Cr3+ doped SrTiO3 (Cr-STO) an attractive material for use as a visible-light-driven photocatalyst for tetracycline (TC) degradation. The photoactivity is improved when the Cr/Sr weight ratio changes from 0.5% to 2%, and decreases when the Cr/Sr weight ratio changes from 3% to 10%. In this paper, we also explain the relationship between the doping and the photocatalytic activity. The existence of ˙OH radicals and holes was studied by the electron spin resonance (ESR) spin-trap technique and trapping experiments.
1 Introduction
Tetracyclines (TC) are well-known antibiotics that have been extensively used in human and veterinary medicine to treat and prevent bacterial infections.1 The existence of TC in environmental water may pose serious threats to the ecosystem and human health by inducing the proliferation of bacterial drug resistance. Thus, the removal of TC from the environment has already become an important issue. As far as we know, the traditional physical and chemical treatments lack adequate removal efficiency, and the new methods tend to produce more harmful byproducts from biochemical treatment methods. Fortunately, photocatalytic degradation processes can provide a good tool for the transportation and degradation of TC. In the past few years, some research on the high-efficiency photocatalytic degradation of TC by semiconductor-based (such as TiO2 and ZnO) photocatalysts has been reported;2 however, most of the photocatalysts are UV-light driven, rather than visible-light driven. Therefore, new types of visible-light driven photocatalysts with high efficiency for TC degradation are still desirable.
Strontium titanate (STO) has been regarded as one of the most promising photocatalysts for the photocatalytic degradation of organic pollutants because of its strong catalytic activity, high chemical and photochemical stability and good biological compatibility.3–6 However, STO shows activities only under ultraviolet irradiation, which accounts for only about 4% of the incoming solar energy; this limits its practical application. To overcome this defect, various approaches have been undertaken in the search for more efficient and active photocatalysts for the degradation of organic pollutants, including doping and sensitization.7–11 Element doping is a good strategy that may create impurity energy levels within the band gap of the photocatalyst that facilitate absorption in the visible-light range.12–15 The advantages of transition metal ion-doped STO is the introduction of crystal lattice defects, thus affecting the recombination of electrons and holes.16,17 The incorporation of certain metal ions can also extend the range of the wavelength of light absorbed.18–20 Recently, various cation or anion doped perovskite type compounds have been synthesized, and their corresponding activities under visible light have been investigated experimentally. It was reported that doping with metal atoms (M = Ru, Rh, Mn, Fe, Cr, Pb, and Ag) is an efficient method to improve the visible-light activity of STO.21–23 Herein, for the first time, we found that Cr-STO cubic nanoparticles can function as a visible-light-driven photocatalyst of TC degradation. To the best of our knowledge, no reports of visible-light-driven photocatalysts of TC degradation, especially using Cr-STO, have been published.
In our work, a series of Cr-STO cubic nanoparticles with different Cr/Sr weight ratios were prepared by a one-pot hydrothermal method and used as photocatalysts for the degradation of TC. The photocatalytic activity of Cr-STO for TC degradation under visible light irradiation was obviously enhanced compared to the pure STO. Additionally, elemental Cr formed chemical bonds rather than existing in the form of ions, which means the toxic element Cr became non-toxic after being doped into STO. The energy band gap can be precisely controlled from 3.2 eV to 2.55 eV by varying the Cr/Sr weight ratio from 0 to 10%. Moreover, the effects of the Cr/Sr weight ratio of the nanocomposites on the photocatalytic activity performance in TC degradation were investigated comparatively. A possible mechanism for the enhanced photocatalytic activity was also proposed, based on the obtained experimental results.
2 Experimental section
2.1 Chemicals
Titania TiO2 (P25, TiO2) was purchased from Degussa (Germany). Sr(OH)2·8H2O, KOH, Cr(NO)3·9H2O and TC were purchased from Aladdin (China). All reagents were of analytical grade and used without further purification, and deionized water was used in all experiments.
2.2 Synthesis of pure STO and Cr-STO cubic nanoparticles
Pure STO cubic nanoparticles were synthesized through a hydrothermal reaction: 0.847 g Sr(OH)2·8H2O, 0.3 g TiO2 powder and 2.1 g KOH were dissolved in 35 mL purified water. After stirring for about 30 min, the as-obtained mixture was transferred into a Teflon-lined stainless steel autoclave of 50.0 mL capacity. The hydrothermal treatment was carried out at 150 °C for 72 h in a stainless steel tank. After hydrothermal treatment, the product was naturally cooled to room temperature in the vessel and was washed with deionized water by repeated centrifugation until the pH of the supernatant liquid decreased to less than 8, and the product was dried at 60 °C in air. Cr-STO cubic nanoparticles were prepared by the same method, with the addition of an extra reagent, Cr(NO)3·9H2O, into the STO precursor liquid. The obtained samples with Cr/Sr weight ratios of 0, 0.5%, 1%, 2%, 3%, 5% and 10% were labeled as sample STO, Cr0.5, Cr1, Cr2, Cr3, Cr5 and Cr10.
2.3 Characterization
Powder X-ray diffraction (XRD) patterns were obtained on a D/MAX-2500 diffractometer (Rigaku, Japan) using a Cu Kα radiation source (λ = 1.54056 Å) at a scan rate of 7° min−1 to determine the crystal phases of the obtained samples. Transmission electron microscopy (TEM), high-resolution transmission electron microscopy (HRTEM) and HAADF-STEM mapping analyses were performed on an F20 S-TWIN electron microscope (Tecnai G2, FEI Co.), using a 200 kV accelerating voltage. The UV-vis absorption spectra of the samples were measured using a UV-vis spectrometer (Shimadzu UV-2500). X-ray photoelectron spectroscopy (XPS) data were obtained with an ESCALa-b220i-XL electron spectrometer (VGScientific, England) using 300 W Al Kα radiation. ESR experiments were conducted with a Bruker EPR ELEXSYS 500 spectrometer equipped with an in situ irradiation source (a Quanta-Ray Nd:YAG laser system with λ = 532 nm). The same quartz tube was used for all measurements to minimize errors.
2.4 Photocatalytic degradation of TC
The photocatalytic activities of Cr-STO were evaluated by the degradation of TC in aqueous solution under the visible light irradiation of a 250 W xenon lamp with a 420 nm cutoff filter. In a typical procedure, 0.1 g of pure STO or Cr-STO samples were dissolved in 100 mL of 10 mg L−1 TC solution. In order to eliminate the adsorption effect, the reactor was kept in darkness for 30 min to reach adsorption–desorption equilibrium. The photochemical reactor was irradiated with a 250 W xenon lamp, which was located at a distance of 8 cm at one side of the containing solution. During the irradiation procedure, the reaction sample was collected at 10 min intervals and centrifuged to remove photocatalyst particles. The photocatalytic degradation ratio (DR) was calculated by the following formula:| |
 | (1) |
Here, A0 is the initial absorbance of TC that had reached the adsorption–desorption equilibrium, whereas Ai is the absorbance after the sampling analysis. The concentration was analyzed by measuring the maximum absorbance at 357 nm for TC using a UV-vis spectrophotometer.
3 Results and discussion
3.1 Morphology and structure
The crystallographic structure and phase purity of the as-prepared samples were examined by X-ray powder diffraction (XRD). A typical XRD pattern recorded from the samples is shown in Fig. 1a. The XRD patterns revealed that the prepared samples maintained a STO crystalline structure (JCPDS card no. 05-0634) after Cr3+ doping (Fig. 1a). This clearly shows that Cr3+ doped into the lattice of STO did not affect the structure of STO, even at the high content of 10 wt% Cr. Fig. 1b shows a magnified image of the diffraction peaks for the (110) plane. The positions of the diffraction peaks tended to shift to higher angles after doping with Cr ions, as shown in Fig. 1b, which confirmed the incorporation of the Cr ions into the STO crystal lattice.24,25
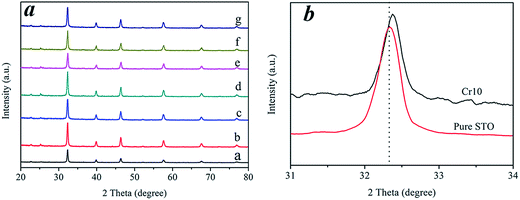 |
| | Fig. 1 (a) XRD patterns of pure STO and Cr-STO: a-pure STO, b-Cr0.5, c-Cr1, d-Cr2, e-Cr3, f-Cr5 and g-Cr10. (b) Magnified XRD patterns in the range of 2θ = 31° to 34° of STO and Cr10. | |
The morphology and size of as-synthesized Cr2 products were studied by TEM and HRTEM analyses (Fig. 2). According to the TEM images (Fig. 2a and b), it can be seen that Cr2 consists of large numbers of uniform cubic nanocrystals. The diameters of the individual cubic nanocrystals are 50 nm. HRTEM images (Fig. 2c and d) show a representative individual nanocrystal. The clear lattice fringes indicate that the obtained Cr2 nanocrystals were well-crystallized. A distinct interplanar spacing of 0.27 nm is ascribed to the (110) crystalline plane of the cubic phase of STO (JCPDS card no. 05-0634). The inset of Fig. 2d shows the fast Fourier transform (FFT) pattern related to a single particle, which clearly demonstrates that Cr2 was presented in a single-crystal phase, as shown by the separated electron diffraction spots.
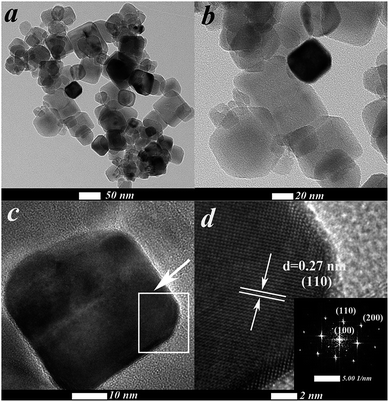 |
| | Fig. 2 (a and b) TEM images of Cr2. (c) HRTEM image and (d) magnified HRTEM image from (c). Inset in (d) shows the FFT pattern related to a single particle. | |
The high-angle annular dark-field scanning TEM (HAADF-STEM) image of the Cr2 photocatalyst is shown in Fig. 3 (left); Cr-STO cubic nanoparticles can be clearly observed, with distinct color contrast. The element distribution maps of Cr-L, Ti-L, Sr-L and O-K are also given in Fig. 3 and are well-defined, with sharp contrast. Moreover, the elemental mapping demonstrates that the Cr-L, Ti-L, Sr-L and O-K signals exhibit the same shapes within the Cr-STO sample, demonstrating the certain existence of Sr–Cr–Ti–O composite in the sample.
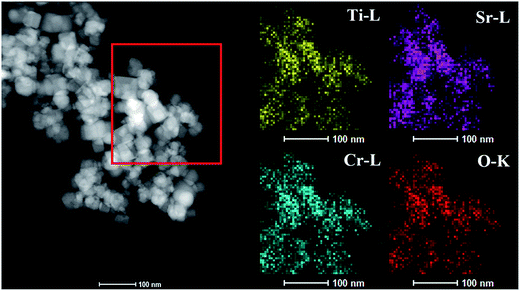 |
| | Fig. 3 HAADF-STEM image of sample Cr2 and maps of Ti-L, Sr-L, Cr-L and O-K, demonstrating the spatial distribution of Ti, Sr, Cr and O elements. | |
The valence band (VB) top of STO is raised by the occupied Cr3+ level, whereas the original conduction band (CB) bottom determined by the Ti 3d orbital is hardly affected.16 Under visible-light illumination, the photogenerated electrons on Cr-STO are photoexcited from the VB (Cr 3d) to the CB (Ti 3d). The occupied Cr3+ level is about 1.0 eV higher than the VB top formed by Ti 3d.19 Therefore, the band gap for the Cr-STO becomes smaller. In order to obtain the oxidation state of Cr, we carried out XPS measurements (Fig. 4). In the Cr 2p spectrum of Cr-STO (Fig. 4b), only one sharp peak is observed at 575.57 eV, which could be assigned to Cr3+. No other XPS peaks, for example, Cr6+ (580.2 eV), were observed. These results clearly show that Cr3+ ions were successfully incorporated into the lattice of STO.
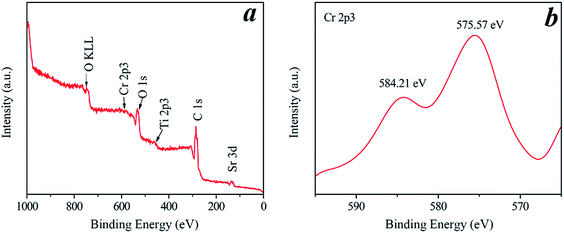 |
| | Fig. 4 Full range XPS spectrum (a) and the high-resolution XPS spectrum of Cr 2p3 (b) of the Cr2 sample. | |
3.2 UV-vis absorption spectra
As shown in the UV-vis absorption spectra (Fig. 5) of all samples, pure STO has an absorption edge at about 400 nm, which corresponds to the UV light region. After Cr3+ doping, the visible-light-responses of Cr3+ doped STO samples were largely enhanced, with red-shifted light absorptions. Particularly, the absorption intensity at around 420 nm was dramatically enhanced after Cr3+ doping. The energy band gap (Eg) was calculated using the following relation26–29| |
 | (2) |
where A and n are constant, and n is equal to 1/2 for direct band gap semiconductors. The estimated band gaps from the plots of (αhν)2 versus hν are shown in Fig. 5b and Table 1, from which we can find that the energy band gap decreased from 3.2 eV to 2.55 eV as the Cr3+ doping amount increased from 0 to 10%. After doping, the Cr 3d levels are inserted into the original band gap of STO, which induces an obvious absorption in the visible-light region.19
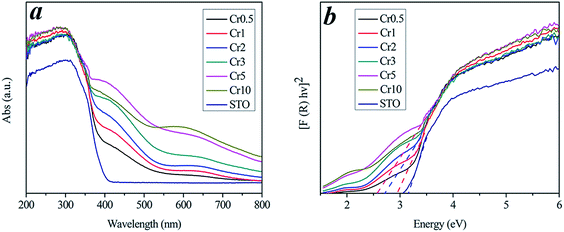 |
| | Fig. 5 (a) UV-vis absorption spectra, (b) calculated direct band gap energies of different pure STO and Cr-STO samples. | |
Table 1 Information for all samples used in experiments, including calculated direct band gap energies, degradation ratios and apparent rate constant values
| Samples |
STO |
Cr0.5 |
Cr1 |
Cr2 |
Cr3 |
Cr5 |
Cr10 |
| Eg (eV) |
3.20 |
3.00 |
2.91 |
2.71 |
2.65 |
2.55 |
2.65 |
| DRs |
6% |
55% |
65% |
68% |
55% |
50% |
39% |
| Kapp (min−1) |
— |
0.0117 |
0.01412 |
0.01607 |
0.01397 |
0.01135 |
0.00843 |
3.3 Photocatalytic degradation of TC
The photocatalytic degradation experiments were conducted under visible light (λ > 420 nm). In our case, we found the as-prepared Cr-STO cubic nanoparticles had extraordinary visible-light-driven photocatalytic activity for the degradation of TC. As a contrast to the experiments on the catalytic activity of the Cr-STO cubic nanoparticles, experiments with pure STO cubic nanoparticles under visible light irradiation were carried out. Fig. 6a displays the time-resolved UV-vis spectra during the photodegradation of TC mediated by the Cr2 sample under visible light illumination (λ > 420 nm). A rapid decrease of TC absorption at the wavelength of 357 nm was observed, accompanied with an absorption band shift to a shorter wavelength, indicating the degradation of TC. As can be seen from the above spectra, the absorption of the Cr2 suspension gradually decreased during photodegradation. For comparison, a degradation test of TC solution without photocatalyst under visible light was conducted. The result, shown in Fig. 6b, indicates that there is almost no degradation. In addition, the major absorption peak corresponding to TC shifted from 357 to 350 nm step by step, indicating the removal of benzene functional groups one by one. The sharp decrease and shift of the major absorption band within 60 min indicates that the Cr2 sample exhibits excellent photocatalytic activity for the degradation of TC due to its suitable VB, which is made up predominately of the Cr 3d state.
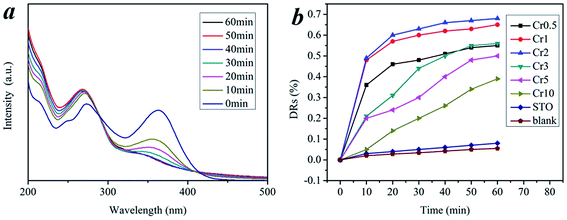 |
| | Fig. 6 (a) Temporal evolution of the spectra during the photodegradation of TC mediated by Cr2 under visible light. (b) Degradation ratios of different samples in 60 min. | |
The corresponding plots for the concentration changes of TC, determined from its characteristic absorption peak (at 357 nm), are shown in Fig. 6b, and the degradation ratios of all samples are listed in Table 1. Cr2 shows the maximum activity for photocatalytic TC degradation. In detail, the photocatalytic activity shows an upward trend from the Cr0.5 to the Cr2 sample. As the doping amount increased, the photocatalytic activity presented a downward trend for subsequent samples. Nevertheless, all the Cr-STO composites showed better photocatalytic activity than the pure STO. In spite of the narrower band gaps, the photocatalytic activities for the degradation of TC by samples Cr3–Cr10 were lower than that of sample Cr2. This is reasonable, because the oxidative potential is also reduced as the energy band gap decreases, which means that a narrower band gap is not necessarily preferable.30
3.4 Kinetic study
Fig. 7 shows the approximate linear relationship of ln(C0/C) versus irradiation time t for all samples, which indicates that the photocatalytic degradation process of TC can be considered as a Langmuir–Hinshelwood first-order kinetics reaction due to the low concentration of the substrate.31–33 The kinetics can be expressed as follows: ln(C0/C) = Kappt, where Kapp is the degradation reaction rate constant, and C0 and C are the initial concentration and the concentration at reaction time t for TC, respectively. The apparent decomposition rate constant (Kapp) values for all samples are given in Table 1. It is obvious that the Cr2 sample, with the largest rate constant (Kapp = 0.01607 min−1), has the highest catalytic activity, and further confirms the results of the visible light-induced photocatalytic activity experiments shown in Fig. 6. Experimental evidence for all the photocatalytic degradation in this work suggests that Cr-STO is an excellent visible-light-driven photocatalyst of TC degradation.
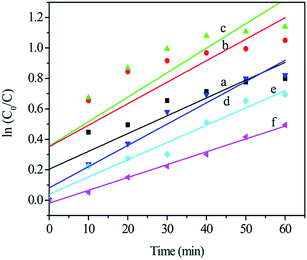 |
| | Fig. 7 Kinetics of the photocatalytic degradation of (a) Cr0.5, (b) Cr1, (c) Cr2, (d) Cr3, (e) Cr5 and (f) Cr10 under visible light in 60 min. | |
3.5 ESR study
The photocatalytic mechanism was studied by the ESR spin-trap technique and trapping experiments for radicals and holes.34–39 The ESR spin-trap technique (with DMPO) was employed to monitor the reactive oxygen species generated during the irradiation of the present system, and the results are shown in Fig. 8. A Nd:YAG laser (λ = 532 nm) was employed to irradiate catalyst-containing suspensions. As depicted in Fig. 8a, four characteristic peaks of DMPO-˙OH (marked with ★) and six characteristic peaks of DMPO-˙CH3 (marked with ※) were clearly observed in the suspension of Cr-STO cubic nanoparticles at the instant the light turned on, and the intensity of these peaks increased with irradiation time. No such signals were detected when the suspension was kept in darkness. This means that irradiation is essential to the generation of ˙OH and ˙CH3 on the surface of the catalyst. The evidence that DMPO-˙OH and DMPO-˙CH3 are produced on the surface of visible illuminated Cr-STO provides a solid indication that the photocatalyst can be efficiently excited by visible light to create electron hole pairs, and that the charge separation is maintained long enough to react with adsorbed TC/H2O and to produce a series of active ˙OH and ˙CH3 radicals, which finally induce the decomposition of TC. Therefore, a dual mechanism involving both ˙OH radical and ˙CH3 radical oxidation is expected to be involved in the photocatalysis process. Meanwhile, the active species in the present photocatalytic oxidation were examined by observing the reaction process under different conditions. In order to confirm this result, we performed ESR studies of the irradiation of TC without catalyst in water, and it is shown in Fig. S1.† As can be seen from the figure, the characteristic peaks of DMPO-˙OH and DMPO-˙CH3 cannot be observed in the absence of Cr-STO, either in the dark or under visible light irradiation. Fig. 8b shows the photocatalytic degradation of TC with the addition of holes and ˙OH radical scavengers, respectively. The addition of tert-butanol as an ˙OH radical scavenger caused a decrease of the photocatalytic degradation of TC; meanwhile, minimal TC degradation was also observed with the addition of a hole capturing agent (EDTA-Na), suggesting that the ˙OH radicals and direct hole oxidation mainly govern the photocatalytic process in the photocatalytic degradation of TC.
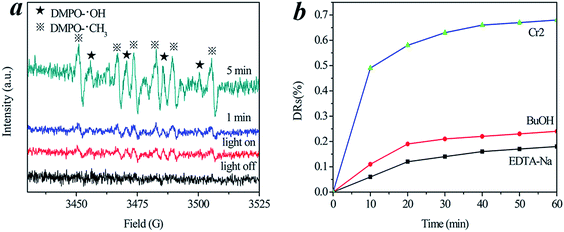 |
| | Fig. 8 (a) DMPO spin-trapping ESR spectra of Cr-STO cubic nanoparticles. (b) Photocatalytic degradation of TC with the addition of hole and radical scavengers. | |
The reaction mechanism is thus briefly described in Fig. 9. Under visible light irradiation, electrons in the VB of the Cr 3d orbital are excited into the CB, leaving holes in the VB.16,40 The holes that travel to the surface of the Cr-STO then react with adsorbed H2O, OH− and TC to produce ˙OH and ˙CH3 radicals, which finally induce the decomposition of organic compounds. The combined results of the trapping experiments for radicals and holes indicate that ˙OH radicals and holes play a crucial role for the degradation of TC. It can be concluded that h+ and ˙OH radicals are the main active species of Cr-STO cubic nanoparticles in aqueous solution under visible-light irradiation.
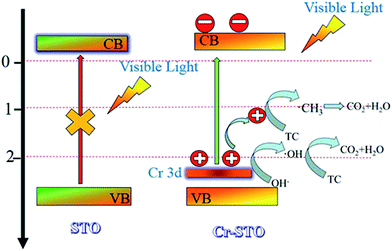 |
| | Fig. 9 A plausible mechanism of the photocatalytic activity of electrons and holes under visible light illumination on Cr-STO photocatalysts. | |
4 Conclusions
In conclusion, we have developed a facile one-pot hydrothermal method to synthesize Cr-STO cubic nanoparticles with uniform morphology. The resulting Cr-STO cubic nanoparticles exhibit enhanced photocatalytic activity for the degradation of TC under visible light. Moreover, we concluded that h+ and ˙OH radicals are the main active species of the Cr-STO cubic nanoparticles in aqueous solution under visible-light irradiation by the ESR spin-trap technique and trapping experiments for radicals and holes.
Acknowledgements
We gratefully acknowledge the financial support of the National Natural Science Foundation of China (21276116, 21477050, 21301076, 21303074 and 21407067), Excellent Youth Foundation of Jiangsu Nature Scientific Committee (BK20140011), Program for high-level innovative and entrepreneurial talents in Jiangsu Province, Program for New Century Excellent Talents in University (NCET-13-0835), Henry Fok Education Foundation (141068) and Six Talents Peak Project in Jiangsu Province (XCL-025).
References
- C. Reyes, J. Fernández, J. Freer, M. A. Mondaca, C. Zaror, S. Malato and H. D. Mansilla, J. Photochem. Photobiol., A, 2006, 184, 141–146 CrossRef CAS PubMed.
- R. A. Palominos, M. A. Mondaca, A. Giraldo, G. Peñuela, M. Pérez-Moya and H. D. Mansilla, Catal. Today, 2009, 144, 100–105 CrossRef CAS PubMed.
- X. Yuan, M. Zheng, Y. Zhang, T. Zhou, C. Li, X. Fang, L. Ma and W. Shen, Inorg. Chem., 2013, 52, 2581–2587 CrossRef CAS PubMed.
- Q. Kuang and S. Yang, ACS Appl. Mater. Interfaces, 2013, 5, 3683–3690 CAS.
- A. E. Souza, G. T. A. Santos, B. C. Barra, W. D. Macedo, S. R. Teixeira, C. M. Santos, A. M. O. R. Senos, L. Amaral and E. Longo, Cryst. Growth Des., 2012, 12, 5671–5679 CAS.
- F. A. Rabuffetti, P. C. Stair and K. R. Poeppelmeier, J. Phys. Chem. C, 2010, 114, 11056–11067 CAS.
- H. Hussain, X. Torrelles, P. Rajput, M. Nicotra, G. Thornton and J. Zegenhagen, J. Phys. Chem. C, 2014, 118, 10980–10988 CAS.
- J. S. Jeong, P. Ambwani, B. Jalan, C. Leighton and K. A. Mkhoyan, ACS Nano, 2013, 7, 4487–4494 CrossRef CAS PubMed.
- J. A. Enterkin, W. Setthapun, J. W. Elam, S. T. Christensen, F. A. Rabuffetti, L. D. Marks, P. C. Stair, K. R. Poeppelmeier and C. L. Marshall, ACS Catal., 2011, 1, 629–635 CrossRef CAS.
- H. Yu, H. Irie, Y. Shimodaira, Y. Hosogi, Y. Kuroda, M. Miyauchi and K. Hashimoto, J. Phys. Chem. C, 2010, 114, 16481–16487 CAS.
- M. Liu, X. Qiu, M. Miyauchi and K. Hashimoto, J. Am. Chem. Soc., 2013, 135, 10064–10072 CrossRef CAS PubMed.
- H.-C. Chen, C.-W. Huang, J. C. S. Wu and S.-T. Lin, J. Phys. Chem. C, 2012, 116, 7897–7903 CAS.
- X. Zhou, J. Shi and C. Li, J. Phys. Chem. C, 2011, 115, 8305–8311 CAS.
- Y. Wang, H. Xu, X. Wang, X. Zhang, H. Jia, L. Zhang and J. Qiu, J. Phys. Chem. B, 2006, 110, 13835–13840 CrossRef CAS PubMed.
- R. Konta, T. Ishii, H. Kato and A. Kudo, J. Phys. Chem. B, 2004, 108, 8992–8995 CrossRef CAS.
- J. Wang, T. Fang, S. Yan, Z. Li, T. Yu and Z. Zou, Comput. Mater. Sci., 2013, 79, 87–94 CrossRef CAS PubMed.
- I. Bykov, M. Makarova, V. Trepakov, A. Dejneka, L. Yurchenko, L. Yurchenko, A. Jäger and L. Jastrabik, Phys. Status Solidi B, 2013, 250, 821–824 CrossRef CAS.
- U. Sulaeman, S. Yin and T. Sato, Appl. Catal., B, 2011, 105, 206–210 CrossRef CAS PubMed.
- H. Li, S. Yin, Y. Wang, T. Sekino, S. W. Lee and T. Sato, J. Catal., 2013, 297, 65–69 CrossRef CAS PubMed.
- Z. Jiao, Y. Zhang, T. Chen, Q. Dong, G. Lu and Y. Bi, Chemistry, 2014, 20, 2654–2662 CrossRef CAS PubMed.
- K. Maeda, ACS Appl. Mater. Interfaces, 2014, 6, 2167–2173 CAS.
- S. Kawasaki, K. Akagi, K. Nakatsuji, S. Yamamoto, I. Matsuda, Y. Harada, J. Yoshinobu, F. Komori, R. Takahashi, M. Lippmaa, C. Sakai, H. Niwa, M. Oshima, K. Iwashina and A. Kudo, J. Phys. Chem. C, 2012, 116, 24445–24448 CAS.
- H. Irie, Y. Maruyama and K. Hashimoto, J. Phys. Chem. C, 2007, 111, 1847–1852 CAS.
- D. Wang, J. Ye, T. Kako and T. Kimura, J. Phys. Chem. B, 2006, 110, 15824–15830 CrossRef CAS PubMed.
- H. W. Kang, S. N. Lim, D. Song and S. B. Park, Int. J. Hydrogen Energy, 2012, 37, 11602–11610 CrossRef CAS PubMed.
- J. H. Nobbs, Rev. Prog. Color. Relat. Top., 1985, 15, 66–75 CrossRef PubMed.
- R. Hu, Y. Wang, Y. Zou, X. Chen, S. Liu and X. Luo, J. Appl. Phys., 2013, 113, 063108 CrossRef PubMed.
- D. Mitoraj and H. Kisch, J. Phys. Chem. C, 2009, 113, 20890–20895 CAS.
- C. Sandoval and A. D. Kim, J. Opt. Soc. Am. A, 2014, 31, 628–636 CrossRef PubMed.
- P. Reunchan, N. Umezawa, S. Ouyang and J. Ye, Phys. Chem. Chem. Phys., 2012, 14, 1876 RSC.
- C. Zhao, M. Pelaez, X. Duan, H. Deng, K. O'Shea, D. Fatta-Kassinos and D. D. Dionysiou, Appl. Catal., B, 2013, 134-135, 83–92 CrossRef CAS PubMed.
- S. Valencia, F. Cataño, L. Rios, G. Restrepo and J. Marín, Appl. Catal., B, 2011, 104, 300–304 CrossRef CAS PubMed.
- E. Du, Y. X. Zhang and L. Zheng, React. Kinet. Catal. Lett., 2009, 97, 83–90 CrossRef CAS PubMed.
- W. Zhao, W. Ma, C. Chen, J. Zhao and Z. Shuai, J. Am. Chem. Soc., 2004, 126, 4782–4783 CrossRef CAS PubMed.
- C. Wang, H. Zhang, F. Li and L. Zhu, Environ. Sci. Technol., 2010, 44, 6843–6848 CrossRef CAS PubMed.
- Z. Wang, W. Ma, C. Chen, H. Ji and J. Zhao, Chem. Eng. J., 2011, 170, 353–362 CrossRef CAS PubMed.
- T. Xu, L. Zhang, H. Cheng and Y. Zhu, Appl. Catal., B, 2011, 101, 382–387 CrossRef CAS PubMed.
- Y. Yang and S. Mu, J. Phys. Chem. C, 2011, 115, 18721–18728 CAS.
- D. V. Azamat, A. Dejneka, J. Lančok, L. Jastrabik, V. A. Trepakov, Z. Bryknar, E. V. Neverova and A. G. Badalyan, J. Phys. Chem. Solids, 2014, 75, 271–275 CrossRef CAS PubMed.
- H. Yu, J. Wang, S. Yan, T. Yu and Z. Zou, J. Photochem. Photobiol., A, 2014, 275, 65–71 CrossRef CAS PubMed.
Footnote |
| † Electronic supplementary information (ESI) available. See DOI: 10.1039/c4ra13821j |
|
| This journal is © The Royal Society of Chemistry 2015 |
Click here to see how this site uses Cookies. View our privacy policy here. 


