Synthesis of nitrogen-doped carbon cellular foam with ultra-high rate capability for supercapacitors
Zhiling Duab,
Youshun Pengc,
Zhipeng Mab,
Chunying Lib,
Jing Yangb,
Xiujuan Qin*ab and
Guangjie Shao*ab
aState key Laboratory of Metastable Materials Science and Technology, Yanshan University, Qinhuangdao 066004, China. E-mail: shaoguangjie@ysu.edu.cn; qinxj@ysu.edu.cn; Fax: +86-335-8061569; Tel: +86-335-8061569
bHebei Key Laboratory of Applied Chemistry, College of Environmental and Chemical Engineering, Yanshan University, Qinhuangdao 066004, China
cSchool of Physics and Chemistry, Hebei Normal University of Science and Technology, Qinhuangdao 066004, China
First published on 7th January 2015
Abstract
Three-dimensional (3D) interconnected N-doped porous carbons (NPCs) with different levels of pore structure are synthesized by a template method using MnOx as template and N-enriched pyrrole as carbon source. The fabricated materials show favorable pore size distribution in the range about 3–4 nm and moderate nitrogen content changing from 0.94 to 1.63 at%. Used as electrode material, the NPC originated from the optimum pyrolysis temperature of 750 °C demonstrates the best capacitance performance with a high specific capacitance of about 239.30 F g−1 at 0.5 A g−1. Moreover, it reveals an outstanding rate capability and the specific capacitance reaches 212.90 F g−1 at 10.0 A g−1 (up to 88.97% capacitance retention), as well as excellent cycling stability (∼10% capacitance loss after 5000 cycles) tested in 6 M KOH aqueous solution. Such exquisite performance may be ascribed to a unique combination of high specific surface area, suitable pore size distribution and introduction of nitrogen atoms.
1. Introduction
Supercapacitors, also called electrochemical double-layer capacitors (EDLCs),1 are supposed to be a kind of promising energy storage device. The electrode materials occupy an irreplaceable position in further development of EDLCs. Porous carbons (PCs) as an ideal electrode material have drawn the increasing attention of researchers due to their high specific area and unique pore structure.2–4 Various porous carbons have been prepared, covering activated carbon, carbon nanotubes, xerogels, graphene, and carbide-derived carbon, etc.5–11 Studies demonstrate that high specific area could provide abundant electron/ion absorption sites and appropriate pore size distribution is favorable for fast ion diffusion.12–14 However, the poor specific capacitance and electronic conductivity still could not meet the demand for development in practical applications.Heteroatom doped into carbon matrix could improve the electrochemical properties resulting from the produced pseudo-capacitance, elevated electronic conductivity, increased wettability and decreased contact resistance.15,16 Some literatures have prepared N-doped porous carbon with predominant electrochemical performance by silica-template17–19 and soft-template methods.20 While silica-template method is considered to be a simple way used for synthesizing nitrogen-contained porous carbon, yet the high cost and removal of the silica template with corrosive hydrofluoric acid make it unpractical to be widely used. Similarly, soft-template method is also restricted by the high expense and tremendous hazard. Additionally, because of its various morphologies, controllable size and low cost, MnOx is of increasing interest in many fields from the viewpoint of social sustainability and environmental friendliness.
Herein, we report a facile template method using MnOx as templates and N-enriched polypyrrole (PPy) as an example to synthesize N-doped porous carbon with high specific surface area (SSA), interconnected pore structure, favorable pore size, and certain nitrogen content. What's more, the prepared NPCs show ultra-high rate capability with the specific capacitance of 212.90 F g−1 at 10.0 A g−1 and remarkable cycling stability of about 90% capacitance retention after 5000 cycles when used as electrode materials of supercapacitors.
2. Experimental section
2.1. Chemicals
In this experiment, all the used chemicals including Mn(NO3)2 (50%), KMnO4, sodium dodecyl sulfate (SDS) and pyrrole monomers are of analytical grade. And they are used directly as unvarnished without any treatment.2.2. Preparation of NPCs
NPCs were synthesized by a two-step template method. In the first step, 7.874 g of 50% Mn(NO3)2 solution, 1.476 g of pyrrole and 3.477 g of KMnO4 were prepared into 100 mL solution, respectively. Pyrrole solution and 0.5 g dodecyl sulfate (SDS) were added dropwise into Mn(NO3)2 solution under continuous stirring at 25 °C until homogeneous solution was formed. Then KMnO4 solution was slowly added into the above mixed solution under continuous stirring for 14 h, followed by vacuum filtration, then washed with deionized water and dried at 80 °C for 12 h. In the second step, the resulting products were transferred into ceramic crucibles and were calcined for 2 h in a furnace at the given temperature (e.g. 650 °C, 750 °C, and 850 °C) under inert N2 atmosphere to achieve template-including composites. Then the templates were etched with 15 wt% HCl, filtrated using vacuum pump, followed by washed thoroughly until pH = 7 with deionized water, and finally dried at 80 °C overnight to obtain NPC-650 °C, 750 °C, 850 °C, named as NPC-1, NPC-2 and NPC-3, respectively.2.3. Materials characterization
The structures of as-prepared samples were examined with X-ray diffraction (XRD) using a Rigakud/MAX-2500/pc X-ray diffractometer with Cu Kα radiation. Field-emission scanning electron microscope (FE-SEM, Hitachi Modle S-4800, KV) and transmission electron microscope (TEM, JEM2010) were taken to characterize the morphology and microstructure of the materials. Fourier Transform Infrared Spectroscopy (FTIR) was carried out on a Nicolet IS Fourier transformation infrared spectrometer over the wave number range of 400–4000 cm−1. X-ray photoelectron spectroscopy (XPS) analysis was obtained by a Kratos XSAM-800 spectrometer with Al Kα radiation source. High-resolution spectra of the individual elements were collected with the analyzer pass energy set at 20 eV. And the pressure inside the vacuum system was kept at 1 × 10⁻⁹ during all XPS operation. The porous structures of samples were measured with N2 sorption isotherms using a NOVA instrument (Quantachrome Instruments version 10.01). The specific surface area was calculated by BET (Brunauer–Emmett–Teller) method in the relative pressure range of 0.04–0.20. The pore volume and pore size distribution (PSD) was derived from the adsorption branches of isotherms using the density functional theory (DFT) model.2.4. Electrochemical measurements
The electrochemical characterizations were performed in electrolyte of 6 M KOH using a three electrode system with Hg/HgO electrode as a reference electrode and active carbon electrode as a counter electrode. The working electrode was fabricated by mixing the NPCs materials, acetylene black, and with polytetrafluorothylene (PTFE) binder at a weight ratio of 80![[thin space (1/6-em)]](https://www.rsc.org/images/entities/char_2009.gif) :
:![[thin space (1/6-em)]](https://www.rsc.org/images/entities/char_2009.gif) 15
15![[thin space (1/6-em)]](https://www.rsc.org/images/entities/char_2009.gif) :
:![[thin space (1/6-em)]](https://www.rsc.org/images/entities/char_2009.gif) 5. The total mass loading of NPC electrodes was 4 mg, including active material of NPC 3.2 mg. The mixture was coated on current collectors of 1 cm2 nickel foam in area, and dried at 80 °C for 12 h. The nickel foam was pressed at 4 MPa pressure for 30 s, and marinated in electrolyte of 6 M KOH for 24 h.
5. The total mass loading of NPC electrodes was 4 mg, including active material of NPC 3.2 mg. The mixture was coated on current collectors of 1 cm2 nickel foam in area, and dried at 80 °C for 12 h. The nickel foam was pressed at 4 MPa pressure for 30 s, and marinated in electrolyte of 6 M KOH for 24 h.
CHI660E electrochemical workstation (Chenhua, Shanghai China) was utilized to study cyclic voltammetry (CV) and electrochemical impedance spectroscope (EIS) in a three electrode system. The CV analysis was carried out within −1.0 and 0.2 V at the different scanning rates of 5, 20, 50, 100 and 200 mV s−1, and the EIS measurements were performed with the frequency from 1 mHz to 1 MHz. The galvanostatic charge–discharge measurement was recorded on a NEWARE auto-cycler between −1.0 and 0.2 V. The specific gravimetric capacitance was calculated from the galvanostatic discharge process based on working electrode by using the following equation:
where Ccv (F g−1) is the specific capacitance, I (A) is the discharge current, m (g) is the mass of active material of working electrode, v (V s−1) is the scan rate, and Va and Vc represent the low and high potential limits of CV tests, respectively. Particularly, the symmetrical total cell was performed to analyze the power and energy density in a two electrode system. The energy density was calculated by using the following equation:
where Ccell (F g−1) is the total cell specific capacitance and V (V) is the cell-operation potential. The average power density was calculated by using the following equation:
where E is the energy density and Δt is the discharge time.
3. Results and discussions
3.1. Structure and morphology analysis
Scheme 1 is depicted to clearly explain the mechanism of prepared N-doped porous carbon by template method. It can be found that removing templates could produce the big mesoporous structure, which is favorable for the fast ion propagation. It is worth noting that abundant micropores located in the walls could provide numerous charge absorption sites, which are caused during pyrolysis process. Powder XRD, SEM and TEM techniques are used to analyze the structure and morphology performances of obtained samples. The XRD patterns of carbon powders prepared at different carbonization temperatures of 650 °C, 750 °C and 850 °C indicate that all the carbon materials are amorphous carbon (Fig. 1a). And the humps peaks appear at 2θ = ∼24°/43° are assigned to the graphitic (002) and (100) plane, respectively.21 It is obvious that the humps of materials at ∼24° occur shifting in comparison with the ideal the graphitic (002) peak at 26° and it indicates the interlayer spacing (002) of carbon materials is larger than ideal value of 0.34 nm of ordered graphite (002). NPC-2 presents porous cellular foam structure with mostly small cellular cells (ca. 10 nm) and the minority of large cellular cells (ca. 25 nm), as shown in Fig. 1b. Fig. 1c–d shows that NPC-2 exhibits a typical interconnected porous foam morphology with primary pore dimensions in the range of ∼10 nm duplicated from hard templates of MnOx, and it agrees well with the TEM analysis. The previous reports have proved that the 3D porous web-like porous structure is important for the high mass transfer efficiency due to the moderate mesoporous size and interconnection could provide a more favorable path for penetration and the fast transportation of ions.22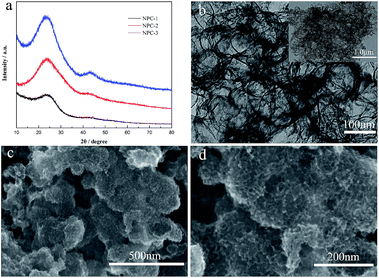 | ||
| Fig. 1 (a) XRD patterns of NPC-1, NPC-2, and NPC-3, respectively; (b) TEM image of NPC-2 (the inset shows its entire image at low magnification); (c and d) SEM images of NPC-2. | ||
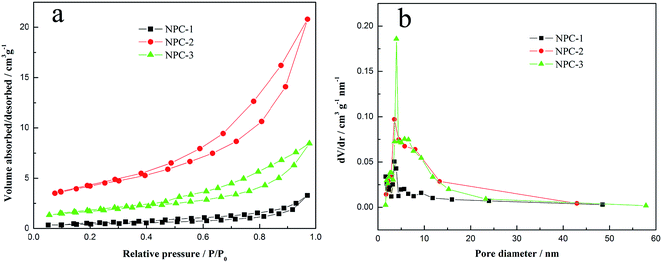
The textural properties are investigated by nitrogen sorption and the pore structure parameters of as-prepared materials in various yields are shown in Table 1. Fig. 2a shows that the samples exhibit type IV N2-adsorption isotherms with obvious hysteresis loops at intermediate pressure section, which indicate the presence of micropores and mesopores.23 The pore size distribution (PSD) is calculated using the Barret–Joyner–Halenda (BJH) model, as shown in Fig. 2b. It reveals that the micropores and small mesopores coexist in network structure of carbons and the average pore size is about 3.5 nm. Moreover, the specific surface area and total pore volume of NPC-1 are 125.230 m2 g−1 and 0.438 cm3 g−1, NPC-2 are 424.941 m2 g−1 and 0.943 cm3 g−1, and NPC-3, 437.976 m2 g−1 and 0.956 cm3 g−1, respectively. Obviously, the SBET and total pore volume increase quickly when heat treatment temperature rises to 750 °C or 850 °C (Table 1). It is because that more micro/meso-pores are produced and PPy is decomposed thoroughly due to the release of more small molecules of CO2, H2O and H2 with the increase of pyrolysis temperature. It is proved that the materials are successfully prepared with needed porosity, in which plentiful micropores could create numerous ion absorption sites24 and moderate pore structure with the size of 3–4 nm could optimize their electrochemical properties.
| Samples | Dap (nm) | SBET (m2 g−1) | Vt (cm3 g−1) | Nitrogen content (at%) | Cgd (F g−1) | Ccv (F g−1) | |||
|---|---|---|---|---|---|---|---|---|---|
| Total | N-6 | N-5 | N-Q | Dt (3 min) | Ost (1 min) | ||||
| a Dap-average pore diameter, SBET-BET specific surface area, Vt-total pore volumes, Dt-discharge time, Ost-one-way scan time. | |||||||||
| NPC-1 | 3.552 | 125.230 | 0.438 | 1.63 | 0.472 | 1.104 | 0.054 | 192.864 | 156.150 |
| NPC-2 | 3.526 | 424.941 | 0.943 | 1.22 | 0.672 | 0.500 | 0.048 | 224.025 | 192.122 |
| NPC-3 | 3.976 | 437.976 | 0.956 | 0.94 | — | — | — | 173.568 | 163.484 |
FTIR is used to identify qualitatively the surface functional groups of NPC-1, NPC-2, and NPC-3, as shown in Fig. 3. The characteristic peak at 3430 cm−1 is attributed to the O–H stretching vibration originated from H2O and the peak positioned at ∼2900 cm−1 corresponds to the stretching vibration of C–H bond. The strong and sharp peak centred at 1630 cm−1 is identified as C = X (X = C, N, or O) stretching modes,25 while the peaks at 1050 and 1090 cm−1 are associated with the C–N bending vibration mixed with the C–H in-plane deformation vibration.26 In addition, other absorption peaks are observed at 880 cm−1 (the N–H out-of deformation vibration),27 1130 cm−1 (the C–O stretching vibration), and 1270 cm−1/1380 cm−1 (assigned to existence of the C–N bonding).28 Hence, the FTIR analysis confirms the nitrogen/oxygen-including functional groups have been introduced in the synthesized materials.
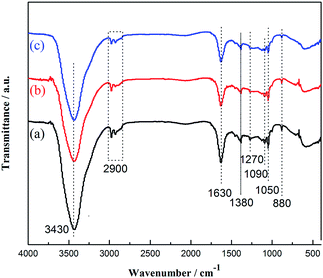 | ||
| Fig. 3 FTIR spectra of as-prepared carbon materials of (a) of NPC-1, (b) of NPC-2, and (c) of NPC-3. | ||
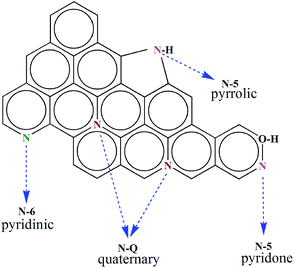
The calcination temperature could influence the heteroatom content and structure state in the N-doped carbons materials. Moreover, the different types and chemical states of heteroatoms have the distinct effects in improving the performances of NPCs. So the test employs XPS technique to probe the content of nitrogen doped in NPCs materials. Fig. 4a reveals three typical peaks of C 1s (284.0 eV), N 1s (400.0 eV), and O 1s (532.0 eV), which is agreement with the FIIR measurement. The presence of nitrogen functional groups could conduce to enhancement of electrochemical performances as they can considerably contribute to an additional pseudocapacitance and heighten interface wettability. To further analyze nitrogen chemical environments, the high-resolution N 1s XPS spectrum is appreciated in Fig. 4b–d. The curve-fitting method is used to identify the types of nitrogen species by XPS peak-fit software. The N 1s spectrum of the materials is divided into three individual component peaks: pyridinic (N-6, ∼398.2 eV), pyrrolic/pyridone (N-5, ∼400.1 eV), and quaternary (N-Q, ∼401.0 eV). The relative contents of these different functionalities in N 1s are also summarized in Table 1. With the increase of pyrolysis temperature, the percentages of N-5, N-6 and N-Q change from 67.73% to 40.98%, 28.96–55.08% and 3.31–3.94% of total nitrogen content. It is clear that the content of the N-5 decreases in total nitrogen content, while N-6 and N-Q increase. Many previous studies29 confirm that N-6/N-5 representing the pseudocapacitance effect are located at the edges of graphene layers and N-Q improving the electric conductivity is positioned at either the centre or the edge of the carbon framework, as shown in Scheme 2. Fig. 4d indicates that when the reaction temperature rises to 850 °C, the spectra of N 1s changes inconspicuous and could not be fitted into three peaks due to the low nitrogen content. Therefore, we have successfully synthesized the nitrogen doped porous carbons with definite proportion of pyridinic N and graphitic N, which play a crucial role in various aspects such as active sites for ORR and electrode materials of supercapacitor.
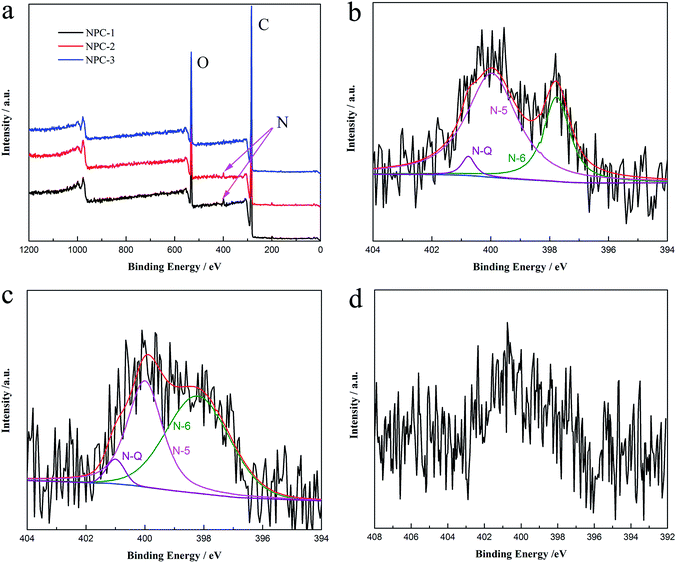 | ||
| Fig. 4 XPS spectra of as-prepared products (a) and N 1s XPS spectra of (b) NPC-1, (c) NPC-2, and (d) NPC-3 (pyridinic (N-6), pyrrolic/pyridone (N-5) and quaternary (N-Q)). | ||
3.2. Electrochemical behavior of samples for supercapacitor
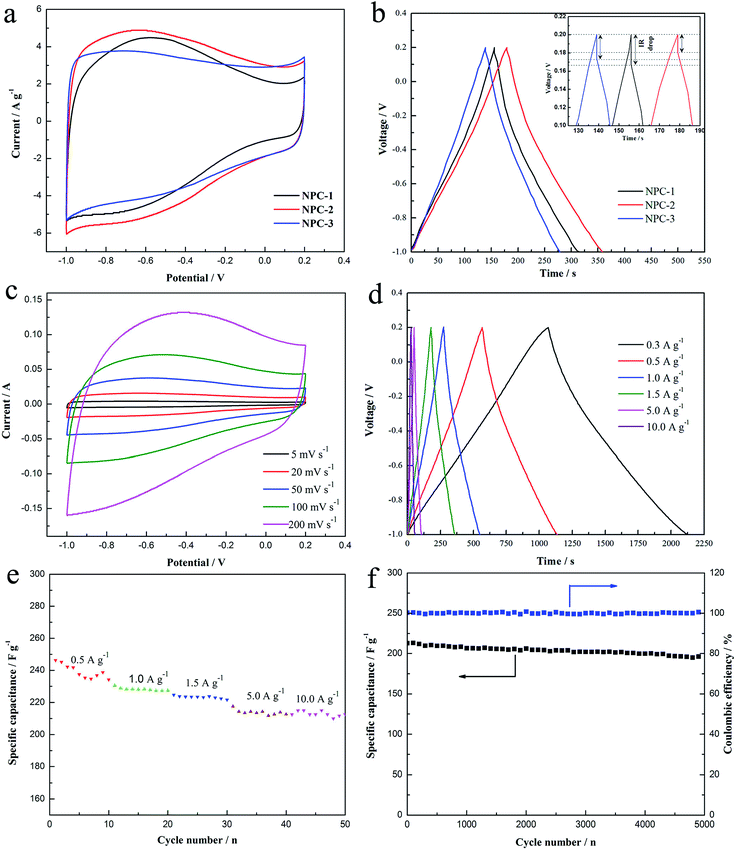
The above discussions only involve in the material microstructure and surface morphology, and the following talk is about the electrochemical properties. At the first time, the different NPCs are compared by galvanostatic charge–discharge and CV, which are carried out using a three-electrode system in 6 M KOH electrolyte at the potential window from −1.0 to 0.2 V (vs. Hg/HgO) (Fig. 5a and b). Fig. 5a shows the CV curves of NPCs at a scan rate of 20 mV s−1. It is obvious that the CV curves of samples all present nearly rectangular shapes and fast current response at potential changing direction, and it indicates that the charges can reassemble rapidly at switching voltage. As seen from Fig. 5a, the area encircled by NPC-2 curve is the largest and current density is also the highest at the same value of potential, implying that NPC-2 possesses the highest specific capacitance. The definite value of specific capacitance calculated from CV curve at the scan rate of 20 mV s−1 is listed in Table 1. The result shows that NPC-2 presents the best capacitance behavior and its specific capacitance is 192.122 F g−1. The superior structure of NPC-2, such as large specific surface area and moderate pore size distribution, contributes to the outstanding capacitance performance. In addition, the CV curves of NPCs deviate from ideal rectangular shapes with a distinguished hump at lower potential and it changes inconspicuous when the calcination temperature increases to 850 °C. It can be explained that nitrogen atom have be successfully incorporated into the carbon network28,30 and the nitrogen-enriched functional groups are eliminated with the increasing decomposition temperature. It is supposed that the high capacitance of NPC-2 is with respect to the pseudocapacitance caused by the doped nitrogen atom except favorable pore size distribution and large specific surface area. Fig. 5c exhibits the CV curves of NPC-2 electrode at different sweep rates. It demonstrates that current response increases when the sweep rate accelerates and the CV curve of NPC-2 electrode remains the rectangular shape even at the high sweep rate of 200 mV s−1. The result exhibits that the NPC-2 presents excellent rate capability because of the 3D interconnected porous structure and relatively small internal resistance.31 Moreover, the mesoporous structure of 3–4 nm could enhance the utilization efficiency of specific surface area to obtained high specific capacitance.Fig. 5b shows the galvanostatic charge–discharge curves of as-prepared NPCs electrodes at the current density of 1.5 A g−1. It is found that all the curves show linear shapes with little deviation from ideal line at lower potential, which means good capacitive behavior and the presence of pseudocapacitance. Furthermore, NPC-2 electrode shows the longest discharge time in Fig. 5b, indicating that NPC-2 electrode possesses the largest capacitance (224.025 F g−1 at 1.5 A g−1), and it is consistent with results from CV technique. The inset of Fig. 5b reveals that the IR drop of NPC-2 is the lowest, and it indicates that the resistance of electrode of NPC-2, including the resistance of electrolyte and the resistance ion/electron transfer, is the smallest of all. Fig. 5d exhibits the V–t curves of NPC-2 at various current densities of 0.3–10.0 A g−1. The curves are linear shapes and highly symmetrical to their corresponding counterparts, proving the good capacitive properties and high coulombic efficiency.32 Fig. 5e implies that NPC-2 possess the superior rate capability, as the specific capacitance remains at ∼210 F g−1 with the current density rising to 10 A g−1. As we all know, the cycle life is an important index to measure the performance of supercapacitors. Fig. 5f exhibits cycle stability and capacitance retention curves of NPC-2-based electrode. It presents excellent cycle durability with a stable value of 200 F g−1 (ca. 90% capacitance retention) after 5000 cycles. In addition, the coulombic efficiency (charge capacitance/discharge capacitance) remains at 100% during the cycling process. It is because that the electrolyte could easily enter into pore participating in the accumulation of charge and the chemical modification is reversible. The Ragone plot of NPC-2 in Fig. 6 was tested using the symmetrical total cell in a two electrode system with a cell potential window from 0 to 1.0 V in 6 M KOH. It exhibits that NPC-2 possesses an energy density of 7.06 W Kg−1 at a power density of 225 W Kg−1 at 0.3 A g−1, and still retains 6.48 W Kg−1 at a high density of 2414 W Kg−1 at 10.0 A g−1. Therefore, based NPC-2 electrode has high power performance. As analyzed from CV test, the outstanding electrochemical performance of NPC-2 is attributed to synergistic effect of 3D porous web-like structure, optimum pore size of 3–4 nm, and improved electronic conductivity endowed by lone electron pairs from the nitrogen groups, which are favorable for fast ion/electron transfer.9
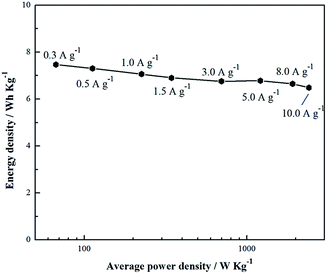 | ||
| Fig. 6 Ragone plot of NPC-2 tested in a two electrode system with a cell potential window from 0 to 1.0 V in 6 M KOH electrolyte. | ||
In order to further investigate the electrochemical performances of NPCs-based electrodes, EIS measurements were used to perform characteristic frequency response. As shown in inset of the Fig. 7a, the intercept of inconspicuous semicircle with the real axis, namely equivalent series resistance (ESR), represents the total value of the resistance of electrolyte solution, the intrinsic resistance of active material, and the contact resistance at the interface of active material and current collector.9 And the ESR value of samples is estimated about 0.48 Ω, indicating that the total resistance value of electrodes is very low. Furthermore, there are no obvious semicircles of all tested NPC-based electrodes at the relatively high-frequency region, which are ascribed to very small charge transfer resistance.33 That is confirmed that charges are stored primarily via a non-Faradaic process and electrochemical double-layer capacitance is in dominant position. Compared with NPC-1 electrode, the Nyquist plot of NPC-2 and NPC-3 are leaner to imaginary axis at the low-frequency region, as shown in Fig. 7a. So it shows the better capacitive behavior, attributed to suitable pore size distribution which is favorable for the electrolyte easily accessing the pores. Fig. 7b shows the Bode plots of NPC-1, NPC-1, and NPC-3, respectively. It could be found that the phase angles of NPC-3 and NPC-2 are close to ideal value of −90°. It is concluded that the high specific capacitance is mainly due to the contribution of EDLCs and special structure of samples.
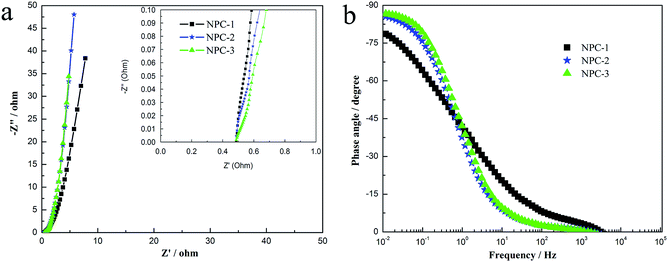 | ||
| Fig. 7 Nyquist plots (a) (the inset shows expanded high-frequency region of Nyquist plots), and Bode plots of all the materials (b). | ||
4. Conclusions
We successfully synthesized N-doped porous carbons by using N-containing pyrrole as the carbon source at different carbonization temperature. The electrode materials of NPCs show high surface area, moderate pore size distribution, interconnected pore structure and appropriate amount of the doped nitrogen. Hence, the NPCs hold good electrochemical properties. The highest specific capacitance coming from NPC-2 electrode is up to 212.90 F g−1 at a current density of 10.0 A g−1 in 6 M KOH by galvanostatic charge/discharge technique. Furthermore, NPC-2 electrode exhibits excellent rate capability (ca. 88.97% retention at the current density raising from 0.3 A g−1 to 10.0 A g−1) and outstanding cycle stability (ca. 92.26% retention after 5000 cycles). The result indicates that the highest capacitance provided by NPC-2 is ascribed to the incorporation of larger specific surface area, optimum pore size distribution, and introduced nitrogen heteroatom. The prepared N-doped porous carbon is a promising material for supercapacitance as exciting electrochemical performance. Certainly, the N-doped porous carbon with the superior structure can also be applied in hydrogen storage, fuel cells, absorption and anode for lithium ion batteries.Acknowledgements
We are grateful for the financial support from the Natural Science Foundation of Hebei Province (B2012203069) and support from education department of Hebei province on natural science research key projects for institution of higher learning (ZH2011228).Notes and references
- V. Khomenko, E. Raymundo-Piñero and F. Béguin, J. Power Sources, 2008, 177, 643 CrossRef CAS PubMed.
- B. Xu, S. S. Hou, G. P. Cao and F. Wu, J. Mater. Chem., 2012, 22, 19088 RSC.
- L. L. Zhang, Y. Gu and X. S. Zhao, J. Mater. Chem. A, 2013, 1, 9395 CAS.
- J. C. Wang and S. Kaskel, J. Mater. Chem., 2012, 22, 23710 RSC.
- Y. P. Zhai, Y. Q. Dou, D. Y. Zhao and S. Dai, Adv. Mater., 2011, 23, 4828 CrossRef CAS PubMed.
- B. Xu, F. Wu, R. J. Chen and G. P. Cao, J. Power Sources, 2010, 195, 2118 CrossRef CAS PubMed.
- G. Lota, K. Fic and E. Frackowiak, Energy Environ. Sci., 2011, 4, 1592 CAS.
- H. Q. Li, J. Y. Luo, X. F. Zhou, C. Z. Yu and Y. Y. Xia, J. Electrochem. Soc., 2007, 154, A731 CrossRef CAS PubMed.
- B. Xu, S. F. Yue, Z. Y. Sui and X. T. Zhang, Energy Environ. Sci., 2011, 4, 2826 CAS.
- C. Wu, X. Y. Wang, B. Ju and L. L. Jiang, J. Power Sources, 2013, 227, 1 CrossRef CAS PubMed.
- J. Xu, R. J. Zhang, P. Chen and S. H. Ge, J. Power Sources, 2014, 246, 132 CrossRef CAS PubMed.
- Z. Li, X. H. Tan, H. L. Wang and D. Mitlin, Energy Environ. Sci., 2013, 6, 871 CAS.
- L. Sun, C. G. Tian, M. T. Li and H. G. Fu, J. Mater. Chem. A, 2013, 1, 6462 CAS.
- Y. S. Yun, J. Shim, Y. Tak and H. J. Jin, RSC Adv., 2012, 2, 4353 RSC.
- L. F. Lai, H. P. Yang, Z. X. Shen and J. Y. Lin, ACS Nano, 2012, 6, 5941 CrossRef CAS PubMed.
- Y. M. Tan, C. F. Xu, Q. J. Xie and N. F. Zheng, ACS Appl. Mater. Interfaces, 2013, 5, 2241 CAS.
- L. P. Wang, Y. Zhou and J. S. Qiu, Microporous Mesoporous Mater., 2013, 174, 67 CrossRef CAS PubMed.
- Y. D. Xia, Z. X. Yang and R. Mokaya, J. Phys. Chem. B, 2004, 108, 19293 CrossRef CAS.
- G. Moon, Y. Shin, D. Choi and J. Liu, Nanoscale, 2013, 5, 6291 RSC.
- Y. H. Su, H. L. Jiang, Y. H. Zhu and W. J. Zou, J. Power Sources, 2014, 265, 246 CrossRef CAS PubMed.
- H. L. Guo and Q. M. Gao, J. Power Sources, 2009, 186, 551 CrossRef CAS PubMed.
- K. Z. Gao, Z. Q. Shao, J. Li and X. Wang, J. Mater. Chem. A, 2013, 1, 63 CAS.
- Y. F. Zhao, W. Wang, D. B. Xiong, G. J. Shao and W. Xia, Int. J. Hydrogen Energy, 2012, 37, 19395 CrossRef CAS PubMed.
- K. S. Xia, Q. M. Gao, J. H. Jiang and J. Hu, Carbon, 2008, 46, 1718 CrossRef CAS PubMed.
- C. Wang, G. Shao, Z. Ma and W. Song, Electrochim. Acta, 2014, 130, 679 CrossRef CAS PubMed.
- S. T. Navale, G. D. Khuspe, M. A. Chougule and V. B. Patil, J. Phys. Chem. Solids, 2014, 75, 236 CrossRef CAS PubMed.
- A. Kumar, R. K. Singh, H. K. Singh and P. Srivastava, J. Power Sources, 2014, 246, 800 CrossRef CAS PubMed.
- M. Li and J. M. Xue, J. Phys. Chem. C, 2014, 118, 2507 CAS.
- M. Zhou, F. Pu and S. Y. Guan, Carbon, 2014, 68, 185 CrossRef CAS PubMed.
- S. L. Candelaria, B. B. Garcia, D. W. Liu and G. Z. Cao, J. Mater. Chem., 2012, 22, 9884 RSC.
- M. Li, J. Ding and J. M. Xue, J. Mater. Chem. A, 2013, 1, 7469 CAS.
- J. B. Zhang, L. J. Jin, J. Cheng and H. Q. Hu, Carbon, 2013, 55, 221 CrossRef CAS PubMed.
- D. C. Guo, J. Mi, G. P. Hao and A. H. Lu, Energy Environ. Sci., 2013, 6, 652 CAS.
| This journal is © The Royal Society of Chemistry 2015 |


