MoS2–C/graphite, an electric energy storage device using Na+-based organic electrolytes†
Liping Zhaoab,
Li Qi*a and
Hongyu Wangac
aState Key Laboratory of Electroanalytical Chemistry, Changchun Institute of Applied Chemistry, Chinese Academy of Sciences, 5625 Renmin Street, Changchun 130022, China
bUniversity of Chinese Academy of Sciences, Beijing 100049, China
cChangzhou Institute of Energy Storage Materials & Devices, 9 Hehai East Road, Changzhou 213000, China
First published on 16th January 2015
Abstract
Molybdenum disulfide–carbon composite (MoS2–C) sample has been prepared by a hydrothermal method using Na2MoO4, CH4N2S and glucose as starting materials and then calcined at 800 °C in an N2/H2 mixed atmosphere. X-ray diffraction and N2 adsorption–desorption tests have been employed to characterize its crystal and pore structure. SEM, TEM and TG methods have been used to investigate its morphology and the weight ratio of carbon. The MoS2–C can be used as the negative electrode for electric energy storage devices using Na+-based organic electrolytes. The charge storage mechanism at the MoS2–C negative electrode has been investigated. Electric energy storage devices using MoS2–C/graphite have been constructed and their electrochemical performance has been studied.
1. Introduction
Lithium-ion batteries have been quite successful in commercial utilization since a long time. Numerous studies on the electrode1–3 and electrolyte4–6 materials of lithium-ion batteries have also been reported. However, the insatiable demand for large-scale energy sources will conflict with the shortage of lithium resources on the earth. Therefore, many researchers have already turned to sodium-based materials.7–9 There have been some encouraging electrode materials reported and some pilot sodium-ion batteries proposed.10–21 However, their comprehensive performance is still less satisfactory than that of Li+ batteries. Hard carbons are commonly used as anode materials in current Na+ batteries, which is mainly due to their comparatively high reversible capacity in a low potential range. However, most of this capacity is delivered at a potential very close to 0 V vs. Na/Na+,22–24 which is likely to cause sodium metal deposition and the explosion of cells under abusive conditions. Therefore, safe alternative anode materials for Na+ batteries are needed.In many respects, MoS2 has successfully attracted our attention because of its special layered structure and electrochemical properties. We have already reported MoS2 as the negative electrode in a “Li+ capacitor”.25 Actually, its typical layered structure bound by van der Waals forces could also easily accommodate sodium ions. In fact, MoS2 was used in rechargeable lithium batteries early in the 1980s.26 To extend their cycle life, the potential of the MoS2 electrode was over 1 V vs. Li/Li+. Otherwise, the layered structure would be destroyed.27,28 In recent studies, this has been lithiated to a much greater extent. Thus its potential dropped to low voltages, approaching that of lithium metal. Consequently, Li-ion storage capacities over 1000 mA h g−1 could be delivered.29 However, a conversion reaction dominates the lithiation process, which will inevitably lead to some irreversible chemical and structural changes in MoS2. To alleviate the negative effects of the conversion reaction, some nano-structured MoS2 materials have been designed.30–35 A nano-structure has many merits. It can increase the surface contact between the electrode and the electrolyte, provide more space for embedded ions and shorten the ion migration path. On the other hand, MoS2 behaves like a semiconductor and its conductivity is not satisfactory. Thus many researchers have started synthesizing MoS2–carbon composite materials.36–46 The carbon source is effective in improving the conductivity and enhancing the structural stability of the material, and improving the cycle stability of batteries.
In this study, we constructed a high-voltage electric energy storage device composed of positive graphite and negative MoS2–C electrodes, together with an electrolyte solution of NaPF6 dissolved in propylene carbonate (PC) solvent. In this asymmetric electrochemical device, only the MoS2–C negative electrode involves Na+-storage. In contrast, the positive graphite electrode reversibly accommodates a considerable amount of PF6− at a high potential (4.9 V vs. Li/Li+). This concept is similar to “dual-ion” electric energy storage devices.47–50 In these electric energy storage devices, graphite and MoS2–C accumulate PF6− anions and Na+ cations separately, and do not share the same charge carrier. In addition, this Na-ion storage device has a lower cost, as sodium is substituted for lithium.
However, the charge storage mechanism at the MoS2–C negative electrode needs further clarification. A Na/MoS2–C battery actually behaves quite differently from the corresponding Li/MoS2–C battery, which can be deduced from a comparison between their charge–discharge curves. The storage mechanism of Na+ ions in MoS2–C negative electrodes has been investigated in this study.
In truth, there are really many reports about MoS2–carbon composites at present.36–46 However, the MoS2–carbon composites have not found practical applications in a complete energy storage device, especially a Na+-storage device. In short, the novelty of this study is the employment of a MoS2–carbon composite as the negative electrode to assemble a complete Na+-storage device for the first time. Moreover, this energy storage device exhibited outstanding electrochemical performance. We showed that this is a potential substitute for lithium-ion batteries in the future.
2. Experimental
2.1 Preparation of MoS2–C
Anhydrous sodium molybdate (Na2MoO4, supplied by Alfa Aesar Co. Ltd.), sulfocarbamide (CH4N2S, from Beijing Yili Fine Chemicals Co. Ltd.) and glucose (purchased from Beijing Chemical Works) were used as the starting materials. Firstly, 1.0 g Na2MoO4, 1.5 g CH4N2S and 4.0 g glucose were dissolved in 50 mL deionized water to form a well-mixed solution and then transferred into a sealed Teflon-lined autoclave and heated at 200 °C for 24 h. The product was collected by centrifugation and washed thoroughly with deionized water. After being dried, the product was heated at 800 °C in a stream of a mixed atmosphere of hydrogen and nitrogen (1![[thin space (1/6-em)]](https://www.rsc.org/images/entities/char_2009.gif) :
:![[thin space (1/6-em)]](https://www.rsc.org/images/entities/char_2009.gif) 9 by volume) for 2 h to obtain the final sample, MoS2–C composite.
9 by volume) for 2 h to obtain the final sample, MoS2–C composite.
As a comparison, glucose alone was treated under the abovementioned conditions as well and designated as “treated-glucose”. Commercial-MoS2 was purchased from Aladdin Chemistry Co. Ltd.
2.2 Characterizations of MoS2–C
X-ray diffraction (XRD) patterns were recorded on a Rigaku-Dmax 2500 diffractometer equipped with graphite monochromatized Cu Kα (λ = 0.154 nm) radiation at a scanning speed of 4° min−1 in the range of 5–75°. Scanning electron microscopy (SEM) images and energy dispersive X-ray (EDX) spectroscopy images were obtained using a Philips XL 30 and JEOL JSM-6700F microscopes. Transmission electron microscopy (TEM) images were produced with a Hitachi model H-8100 operating at 200 kV accelerating voltage. Nitrogen sorption measurements were performed at 77 K on a Micromeritics ASAP 2020 analyzer. The specific surface area (SSA) was calculated using the Brunauer–Emmett–Teller (BET) method, and the pore size distribution (PSD) was calculated from the desorption branch based on the Barrett–Joyner–Halenda (BJH) equation. Thermogravimetric analysis (TGA) was carried out with a STA 449 F3 Jupiter thermogravimetric analyzer (NETZSCH) in the temperature range from room temperature to 900 °C in air at a heating rate of 10 °C min−1.2.3 Fabrication of electrodes and cell assembly
MoS2–C (or treated-glucose or commercial MoS2) served as the negative, whereas graphite KS-6 (Timcal Co. Ltd., Switzerland) acted as the positive electrode material in the complete energy storage devices. The electrodes were fabricated by mixing electrode active materials with the conductive binder TAB (Teflonized acetylene black) homogeneously and pressing these onto stainless steel meshes (1 cm2 area). Then, the electrodes were dried in a vacuum at 130 °C for 5 h before assembling. The electrolyte was 1 M sodium hexafluorophosphate (NaPF6) dissolved in propylene carbonate (PC) solvent. All the cell assembly was carried out in an Ar-filled dry glove box (Mikrouna Co. Ltd.), in which the contents of both O2 and H2O were less than 0.5 ppm.2.4 Electrochemical measurements
The galvanostatic charge–discharge tests of the coin cells were performed at a constant current density of 166.7 mA g−1. Unless otherwise specified, the cut-off voltages were 0–3.7 V for the complete electric energy storage devices and 0–3.0 V for the Na/MoS2–C half batteries. The charge storage ability of a coin cell was expressed in the terms of the specific capacity (mA h g−1) of the negative electrode materials.Cyclic voltammetric tests were performed in a 3-electrode cell, which consisted of a MoS2–C electrode as the working electrode and two Na metal electrodes as both the counter and reference electrode. The electrolyte was 1 M NaPF6–PC. The potential of the working electrode (MoS2–C) was scanned between 0 and 3.0 V vs. Na.
3. Results and discussion
3.1 Characterization of MoS2–C
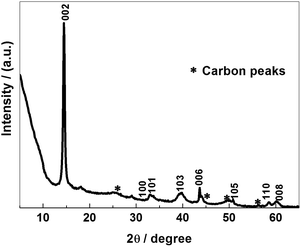
The crystal structure and phase composition of a MoS2–C sample were characterized by XRD, as shown in Fig. 1. The peaks could be attributed to 2H–MoS2 (JCPDS 37-1492) and carbon (JCPDS 75-2078). The peaks with 2θ at 14.4°, 32.9°, 33.7°, 39.7°, 43.9°, 49.6°, 58.5°and 60.1°are associated with (002), (100), (101), (103), (006), (105), (110) and (008) planes of hexagonal MoS2, respectively, whereas the peaks with 2θ at 26.3°, 46.5°, 49.2° and 54.2° belong to typical (111), (100), (110) and (222) planes of carbon, respectively. Moreover, the peak with 2θ at 14.4° is characteristic of the (002) plane of layered MoS2. Actually, calculating on the basis of the Bragg equation, the precise interlayer distance of the (002) plane is 0.61 nm. This value represents a slight shrinkage compared with the theoretical value of 0.62 nm. This should arise from the release of water molecules confined in the interlayer spaces after the calcination treatment. In addition, according to the well-known Scherrer equation, the average width of the MoS2 domains can be calculated as around 300 nm. On the other hand, the peaks from carbon are wide and weak, with even some splitting, which proves that the carbon sources exist in the form of amorphous carbon.SEM and TEM images of MoS2–C are displayed in Fig. 2. Its morphology is composed of many uniform sheets with a size of micrometer scale and stacked spheres. The sheets with a size of around 1–2 μm in length and 200–300 nm in width can be identified as MoS2. This value is in accordance with the XRD data. The stacked spheres with a diameter in the range 200–500 nm can be identified as carbon. EDX mapping of MoS2–C is also provided as Fig. S1 in ESI.† In Fig. 2(c), the narrow and thick areas can be confirmed as the images of the MoS2 phase. The wide and thin regions are associated with the images of carbon. The distinct diffraction circles indicate the good crystallization of the MoS2 phase. The HRTEM image in Fig. 2(d) depicts the layered structure of the crystalline MoS2 phase and the disordered structure of amorphous carbon clearly. The average inter-shell distance of the (002) plane of MoS2–C was measured to be around 0.61 nm, as marked in Fig. 2(d), which is consistent with the XRD data.
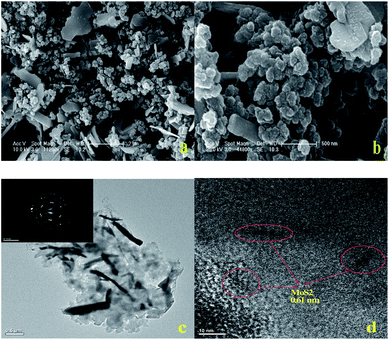 | ||
| Fig. 2 SEM images (a and b), TEM image and (inset) corresponding SAED pattern (c), and HRTEM image (d) of MoS2–C. | ||
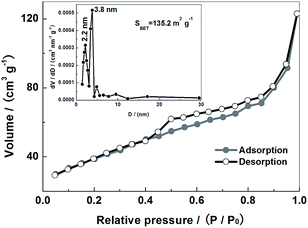
An equilibrium isotherm of a MoS2–C sample is shown in Fig. 3. The adsorption isotherm is typically of IUPAC Type IV shape. A distinct hysteresis loop and an adsorption–desorption plateau appear in a wide P/P0 range of 0.4–1.0. This implies that the surface of MoS2–C is abundant in meso-pores. As displayed in the inset, the B.E.T. specific surface area value of the MoS2–C sample is 135.2 m2 g−1. The pore size ranges from 2 to 20 nm and is concentrated around 2.2 and 3.8 nm.
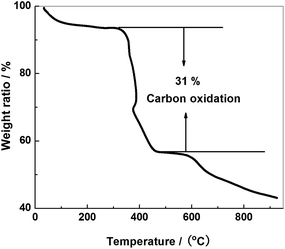
The TG curve is presented in Fig. 4. Carbon will be oxidized in the temperature range 350–500 °C. MoS2 will be converted to MoO3 at 400 °C. As shown in the figure, the weight ratio loss between 350 and 500 °C is about 34%. Considering both carbon and MoS2 oxidation, we conclude the carbon content to be around 31 wt%.
3.2 Electrochemical behavior of MoS2–C
The sodium storage ability of MoS2–C was evaluated by the charge–discharge curves of a Na/MoS2–C cell, as shown in Fig. 5. In the cell voltage range from 0 to 3 V, the MoS2–C electrode delivered initial discharge (sodium uptake) and charge (sodium release) capacities of 472.6 and 175 mA h g−1, respectively. After 50 cycles, its reversible capacity declined to around 122.4 mA h g−1, with a retention rate of about 70%. Herein, the charge–discharge behavior is different from the corresponding Li+-storage of a MoS2 electrode, which shows only one smooth plateau when Li+ is inserted into laminar MoS2. Therefore, we deduce that the Na+-storage process of MoS2–C differs somehow from its Li+-storage mechanism. The first discharge curve shows four plateaus at 0.3, 0.6, 0.8 and 2.3 V and the first charge curve shows some small plateaus. From the second cycle, dramatic changes in the discharge curves were observed. The plateau at 0.3 V disappeared and the other plateaus became faint. However, the reaction mechanism is not clear. The overpotential between the charge and discharge curves was also discovered. This should be attributed to the damage of the electrode material during the charge–discharge process in a wide voltage range (0–3 V).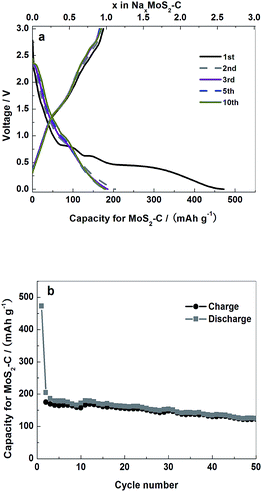 | ||
| Fig. 5 Initial charge–discharge curves (a) and cycling stability curves (b) for MoS2–C electrode between 3 and 0 V (vs. Na/Na+) at a current density of 0.083 A g−1. | ||
In order to clarify the charge storage mechanism of the MoS2–C negative electrode, a cyclic voltammetry (CV) test was employed. Fig. 6 shows the CV response of the MoS2–C negative electrode recorded at a scan rate of 0.2 mV s−1. There are four reduction peaks (0.25 V, 0.56 V, 0.75 V and 2.29 V) and three oxidation peaks (1.47 V, 2.36 V and 2.59 V) in the 1st cycle. From the second cycle, the reduction peak at 0.25 V disappears, the other redox peaks decrease gradually and the area of the CV curves corresponding to charge–discharge capacities also decreases. The CV measurements are in good agreement with the charge–discharge curves in Fig. 5(a).
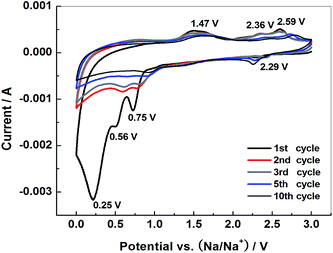 | ||
| Fig. 6 Cyclic voltammograms of MoS2–C electrode at 0.2 mV s−1 in the potential range 0–3 V (vs. Na/Na+). | ||
3.3 Performance of MoS2–C/graphite devices
Fig. 7(a) exhibits the initial charge–discharge curves of MoS2–C/graphite cells at a current density of 0.17 A g−1. The masses of the positive and negative electrode materials are equal. It is a “dual-ion” energy storage device. At the positive electrode, PF6− anions reversibly intercalate into the interlayer spaces of the graphite crystal lattice. At the negative electrode, Na+ intercalates into the layers of the MoS2–C electrode. Intercalation behavior makes the curves behave bend, differently with a sloping line due to an adsorption mechanism.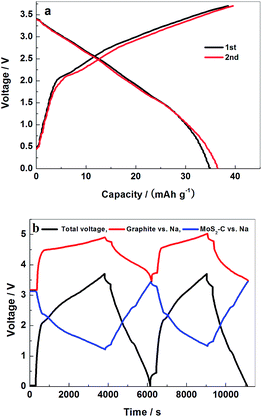 | ||
| Fig. 7 The initial two charge–discharge curves (a) and potential profiles (b) of MoS2–C/graphite cell in the voltage range 0–3.7 V at a current density of 0.17 A g−1. | ||
To analyze the respective electrochemical behaviors of the positive graphite and negative MoS2–C electrodes separately and precisely, we introduced a Na metal reference electrode into the MoS2–C/graphite cells. During the galvanostatic charge–discharge cycles between the MoS2–C and graphite electrodes of a complete cell, the “independent” potential profile of the MoS2–C or graphite electrode can be traced against the Na metal reference electrode, as shown in Fig. 7(b). Within a cell voltage range of 0–3.7 V, in the initial charge process the potential of the graphite positive electrode jumps swiftly to above 4.5 V against Na metal, which means that the low surface area of the graphite can scarcely adsorb PF6− anions. Then the rising trend of the charge curve slows down as PF6− anions start to be inserted into the interlayer space of graphite. This results in a bent shape of the potential profile, which extends to the ceiling potential around 4.9 V. On the other hand, the potential of the MoS2–C negative electrode initially drops to 2.4 V against Na metal. Then it gradually decreases from 2.4 to 1.2 V against Na metal.
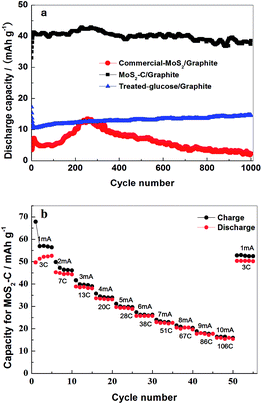
Fig. 8(a) shows the cycle performance of the MoS2–C/graphite cell at a current density of 0.17 A g−1. Within a cut-off voltage range of 0 to 3.7 V, at a mass ratio of 1, the long-term cycling stability is quite good, nearly 100% retention of capacity after 1000 cycles, maintaining a discharge capacity of 38.5 mA h g−1. The discharge capacity of the MoS2–C/graphite cell rises gradually for around the initial 10 cycles and then becomes stable, which may originate from the inadequate wetting of electrode particles by the electrolyte solution at the beginning stage. From the tests tracking the potentials of graphite and MoS2–C electrodes vs. Na metal reference electrodes in Fig. 7(b), the real potential range of a single electrode in a full capacitor can be precisely measured. It has been verified that the intercalation of PF6− at such a low level will not destroy the cycle performance of a graphite electrode at all. The potential of a MoS2–C negative electrode vs. Na remains above 1.2 V. When discharging to 1.2 V, the discharge capacity is less than 59 mA h g−1, which is equivalent to 0.36 mol Na+ intercalated per mol MoS2–C. The intercalation of Na+ at such a low level will not influence the structure of a MoS2–C electrode. Therefore, the MoS2–C/graphite cell exhibits good long-term cycle performance. Both its stability and capacity are superior to those of a commercial-MoS2/graphite cell. The contribution of carbon to the capacity was discussed as well. The discharge capacity in the first cycle is 8.5 and 32.5 mA h g−1 for treated-glucose/graphite and MoS2–C/graphite cells, respectively. Considering the weight ratio, the proportional contribution of carbon to the total discharge capacity was ascertained as about 8%.
Fig. 8(b) presents the rate capabilities of a MoS2–C/graphite device with a mass ratio of 1![[thin space (1/6-em)]](https://www.rsc.org/images/entities/char_2009.gif) :
:![[thin space (1/6-em)]](https://www.rsc.org/images/entities/char_2009.gif) 1 in the voltage range 0–3.7 V. At a 3 C rate, it delivers 49.7 mA h g−1. As shown in the figure, when the charge–discharge rate increases, the specific capacity decreases gradually. At a 106 C rate, its discharge capacity is 16 mA h g−1.
1 in the voltage range 0–3.7 V. At a 3 C rate, it delivers 49.7 mA h g−1. As shown in the figure, when the charge–discharge rate increases, the specific capacity decreases gradually. At a 106 C rate, its discharge capacity is 16 mA h g−1.
To further clarify the Na+-storage mechanism of a MoS2–C electrode, ex situ XRD and HRTEM measurements on a MoS2–C electrode in various processes have been carried out. As shown in Fig. 9 and S2,† there is almost no change in the XRD patterns and HRTEM images for the MoS2–C electrode during the first cycle. Therefore, it is verified that the structure of a MoS2–C electrode undergoes no variation during MoS2–C/graphite cell cycling. The charge storage mechanism of the MoS2–C electrode in a MoS2–C/graphite cell can be summarized as follows:
| xNa + MoS2–C → NaxMoS2–C (x ≤ 0.36, no change in MoS2–C). |
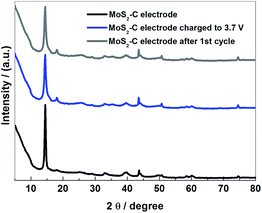 | ||
| Fig. 9 Ex situ XRD patterns of the MoS2–C electrode in the various stages of the charge–discharge process in MoS2–C/graphite cell. | ||
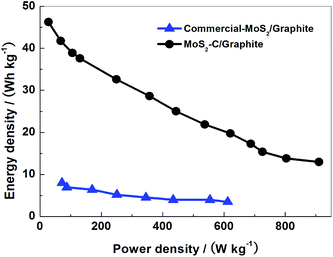
Ragone plots are displayed in Fig. 10. A MoS2–C/graphite cell can exhibit energy and power density values of 46.3 W h kg−1 and 910 W kg−1 based on the total mass of electrode active materials (MoS2–C and graphite). These values are apparently higher than those of commercial-MoS2/graphite cell.
4. Conclusions
A MoS2–C composite has been synthesized by a hydrothermal method and applied as a Na+ storage electrode material. In MoS2–C/graphite electric energy devices, a MoS2–C electrode can reversibly accommodate Na+ in a low-potential range, which causes no damage to the structure of MoS2–C. Thus MoS2–C/graphite devices possess excellent advantages such as a long cycle life and high energy and power densities.Acknowledgements
This study was financially supported by the National Basic Research Program of China (2011CB935702) and the Science & Technology Office of Jiangsu Province (BE2013006-3).Notes and references
- R. Q. Liu, D. Y. Li, C. Wang, N. Li, Q. Li, X. J. Lü, J. S. Spendelow and G. Wu, Nano Energy, 2014, 6, 73 CrossRef CAS PubMed.
- L. Y. Shao, J. Shu, M. M. Lao, X. T. Lin, K. G. Wu, M. Shui, P. Li, N. B. Long and Y. L. Ren, J. Power Sources, 2014, 272, 39 CrossRef CAS PubMed.
- G. H. Qin, H. J. Zhang and C. Y. Wang, J. Power Sources, 2014, 272, 491 CrossRef CAS PubMed.
- X. J. Lü, G. Wu, J. W. Howard, A. P. Chen, Y. S. Zhao, L. L. Daemen and Q. X. Jia, Chem. Commun., 2014, 50, 11520 RSC.
- X. G. Ma, X. L. Huang, J. D. Gao, S. Zhang, Z. L. Peng, Z. H. Deng and J. S. Suo, J. Power Sources, 2014, 272, 259 CrossRef CAS PubMed.
- X. L. Liao, Q. M. Huang, S. W. Mai, X. S. Wang, M. Q. Xu, L. D. Xing, Y. H. Liao and W. S. Li, J. Power Sources, 2014, 272, 501 CrossRef CAS PubMed.
- S.-W. Kim, D.-H. Seo, X. Ma, G. Cedar and K. Kang, Adv. Energy Mater., 2012, 2, 710 CrossRef CAS.
- B. L. Ellis and L. F. Nazar, Curr. Opin. Solid State Mater. Sci., 2012, 16, 168 CrossRef CAS PubMed.
- V. Palomares, P. Serras, I. Villaluenga, K. B. Hueso, J. Carretero-Conzález and T. Rojo, Energy Environ. Sci., 2012, 5, 5884 CAS.
- N. Yabuuchi, M. Kajiyama, J. Iwatate, H. Nishikawa, S. Hitomi, R. Okuyama, R. Usui, Y. Yamada and S. Komaba, Nat. Mater., 2012, 11, 512 CrossRef CAS PubMed.
- S. Komaba, N. Yabuuchi, T. Nakayama, A. Ogata, T. Ishikawa and I. Nakai, Inorg. Chem., 2012, 51, 6211 CrossRef CAS PubMed.
- Z. Lu and J. R. Dahn, J. Electrochem. Soc., 2001, 148, A1225 CrossRef CAS PubMed.
- S. Komaba, C. Takei, T. Nakayama, A. Ogata and N. Yabuuchi, Electrochem. Commun., 2010, 12, 355 CrossRef CAS PubMed.
- R. Berthelot, D. Carlier and C. Delmas, Nat. Mater., 2011, 10, 74 CrossRef CAS PubMed.
- A. Abouimrane, W. Weng, H. Eltayeb, Y. Cui, J. Niklas, O. Poluektov and A. Amine, Energy Environ. Sci., 2012, 5, 9632 CAS.
- S. Komaba, W. Murata, T. Ishikawa, N. Yabuuchi, T. Ozeki, T. Nakayama, A. Ogata, K. Gotoh and K. Fujiwara, Adv. Funct. Mater., 2011, 21, 3859 CrossRef CAS.
- J. Jin, S. J. Yu, Z. Q. Shi, C. Y. Wang and C. B. Chong, J. Power Sources, 2014, 272, 800 CrossRef CAS PubMed.
- Y. Q. Ge, H. Jiang, K. Fu, C. H. Zhang, J. D. Zhu, C. Chen, Y. Lu, Y. P. Qiu and X. W. Zhang, J. Power Sources, 2014, 272, 860 CrossRef CAS PubMed.
- L. L. Si, Z. Q. Yuan, L. Hu, Y. C. Zhu and Y. T. Qian, J. Power Sources, 2014, 272, 880 CrossRef CAS PubMed.
- J. W. Lee, Y. M. Chen, Y. Zhu and B. D. Vogt, ACS Appl. Mater. Interfaces, 2014, 6, 21011 CAS.
- J. Billaud, R. J. Clement, A. R. Armstrong, V. Canales-Vazquez, P. Rozier, C. P. Grey and P. G. Bruce, J. Am. Chem. Soc., 2014, 136, 17243 CrossRef CAS PubMed.
- D. A. Stevens and J. R. Dahn, J. Electrochem. Soc., 2000, 147, 1271 CrossRef CAS PubMed.
- D. A. Stevens and J. R. Dahn, J. Electrochem. Soc., 2000, 147, 4428 CrossRef CAS PubMed.
- R. Alcántara, P. Lavela, G. F. Ortiz and J. L. Tirado, Electrochem. Solid-State Lett., 2005, 8, A222 CrossRef PubMed.
- L. P. Zhao, H. Y. Wang and L. Qi, J. Inorg. Mater., 2013, 28, 831 CrossRef CAS.
- R. R. Haering, J. A. R. Stiles and K. Brand, US Pat. 4281048, 1981, vol. 7.
- F. C. Laman and K. Brandt, J. Power Sources, 1988, 24(3), 195 CrossRef CAS.
- K. Kumai, T. Ikeya, K. Ishihara, T. Iwahora and N. manishi, J. Power Sources, 1997, 70(2), 235 CrossRef.
- K. Chang and W. X. Chen, J. Mater. Chem., 2011, 21(43), 17175 RSC.
- X. Y. Xu and X. G. Li, Chin. Chem. Lett., 2003, 14, 759 CAS.
- J. Chen, S. L. Li and Z. L. Tao, J. Alloys Compd., 2003, 356–357, 413 CrossRef CAS.
- H. Li, W. J. Li, L. Ma, W. X. Chen and J. M. Wang, J. Alloys Compd., 2009, 471(1–2), 442 CrossRef CAS PubMed.
- J. Xiao, X. J. Wang, X. Q. Yang, S. D. Xun and G. Liu, Adv. Funct. Mater., 2011, 21(15), 2840 CrossRef CAS.
- Y. Chen, J. Lu, S. Wen, L. Lu and J. M. Xue, J. Mater. Chem. A, 2014, 2, 17857 CAS.
- D. K. Nandi, U. K. Sen, D. Choudhury, S. Mitra and S. K. Sarkar, Electrochim. Acta, 2014, 146, 706 CrossRef CAS PubMed.
- K. Chang, W. X. Chen, L. Ma and H. Li, J. Mater. Chem., 2011, 21(17), 6251 RSC.
- Z. M. Wan, J. Shao, J. J. Yun, H. Y. Zheng, T. Gao, M. Shen, Q. T. Qu and H. H. Zheng, Small, 2014, 10, 4975 CrossRef CAS PubMed.
- J. M. Jeong, K. G. Lee, S. J. Chang, J. W. Kim, Y. K. Han, S. J. Lee and B. J. Choi, Nanoscale, 2014, 7, 324 RSC.
- H. H. Yuan, J. Y. Li, C. Yuan and Z. He, ChemElectroChem, 2014, 1, 1828 CrossRef CAS.
- L. Ma, J. B. Ye, W. X. Chen, D. Y. Chen and J. Y. Lee, Nano Energy, 2014, 10, 144 CrossRef CAS PubMed.
- W. H. Liu, S. L. He, Y. Wang, Y. Dou, D. J. Pan, Y. Feng, G. Qian, J. Z. Xu and S. D. Miao, Electrochim. Acta, 2014, 144, 119 CrossRef CAS PubMed.
- C. Y. Zhao, J. H. Kong, L. P. Yang, X. Y. Yao, S. L. Phua and X. H. Lua, Chem. Commun., 2014, 50, 9672 RSC.
- L. R. Hu, Y. M. Ren, H. X. Yang and Q. Xu, ACS Appl. Mater. Interfaces, 2014, 6, 14644 CAS.
- Y. Wang, G. Z. Xing, Z. J. Han, Y. M. Shi, J. I. Wong, Z. X. Huang, K. Ostrikov and H. Y. Yang, Nanoscale, 2014, 6, 8884 RSC.
- Y. X. Wang, S. L. Chou, D. Wexler, H. K. Liu and S. X. Dou, Chem.–Eur. J., 2014, 20, 9607 CrossRef CAS PubMed.
- H. S. Li, X. Y. Wang, B. Ding, G. Pang, P. Nie, L. F. Shen and X. G. Zhang, ChemElectroChem, 2014, 1, 1118 CrossRef CAS.
- G. C. Amatucci, F. Badway, A. D. Pasquier and T. Zheng, J. Electrochem. Soc., 2001, 148, A930 CrossRef CAS PubMed.
- A. K. Thapa, G. Park, H. Nakamura, T. Ishihara, N. Moriyama, T. Kawamura, H. Wang and M. Yoshio, Electrochim. Acta, 2010, 55, 7305 CrossRef CAS PubMed.
- T. Placke, O. Fromm, S. F. Lux, P. Bieker, S. Rothermel, H. W. Meyer, S. Passerini and M. Winter, J. Electrochem. Soc., 2012, 159, A1755 CrossRef CAS PubMed.
- L. P. Zhao, L. Qi and H. Y. Wang, J. Power Sources, 2013, 242, 597 CrossRef CAS PubMed.
Footnote |
| † Electronic supplementary information (ESI) available. See DOI: 10.1039/c4ra14868a |
| This journal is © The Royal Society of Chemistry 2015 |

