Simultaneous preparation of nano silica and iron oxide from palm oil fuel ash and thermokinetics of template removal
M. Irfan Khana,
Khairun Azizli*a,
Suriati Sufiana,
Zakaria Mana and
Aamir Sada Khanab
aUniversiti Teknologi PETRONAS, Department of Chemical Eng., Malaysia. E-mail: khairun_azizli@petronas.com.my
bDepartment of chemistry, UST Bannu, Pakistan
First published on 13th February 2015
Abstract
Nanomaterials have potential applications in the fields of catalysis, drug delivery, nanocomposites, and nanofluids. This study suggests a method for simultaneous preparation of nano silica and iron oxide from palm oil fuel ash (POFA). First, POFA was leached out with H2SO4 followed by alkali (NaOH) leaching. Basification (pH = 14) of the filtrate of the first leaching process produced iron oxide, while acidification of the alkali leachate produced nano silica. Addition of polymeric surfactant polyethylene glycol (PEG MW 20![[thin space (1/6-em)]](https://www.rsc.org/images/entities/char_2009.gif) 000) resulted in deagglomeration of the silica nanoparticles. Silica nanoparticles with sizes in the range of 20–80 nm, surface area of 326 m2 g−1, and pore diameter of 8.2 nm were obtained. Thermokinetic and thermodynamic studies of template (PEG) removal from the silica matrix were performed using the Kissinger and Ozawa methods based on model-free kinetics. The activation energy of PEG decreased from 330 kJ mol−1 to 140 kJ mol−1 when it was used as a template; this result demonstrates the lack of chemical bonding between the surfactant and silica. The findings are supported by the Fourier-transform infrared spectra of the PEG–silica composites.
000) resulted in deagglomeration of the silica nanoparticles. Silica nanoparticles with sizes in the range of 20–80 nm, surface area of 326 m2 g−1, and pore diameter of 8.2 nm were obtained. Thermokinetic and thermodynamic studies of template (PEG) removal from the silica matrix were performed using the Kissinger and Ozawa methods based on model-free kinetics. The activation energy of PEG decreased from 330 kJ mol−1 to 140 kJ mol−1 when it was used as a template; this result demonstrates the lack of chemical bonding between the surfactant and silica. The findings are supported by the Fourier-transform infrared spectra of the PEG–silica composites.
Introduction
Bioenergy, which is energy obtained from biomass, has been emphasized in modern research as a substitute for fossil fuel-based energy; biofuels offer the advantages of renewability and green combustion. Currently, the contributions of bio energy in terms of heat, fuels, and power are estimated to be as high as 15% of the total global power supply. Other projections estimate that 33–50% of the world's energy demands will be fulfilled by biomass by the middle of the 21st century. Generation of 476 million tons of biomass ash (BA) has been forecasted as biomass combustion becomes one of the major methods used for energy production.1 Malaysia, as the second-largest producer of palm oil in the world, has focused on developing bioenergy from palm oil mill wastes. Other than biofuels derived from palm oil, one of the mostly utilized process include power plants, based on burning of palm tree residues.2 Solid ultrafine ash obtained from combustion of palm kernels and bunches in palm oil mills at temperatures of 800–1000 °C is called palm oil fuel ash (POFA).3 As palm oil production increases, a gradual increase in POFA production may be expected. POFA production in 2010 was reportedly as high as 4 million tons compared with the 3 million tons produced in 2007.2,4 POFA, like other BAs, is composed mainly of inorganic oxides, along with unburnt and semi-burnt organic materials that depend on the palm residue and combustion conditions inside the boiler.3 Ecologically benign disposal and valuable applications are two main considerations for POFA and other BAs. Dumping in lowlands, as a common practice, has received criticism from local communities and ecologists because of the persistence and resistance to decomposition of POFA. Moreover, increasing prices of solid waste disposal have emphasized the importance of the need to transform POFA into valuable end-products and processes for application in various industries.5POFA has recently been applied as an effective adsorbent for purification of polluted water and air; significant adsorption of different dyes, for example, has been achieved using modified POFA with adsorption capacities of as high as 400.01 and 423.5 mg g−1.6,7 Introduction of POFA as an auxiliary cementing material has resulted in reductions in water permeability and porosity of concrete, thereby leading to substantial corrosion resistance.8,9 Novel POFA-based geopolymers were recently introduced as potential green cementing materials. POFA utilization as a primary raw material for geopolymerization is hindered by the high SiO2 and very low Al2O3 contents of the material.2,4
The emergence of nano and mesoporous silica materials and their manipulation for use in adsorption, catalysis, drug delivery, sensors, nano casting templates, and sustainable raw materials for the synthesis of nanostructured silicon for Li-ion battery anodes, among others, have led researchers to explore newer and cheaper resources of silica.10 Alkyl silicates, e.g., tetraethyl orthosilicate (TEOS), are the most widely used precursors utilized for nano silica synthesis, but they are expensive and release organic alcohols as by-products.11 As well, the environmentally hazardous process of sodium silicate synthesis limits its application as precursor for SiO2 synthesis. Thus, researchers have sought to determine new sustainable materials for silica preparation.12 Rice husk ash was recently found to be a sustainable source of silica because it is composed of highly reactive amorphous silica.13,14 With a chemistry similar to that of rice husk ash, POFA may potentially be utilized as a sustainable source of nano silica and subsequent silicon nanostructures. Besides nano silica, POFA can also be used for extracting oxides of calcium, iron, and aluminum because it contains considerable amounts of these oxides. Compared with rice husk ash, however, the potential application of POFA as a source material for synthesis of valuable nano oxides has not received adequate attention from the research community.12
In this work, issues related to the environmental nuisance presented by POFA are addressed by synthesizing silica nanoparticles and iron oxide through the template-free and polyethylene glycol (PEG-20![[thin space (1/6-em)]](https://www.rsc.org/images/entities/char_2009.gif) 000)-templating methods. This study also discusses the thermokinetics and thermodynamics of the template removal from the silica–PEG complex. Although PEG has been reported in previous literature as a valuable templating agent for high-surface area silica synthesis, to the best of our knowledge, thermokinetic and thermodynamic studies of its removal have yet to be published.15
000)-templating methods. This study also discusses the thermokinetics and thermodynamics of the template removal from the silica–PEG complex. Although PEG has been reported in previous literature as a valuable templating agent for high-surface area silica synthesis, to the best of our knowledge, thermokinetic and thermodynamic studies of its removal have yet to be published.15
Thermally treated POFA was subjected to acid leaching followed by alkali leaching. The filtrate of the first leaching process was converted into iron oxide, while the second filtrate was utilized to produce silica nanoparticles. Products were confirmed by scanning electron microscopy (SEM) and transmission electron microscopy (TEM), X-rays diffraction (XRD) and infra-red spectroscopy. The thermal kinetics and thermodynamics of decomposition of PEG were investigated using model-free kinetics methods based on DTG technique.
Experimental
Materials
Grayish POFA was collected from a local Malaysian power plant, and its chemical composition was determined by X-ray fluorescence spectrophotometry (XRF), as shown in Table 1. NaOH (99%, Merck Millipore) pellets were used to prepare NaOH solutions using deionized water; these solutions were standardized against oxalic acid. Alkali solutions were stored in polyethylene containers to avoid glass contamination. The nitric acid (68%) and sulfuric acid (98%) used in this study were procured from Merck Millipore, Malaysia. PEG (MW 20![[thin space (1/6-em)]](https://www.rsc.org/images/entities/char_2009.gif) 000, Merck Millipore) was utilized as structure-directing group (templating agent).
000, Merck Millipore) was utilized as structure-directing group (templating agent).
| SiO2 | CaO | Al2O3 | K2O | Fe2O3 | MgO | P2O5 | Minor components | Loss on ignition |
|---|---|---|---|---|---|---|---|---|
| 55 | 5.5 | 5.4 | 5.4 | 4.7 | 3.5 | 3.4 | 1.1 | 16 |
Methods
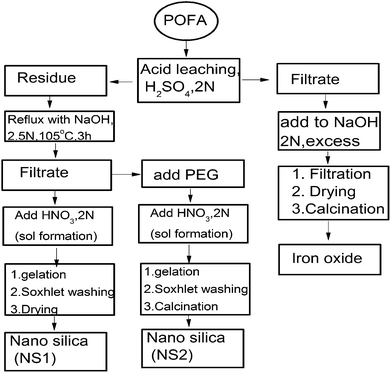
In this experiment, APOFA (10 g) was treated with NaOH (80 mL) of known normality for a certain time and temperature in a round bottom flask with constant stirring at 200 rpm. After reaction, the sample was hot-filtered by suction filtration and rinsed with deionized water (3 × 40 mL). HNO3 (2 M) was added dropwise to the filtrate with continuous stirring at 200 rpm until formation of a white silica sol. This sol was aged for 24 h at room temperature and then washed with HNO3 (0.05 N) in a Soxhlet apparatus for 60 min. The silica formed was designated as NS1 and was characterized using analytical techniques.
In another experiment, PEG (2 g) was dissolved in the hot alkaline filtrate with vigorous stirring and then cooled to room temperature (25 °C). HNO3 (2 M) was added dropwise to the filtrate, resulting in the formation of a nano silica sol. Salt-free silica sol was dried overnight at 60 °C and designated as PEG–SiO2. The dried, white, amorphous powder formed was sintered at 600 °C for 6 h in a furnace (Protherm, Turkey) to remove PEG leading to the formation of nano silica. The nano silica formed through this procedure was designated as NS2 and analysed through various instrumental techniques. A detailed methodology is given in Fig. 1.
Characterization
Infrared analyses of the raw materials and end-products were performed on a Spectrum One instrument (Perkin Elmer, USA) at a scanning rate of 32 scans per sample, using the KBr pellet method. To investigate the crystallinity of the powdered material, X-ray diffraction (XRD) was carried out on an X-ray diffractometer (D8 Advance, Bruker, Germany) at a scanning rate of 2° min−1 over the 2θ range of 2–80° using a Cu anode. To determine the surface area, pore diameter and pore volume of NS1, NS2, Iron oxide and POFA, N2 adsorption/desorption isotherms were measured by a surface area and porosity analyzer (ASAP, 2020, Micromeritics).The morphology and microstructure of the iron oxide and nano silica were investigated using a field emission scanning electron microscope (Zeiss Supra 55VP, Germany). Dry powder was fixed onto aluminum stub using carbon tape and was observed under electron microscope at different magnifications. To determine the exact size of grains and their boundaries, a transmission electron microscope (Zeiss Libra 200FE, Germany) was used at a reduced pressure of 7 mbar. Prior to TEM analysis, samples were sonicated in isobutanol for 30 min. Thermal analysis of the pure polymer (PEG-20![[thin space (1/6-em)]](https://www.rsc.org/images/entities/char_2009.gif) 000) and PEG–SiO2 were carried out on a simultaneous thermogravimetric analyser (STA 6000, Perkin Elmer, USA) in the temperature range of 50–800 °C. Analyses were conducted at heating rates of 15, 20, 30 and 40 °C min−1 under an inert atmosphere (N2). Thermograms (TGs) and corresponding derivative (DTG) curves were plotted using built-in software. The variations of the thermal profile with heating rates were used to investigate the kinetics and thermodynamics of the template removal from PEG–SiO2.
000) and PEG–SiO2 were carried out on a simultaneous thermogravimetric analyser (STA 6000, Perkin Elmer, USA) in the temperature range of 50–800 °C. Analyses were conducted at heating rates of 15, 20, 30 and 40 °C min−1 under an inert atmosphere (N2). Thermograms (TGs) and corresponding derivative (DTG) curves were plotted using built-in software. The variations of the thermal profile with heating rates were used to investigate the kinetics and thermodynamics of the template removal from PEG–SiO2.
 | (1) |
 | (2) |
| dα/dt = k(T)f(α) | (3) |
 | (4) |
 | (5) |
The conversion function f(α) for a solid-state material depends on the reaction mechanism and can generally be written as follows:
| f(α) = αm(1 − α)n[−ln(1 − α)]p | (6) |
When the temperature increases at a constant rate, β can be defined as the heating rate:
 | (7) |
Eqn (5) can be written as;
 | (8) |
Eqn (8) shows the rate of degradation of a substance as a function of temperature. This equation is a fundamental equation and used for calculation of kinetics parameters. In this work, kinetic parameters were obtained from the non-isothermal DTG technique by using the Kissinger (ASTM E-698) and Ozawa methods. These methods require multiple TGA runs with varying β to calculate the kinetic parameters of a reaction without prior knowledge of the reaction mechanism.
Kissinger method (ASTM E-698). Kissinger developed a model-free, non-isothermal method to calculate the Ea and ln
![[thin space (1/6-em)]](https://www.rsc.org/images/entities/char_2009.gif) A for a thermal conversion using DTG peaks' temperatures. This method allows calculation of Ea and ln
A for a thermal conversion using DTG peaks' temperatures. This method allows calculation of Ea and ln![[thin space (1/6-em)]](https://www.rsc.org/images/entities/char_2009.gif) A from a plot of ln(β/Tm2) against 1000/Tm by using eqn (9) for a series of experiments with different β, where Tm is the peak temperature of the DTG curve representing maximum conversion rate;21
A from a plot of ln(β/Tm2) against 1000/Tm by using eqn (9) for a series of experiments with different β, where Tm is the peak temperature of the DTG curve representing maximum conversion rate;21
 | (9) |
Ea can be calculated from the slope of the plot, which is equal to –Ea/R, and A can be calculated from the intercept using eqn (10).
 | (10) |
Ozawa method. Similar to the Kissinger method, Ozawa proposed another method to calculate thermokinetics parameters of thermal conversion using TGA data.22 Although this method is an integral one, but it can be applied to DTG curves.23 In this method, Ea and A are calculated from the slope and intercept of the plot of ln
![[thin space (1/6-em)]](https://www.rsc.org/images/entities/char_2009.gif) β versus 1000/T using eqn (11), respectively.
β versus 1000/T using eqn (11), respectively.
 | (11) |
 | (12) |
Eqn (12) can be modified as
 | (13) |
| B = kB/h = 0.20836 × 10¹¹ K−1 s−1 | (14) |
| ΔH = Eα − RTm | (15) |
 | (16) |
| ΔG = ΔH − TmΔS | (17) |
Using eqn (15)–(17), the thermodynamic parameters of the activated complex may be calculated using Tm in the DTG curve so that the values of ΔG, ΔH and ΔS are related to the highest rate process.
Results and discussion
Iron oxide synthesis
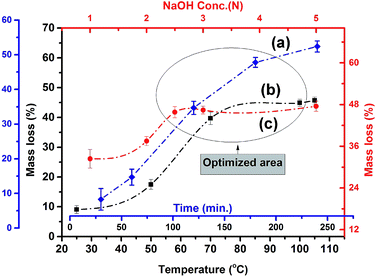
POFA consists of considerable amount of crystalline silicon oxide along with amorphous oxides of silicon, iron, aluminum, and calcium. As such, preparation steps for extracting nano silica from POFA are not identical to those for extracting silica from rice husk and rice husk ash.Acid treatment of sintered POFA leads to successive leaching of these metallic oxides leaving behind silicon oxide. Fig. 2 shows the acid leaching process of POFA at varying temperatures, reaction times, and acid concentrations.
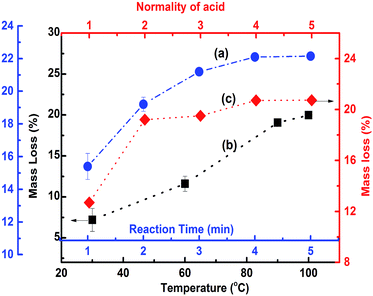 | ||
| Fig. 2 The mass loss profile of POFA during acid treatment. Curves a, b, and c show the extent of mass loss (%) of POFA with respect to time, temperature and acid concentration, respectively. | ||
Curve “a” in Fig. 2 represents the extent of mass loss of POFA with respect to time at 100 °C with H2SO4 (2 N). The dissolution of POFA increases gradually with increase in reaction time until 3 hours and afterwards minor change are occurred in the dissolution profile of POFA. Therefore 3 hours reaction time was found most adequate for this process. Moreover, as shown in Fig. 2 (black line), the maximum amount of material was leached out of POFA at 100 °C when POFA was treated for 3 hours with 2 N H2SO4. There was a gradual increase in POFA leaching with temperature and 100 °C was considered as adequate as reflux started at that temperature.
Approximately, 19.5% of the POFA was extracted using 2 N H2SO4 at 100 °C for 3 h. An increase in mass loss of 1.5% was observed when acid strength was increased from 2 N to 5 N and other conditions were held constant i.e. reaction time of 3 h and temperature of 100 °C. A maximum mass loss of 21% was achieved within 3 h of refluxing at 100 °C with 5 N H2SO4. The acid solubility of POFA appeared to be a function of temperature, time and acid concentration. Thus, a temperature of 100 °C, acid concentration of 2 N, and reaction time of 3 h were determined as optimal reaction conditions.
Acid leachate was precipitated with NaOH (2 N) to obtain iron oxide. This method is pH-selective, and products of various compositions may be formed at different pH. At pH = 14, the major products obtained from the leachate included iron oxides with impurities of aluminum and calcium oxide; by contrast, at pH below 10, the predominant product is aluminium oxide with some silica.25 As determined by EDX, there was 6.7 weight% of Al which was removed by washing the product with alkaline water.
In this method, acid dissolves the iron oxide along with aluminium and calcium oxides of POFA.25 Sodium hydroxide reacts with iron salts leading to formation of iron hydroxide that is dehydrated at calcination forming iron oxide.26 The reactions involved in this process may be written as:
| H2SO4 + Fe2O3 → Fe2(SO4)3 + H2O | (18) |
| Fe2(SO4)3 + NaOH → Fe(OH)3 + Na2SO4 | (19) |
| Fe(OH)3 → Fe2O3 + H2O | (20) |
Synthesis of nano silica
Alkali dissolution of amorphous silica and subsequent precipitation with acid was performed for nano silica preparation.27 The effects of reaction time, temperature, and concentration of the alkali solution on APOFA dissolution are shown in Fig. 3. POFA's dissolution was observed to occur as a function of time, temperature, and alkali concentration. A gradual increase in silica dissolution was observed with increasing reaction time (curve a). A reaction time of 180 min was found to be the most productive, as no further increases in dissolution were observed even when the reaction time was extended to 240 min in 2.5 N NaOH at 105 °C as evident from Fig. 3 (curve a).The most suitable temperature for dissolution of APOFA was found to be 105 °C, and no further increase in the dissolution was observed even when temperature was increased to 110 °C in a 2.5 N NaOH for 180 min reaction (curve b).
Moreover, improved dissolution was observed when the alkali concentration was increased from 1 N to 2.5 N. No further increase in dissolution was observed when the alkali concentration was further increased to 5 N at 105 °C and 180 min (curve c). The results thus far show that most of the amorphous silica is leached out by 2.5 N NaOH at 105 °C and 180 min reaction time. Highly alkaline solutions were avoided being promoting corrosion of the glass reaction assemblies.
In this study, 2.5 N NaOH, 180 minutes reaction time and 105 °C reaction temperature were found the optimal conditions for the extraction of nano silica from POFA.
Alkali reacts with amorphous silica in POFA at a 2![[thin space (1/6-em)]](https://www.rsc.org/images/entities/char_2009.gif) :
:![[thin space (1/6-em)]](https://www.rsc.org/images/entities/char_2009.gif) 1 molar ratio producing sodium silicate. Thus, the optimized values are in accordance with the stoichiometric composition of POFA.
1 molar ratio producing sodium silicate. Thus, the optimized values are in accordance with the stoichiometric composition of POFA.
Silica leaching is controlled by the diffusion of hydroxide in reactive grains and its absorption on solid surface. The diffusion of hydroxide enhances with the alkalinity and the solution's ionic strength.28
Reactions taking place during this procedure may be written as follows:
| 2NaOH + SiO2 → Na2SiO3 + H2O | (21) |
| Na2SiO3 + HNO3 → SiO2 + NaNO3 + H2O | (22) |
FTIR analyses
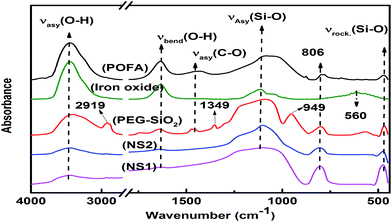
FTIR analyses of the starting material and resulting products are shown in Fig. 4. Two peaks can be confirmed in all samples, i.e., absorption bands at ∼3400 and ∼1640 cm−1, which correspond to asymmetric stretching and bending vibrations of O–H bonds attributed either to water or silanol groups.29 POFA showed peaks at 1432, 1106, 806, and 465 cm−1 and, most of these peaks were also produced by nano silicas, such as PEG–SiO2, NS1, and NS2; these results show that POFA is mainly composed of silica consistent with XRF analysis (Table 1). The vibration band at 1432 cm−1 represents the C–O bonds of calcite in the POFA.29Pure silica exhibited three typical peaks at around 1100, 800, and 450 cm−1 because of asymmetric and symmetric stretching and rocking vibrations of siloxane (Si–O–Si) bonds.30 In PEG–SiO2, small peaks at 2919 and 1432 cm−1 attributed to C–H and C–O asymmetric stretching vibrations, respectively, were observed. These peaks confirm the presence of PEG within the silica matrix. The presence of O–H bands in PEG–SiO2 reveals no chemical reaction between PEG and silanol groups. FTIR analyses confirmed the extraction of iron oxide and silica from POFA.
A peak at 560 nm in the iron oxide spectrum was attributed to Fe–O bending vibrations, which confirm the presence of hematite.30 Although FTIR analysis confirmed the extraction of silica and iron oxide from POFA, XRD is necessary to verify the amorphous nature of these products, as discussed in next section.
XRD analysis
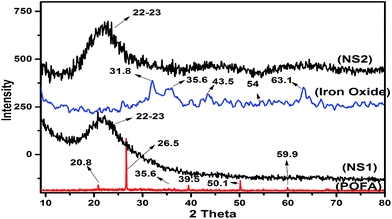
To confirm the amorphous nature and phases of nano silica and iron oxide particles, XRD was employed. Fig. 5 presents diffractograms of POFA, iron oxide, NS1, and NS2. POFA showed a complex pattern that reflects its various components. The presence of quartzite was confirmed by peaks at 20.8°, 26.5°, 39.5°, 50.1°, and 59.9°, which are consistent with ICOD-00-046-1045. The presence of Fe2O3 (hematite) and calcite were confirmed by small peaks at 35.6° and 43.14°, consistent with ICOD-00-033-0664 and ICOD-00-005-0586, respectively. The presence of less intense peaks reveals trace amounts of these mineral phases. Quartz formation resulted from high-temperature (>700 °C) burning of palm biomass wastes. XRD patterns of the nano silica (NS1 and NS2) showed broad peaks in the range of 20–25° and centered at 23°; these peaks confirm the amorphous nature of the silica. Similar XRD patterns have been reported by several researchers as evidence of the amorphousity of the nano silica.31,32 Silica's amorphousity is controlled by the calcination temperature and time. Calcination at temperature higher than 700 °C resulted in the conversion of amorphous silica to quartzite. Quartz is considered as a very stable and inactive phase of silica without clear applicability in composites, cements, concretes, geopolymers, or silicon synthesis.10,33 The XRD pattern of iron oxide shows a broad hump in the region of 2θ = 30–40°, which represents the semi crystalline behavior of the material. The presence of peaks at 35.6°, 54.0°, and 63.1° confirms the presence of hematite in accordance with ICOD-00-033-0664.The results thus far demonstrate that POFA has a multi components composition with a considerable amount of inactive quartzite. Nano silica formed with application of a templating agent showed XRD patterns similar to the silica obtained without the template; such results confirm that the PEG template does not affect the crystallinity of the resultant nano silica.12 Although XRD provided detailed information of the phases present in the materials of interest, the patterns obtained do not explain the effects of PEG on the morphology and surface profile of nano silica. Surface profile and porosity analyses are discussed in next section.
Surface area and BET analysis
Fig. 6a–d shows the N2 adsorption/desorption isotherms of POFA, iron oxide, NS1, and NS2, respectively. The adsorption and desorption lines of POFA overlap to show a type I isotherm. Such behavior is produced by microporous materials.34 Iron oxide, NS1, and NS2 demonstrate hysteresis loops in their adsorption–desorption isotherms. These loops represent a type IV isotherm, which is a fingerprint of mesoporous materials. Therefore, the silica and iron oxide produced in this work are mesoporous in nature. The pore size distribution shifted to 8.2 nm when PEG-20![[thin space (1/6-em)]](https://www.rsc.org/images/entities/char_2009.gif) 000 was used as a templating agent as given in PSD curve in Fig. 6c. It is reported that the amount of PEG used inversely influenced the mesopore size of the silica sample.12
000 was used as a templating agent as given in PSD curve in Fig. 6c. It is reported that the amount of PEG used inversely influenced the mesopore size of the silica sample.12
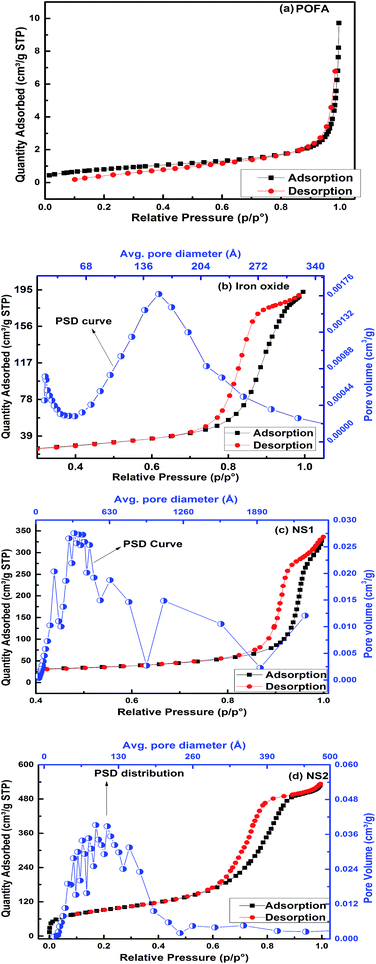 | ||
| Fig. 6 Nitrogen adsorption and desorption isotherms and pore size distribution analyses of (a) POFA, (b) iron oxide, (c) NS1, and (d) NS2. | ||
Table 2 presents the textural properties of the POFA and the nanoparticles. Surface area of NS2 reached to 326 m2 g−1 when the PEG template was used compared to 87.6 m2 g−1 for NS1, which is comparable with the reported surface areas (330–955 m2 g−1) of RH-based silicas.1,3–9 The surface areas of iron oxide and NS1 are 81.2 and 87.6 m2 g−1 respectively. The surface area of the mesoporous material depends on the pore size and pore volume. NS2 has a smaller pore size of 8.2 nm compared with NS1 (23.7 nm); this result reveals that PEG not only deagglomerates silica particles but also affects the pore size and volume of the resultant product. Thus, we can conclude that mesoporous silica and iron oxide with moderate surface areas can be prepared from POFA. PEG has previously been used as a mesopore-directing agent during synthesis of mesoporous silica, SBA 15 and other similar structures.12,32
| BET surface area (m2 g−1) | Pore volume (cm3) | Pore diameter (nm) | |
|---|---|---|---|
| POFA | 2.86 | 0.014 | 16.8 |
| NS1 | 87.6 | 0.48 | 23 |
| NS2 | 326 | 0.75 | 8.2 |
| Iron oxide | 81.3 | 0.30 | 13.9 |
Microstructural analysis
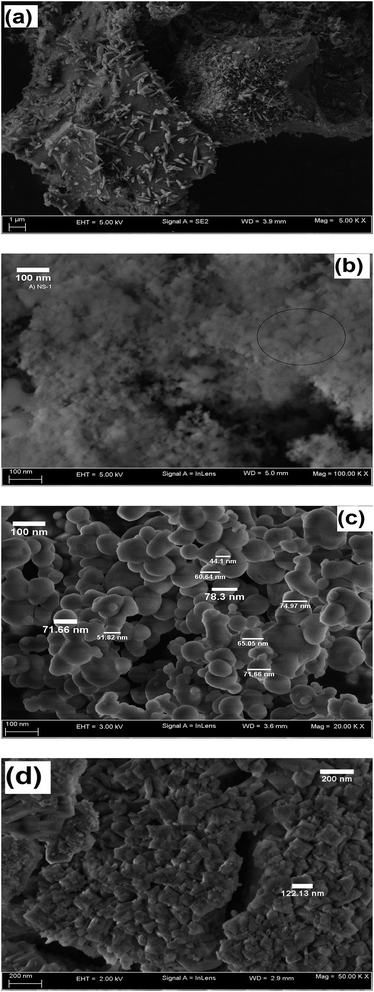
FESEM micrographs of POFA, NS1, NS2, and iron oxide are presented in Fig. 7a–d, respectively. POFA particles exhibit a porous surface comparable with those observed in the micrographs of fly ash and other industrial ashes.5 The presence of small particles on POFA surface reflects the heterogeneous morphology and non-uniform particle size distribution of the POFA. This sponge-like porous structure is observed when particle size exceed 100 μm; crushed shapes are formed at particle sizes below 20 μm.5 The semi porous structure observed also suggests that POFA mostly consists of amorphous materials. Silica formed without addition of PEG (NS1) shows the formation of highly agglomerated nanoparticles (Fig. 7b). In the area marked by a circle in this figure, the presence of small particles may be observed.PEG resulted in deagglomeration, and well-defined spherical silica nanoparticles can be observed in Fig. 7c. These nanoparticles present a size distribution in the range of 50–80 nm. PEG decreased interparticle interactions between silica particles by networking with silanol functionalities, which promotes deagglomeration. Highly agglomerated and irregular-shaped iron oxide particles are shown in Fig. 7d. The size of the particles varied from 100–200 nm. As no surfactant was used during iron oxide synthesis and the reaction was carried out in aqueous and alkaline media, more extensive interparticle hydrogen bonding through surface hydroxyl groups may be expected.
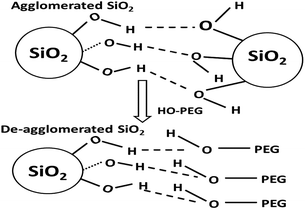
Agglomeration in nanoparticles is caused by hydrogen-bonding interactions between the surface hydroxyl (silanol in the case of silica) groups of the neighboring particles.32 Surfactants interact with these particles through their polar region by forming hydrogen bonds. Polymeric PEG consists of a long chain of hydrocarbons (non-polar region) attached to a hydroxyl group synonymous with alcohol (polar region).
The probable mechanism through which PEG interacts with silica particles is depicted in Fig. 8. Strong hydrogen bonding between neighbouring silica nanoparticles initially occurs. This phenomenon is further increased when water-based silicates are used as starting materials. PEG molecules have polar (O–H) and non-polar (alkyl) regions. The O–H groups of PEG are more polar than silanol groups and can initiate non-bonding interactions with silanol. Being larger in size, the PEG molecules prevent silica particles from approaching one another, thereby resulting in deagglomeration.27 Interactions between silica and PEG begin when PEG is dissolved in the sodium silicate solution; thus, the role of PEG is not limited to deagglomeration. Besides non-bonding interactions, it is reported that glycols react chemically with silica to yield a glycosilicate complex.35 These reactions usually take place when lower-molecular weight PEG is used. Increases in surface area and variations in porosity suggest the existence of molecular interactions in the solution.
Transmission electron microscopy
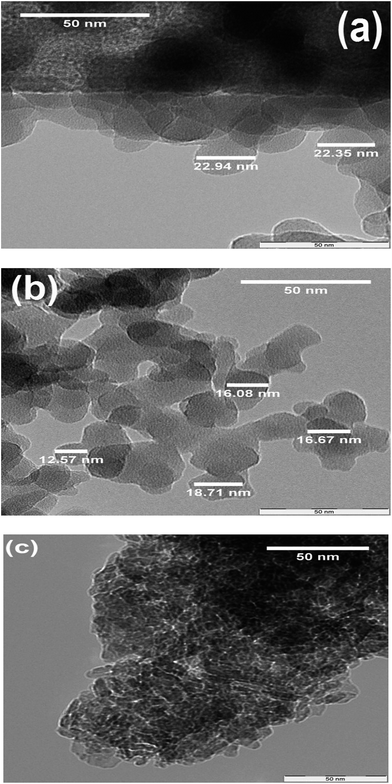
TEM micrographs of NS1, NS2, and iron oxide are shown in Fig. 9a–c. Both silica samples (NS1 and NS2) showed a spherical morphology, which indicates that particle morphology is not altered by addition of PEG and only agglomeration is restrained. The spherical shape of NS1 reveals that agglomerated silica has dimensions in the nanometer scale and a morphology identical to that of amorphous silica, as reported earlier.16 Moreover the lesser agglomeration in the TEM images compared to FESEM images (Fig. 7b vs. Fig. 9a) are observed in NS1. This lesser agglomeration and formation of spherical silica particles may be caused by the sonication NS1 in iso butanol for thirty minutes prior to TEM analysis. The particle size of NS1 was larger than that of NS2, which indicates that PEG effectively reduces particle sizes by decreasing interparticle interaction. Compared with the FESEM micrographs in Fig. 7c, the TEM images of NS2 show a finer particle size in the range of 12–20 nm. This phenomenon may be explained by considering the effects of dispersion and sonication of samples for 30 min in isobutanol, which were performed prior to TEM analysis. Gao et al. reported that the particle size of silica nanoparticles extracted from oil shale ash and reported that agglomeration in silica was considerably reduced by sonication and azeotropic distillation with isobutanol.32 Fig. 9c presents the TEM micrograph of iron oxide, which shows an angular morphology consistent with its FESEM micrograph (Fig. 9d). A similar degree of agglomeration and no considerable effect of sonication and dispersion in isobutanol were observed in the iron oxide sample. These results suggest that further decreases in size can be achieved by ultrasonication and application of different solvents as dispersant.Thermal analysis produced reliable results of the amount of template in the nano silica matrix and is discussed in the next section.12
Thermogravimetric analysis of PEG and PEG–SiO2
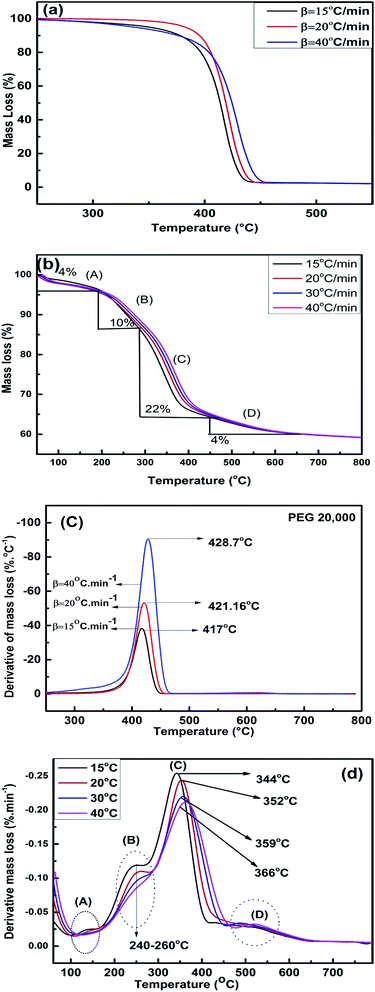
TGA was utilized to understand the mechanism of interaction between PEG and silica and the thermal decomposition profile of PEG and PEG–SiO2. Fig. 10a and b illustrate the TGA curves of pure PEG and PEG–SiO2.To determine the model-free kinetics, both samples were run at a minimum of three β. Pure PEG decomposed completely at 450 °C, and a single DTG peak (Fig. 10c) reflected uniform decomposition in a single step without intermediate stages. The decomposition pattern of PEG–SiO2 is complex, and approximately 40% mass loss occurred at 600 °C; no further decomposition was observed when heating was increased to 800 °C. In the TGA and DTG curves of PEG–SiO2 (Fig. 10b and d), four regions/peaks were observed. Peak “A” is located in the region of 100–150 °C and represents dehydration of surface water.12,36 Peak “B” (240–260 °C) contributed 10% weight loss attributable to the release of silanol-bonded water; silanol-bonded water is generally stable and released at relatively higher temperatures. The third stage (peak C) represents decomposition of PEG, as confirmed by comparison of Fig. 10b with Fig. 10a, accounting for 22% of the material loss. The amount of PEG incorporated into PEG–SiO2 was calculated to be about 22%. A small peak at around 540 °C reflected decomposition of carbonaceous materials or char formed during earlier steps.10,18 The shift in Tm from 344 °C at 15 °C min−1 to 366 °C at 40 °C min−1 shows that thermal decomposition is affected by the heating rate.37 A similar trend is also observed for pure PEG where a shift in Tm is observed from 417 °C at 15 °C min−1 to 428.7 °C at 40 °C min−1, as given in Fig. 10c.
This trend of DTG peak temperature variation was subsequently utilized for model-free kinetic analysis.
Similar TGA results of PEG–silica composites were reported by Li et al. without the presence of peak “D”. In this study, the existence of peak “D” may be attributed to the formation of pyrolysis products formation at higher heating rates.12
The kinetics of the thermal decomposition are determined by TGA or DTG techniques by employing model-free and model-based kinetic equations. DTG technique was used in this study and is discussed in next section.
Thermokinetics studies of PEG removal
The DTG technique was used for thermokinetic and thermodynamic studies of PEG–SiO2, and data obtained were compared with those of pure PEG. Ozawa and Kissinger plots of PEG and PEG–SiO2 (peaks B and C) are described in Fig. 11a–c. The apparent Ea and ln![[thin space (1/6-em)]](https://www.rsc.org/images/entities/char_2009.gif) A were calculated from the slope and intercept of the plots using eqn (9)–(11), and results are tabulated in Table 3. Both samples demonstrated effective linear fitting, yielding fairly high values of R2 (Table 3). Pure PEG exhibited an Ea of 330.1 kJ mol−1 (Kissinger) and 324.81 kJ mol−1 (Ozawa); these values are higher than that obtained by Feng-Yih et al. (283 kJ mol−1).38 Increases in Ea and ln
A were calculated from the slope and intercept of the plots using eqn (9)–(11), and results are tabulated in Table 3. Both samples demonstrated effective linear fitting, yielding fairly high values of R2 (Table 3). Pure PEG exhibited an Ea of 330.1 kJ mol−1 (Kissinger) and 324.81 kJ mol−1 (Ozawa); these values are higher than that obtained by Feng-Yih et al. (283 kJ mol−1).38 Increases in Ea and ln![[thin space (1/6-em)]](https://www.rsc.org/images/entities/char_2009.gif) A may be correlated with the amount and morphology of the sample, differences in β, and the kinetics method used. In PEG–SiO2, peak “B” exhibited an Ea of 105.9 kJ mol−1 (Kissinger) and 109 kJ mol−1 (Ozawa), while peak “C” produced an Ea of 139.7 kJ mol−1 (Kissinger) and 142 kJ mol−1 (Ozawa). Differences in Ea support the hypothesis that peak “B” corresponds to dehydration of bonded water and peak “C” represents decomposition of PEG; these suppositions are consistent with the TGA and DTG results (Fig. 10b).
A may be correlated with the amount and morphology of the sample, differences in β, and the kinetics method used. In PEG–SiO2, peak “B” exhibited an Ea of 105.9 kJ mol−1 (Kissinger) and 109 kJ mol−1 (Ozawa), while peak “C” produced an Ea of 139.7 kJ mol−1 (Kissinger) and 142 kJ mol−1 (Ozawa). Differences in Ea support the hypothesis that peak “B” corresponds to dehydration of bonded water and peak “C” represents decomposition of PEG; these suppositions are consistent with the TGA and DTG results (Fig. 10b).
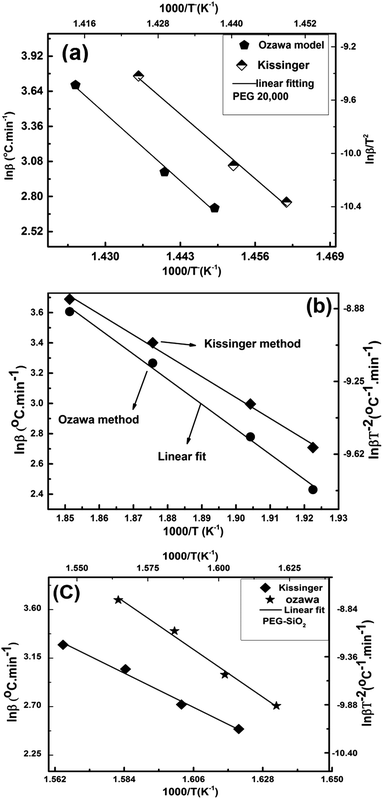 | ||
Fig. 11 Ozawa and Kissinger model-based kinetics of (a) PEG-20![[thin space (1/6-em)]](https://www.rsc.org/images/entities/char_2009.gif) 000, (b) peak “B” of PEG–SiO2, and (c) peak “C” of PEG–SiO2. 000, (b) peak “B” of PEG–SiO2, and (c) peak “C” of PEG–SiO2. | ||
| Material | Method | Ea kJ mol−1 | ln![[thin space (1/6-em)]](https://www.rsc.org/images/entities/char_2009.gif) A min−1 A min−1 |
R2 | ΔH kJ mol−1 | ΔG kJ mol−1 | ΔS J mol−1 |
|---|---|---|---|---|---|---|---|
| PEG | Kissinger | 330.1 | 57.7 | 0.993 | 324.3 | 173 | 220 |
| Ozawa | 324.8 | 51.6 | 0.998 | 319.0 | 203 | 169 | |
| PEG–SiO2 (peak B) | Kissinger | 105.9 | 20.0 | 0.994 | 101.5 | 149 | −91.1 |
| Ozawa | 109.0 | 18.7 | 0.995 | 104.6 | 152 | −102 | |
| PEG–SiO2 (peak C) | Kissinger | 139.7 | 22.7 | 0.987 | 134.6 | 178 | −70.4 |
| Ozawa | 142.7 | 21.2 | 0.988 | 137.6 | 190 | −83.4 |
The values of ln![[thin space (1/6-em)]](https://www.rsc.org/images/entities/char_2009.gif) A are also higher for pure PEG [57.7 min−1 (Kissinger) and 51.6 min−1 (Ozawa)] compared with those for PEG-templated silica [20 min−1 (Kissinger) and 18.7 min−1 (Ozawa)]. These decreases in Ea and ln
A are also higher for pure PEG [57.7 min−1 (Kissinger) and 51.6 min−1 (Ozawa)] compared with those for PEG-templated silica [20 min−1 (Kissinger) and 18.7 min−1 (Ozawa)]. These decreases in Ea and ln![[thin space (1/6-em)]](https://www.rsc.org/images/entities/char_2009.gif) A may be correlated with non-bonded interactions between PEG and silica. Renata et al. postulated that increases in Ea during CTMA+ removal from an MCM 41 matrix are due to strong interactions between the silica surface and the polymer.39
A may be correlated with non-bonded interactions between PEG and silica. Renata et al. postulated that increases in Ea during CTMA+ removal from an MCM 41 matrix are due to strong interactions between the silica surface and the polymer.39
In our study, the decrease in Ea may be related to non-bonding attractions between the silica surface and PEG, which supports the notion of no chemical reaction occurring between silica and PEG. Observations by Saladino et al. may also explain the phenomena observed: nanoparticles catalyze the thermal decomposition of polymers by initiating earlier thermal degradation.40 These postulations are in good agreement with the TGA data of PEG–SiO2 (Fig. 10b), which showed earlier degradation at 200 °C compared with PEG (approx. 400 °C). The Ea of PEG–SiO2 in this work is slightly higher than those reported in the literature for lower-molecular weight PEG-4000, the Ea of which lies in the range of 112–116 kJ mol−1.41
The closeness of the Ea values reveals a possible breakdown of cross-linking and conversion of high-molecular weight PEG into lower-molecular weight PEG.
Thermodynamic functions (i.e., ΔH#, ΔG#, and ΔS#) of the transition state were determined using eqn (15)–(17) through the Kissinger and Ozawa methods using DTG data, and the values obtained are tabulated in Table 3. The thermodynamic functions calculated by the Kissinger and Ozawa methods are fairly similar, which means both methods produce reliable thermodynamics results.
Changes in entropy (ΔS) for the thermal degradation of pure PEG are 220 J mol−1 (Kissinger) and 169 J mol−1 (Ozawa); these values demonstrate that the activated species has higher entropy (lower degree of arrangement) than the starting material. As explained using transition state theory of activated complexes, a positive value of ΔS represents an activated complex resulted in a “fast” stage reaction. By contrast, a negative ΔS demonstrates that the activated complex is structurally more complex compared with the starting material and can be considered a “slow” stage reaction product. This explanation is consistent with the TGA analyses of PEG and PEG–SiO2 (Fig. 10a and b), as PEG shows a faster reaction.42 Pure PEG exhibited an enthalpy change (ΔH) of 324 and 319 kJ mol−1 according to the Kissinger and Ozawa plots, respectively; these values are higher than the corresponding values of peak “C” of PEG–SiO2, i.e., 134.6 and 136.6 kJ mol−1, respectively. Such results confirm that the thermal degradation processes of PEG and PEG–SiO2 are endothermic in nature and that a large amount of energy is required for their decomposition.42 Moreover, we can conclude that PEG loses its structural arrangement when added to silica as a template. Changes in Gibbs free energy (ΔG#) similarly demonstrate that thermal degradation of PEG and PEG–SiO2 is a non-spontaneous process.43 Thermodynamic data confirmed that PEG decomposition is a non-spontaneous process and that a large amount of energy is required for decomposition. Abrupt changes in the thermodynamic properties of PEG–SiO2 observed during decomposition agree with the assumption that the PEG structure is broken into lower-molecular weight PEG, as confirmed by the Ea and ln![[thin space (1/6-em)]](https://www.rsc.org/images/entities/char_2009.gif) A values obtained.
A values obtained.
Conclusion
The use of POFA for extracting nano silica and iron oxide was evaluated. Nano silica and iron oxide were obtained simultaneously from POFA. Nano silica of moderate surface area (326 m2 g−1) and pore diameter (8.2 nm) was obtained when PEG was used as a templating agent. PEG promoted deagglomeration of silica by reducing hydrogen bonding between silica particles. FTIR and TGA analysis revealed that interactions between PEG and silica are physical in nature, and no chemical bonds were observed. TGA thermokinetics suggested that PEG is converted into lower-molecular weight PEG when used for templating. Iron oxide extraction was pH-selective and, if not carefully controlled, could be easily contaminated.Acknowledgements
This work was funded by the Ministry of Science and Technology under grant (FRGS) no. 153AB-i84. Financial support in terms of graduate assistantship provided by Universiti Teknologi PETRONAS is also acknowledged.References
- S. V. Vassilev, D. Baxter, L. K. Andersen and C. G. Vassileva, Fuel, 2013, 105, 40–76 CrossRef CAS PubMed.
- Y. Zarina, A. M. M. Al Bakri, H. Kamarudin, I. K. Nizar and A. R. Rafiza, Rev. Adv. Mater. Sci., 2013, 34, 37–43 CAS.
- C. Chandara, K. A. M. Azizli, Z. A. Ahmad, S. F. S. Hashim and E. Sakai, Adv. Mater. Res., 2010, 173, 7–11 CrossRef.
- M. O. Yusuf, M. A. Megat Johari, Z. A. Ahmad and M. Maslehuddin, Mater. Des., 2014, 55, 387–393 CrossRef CAS PubMed.
- K. Y. Foo and B. H. Hameed, J. Hazard. Mater., 2009, 172, 523–531 CrossRef CAS PubMed.
- M. Hasan, A. L. Ahmad and B. H. Hameed, Chem. Eng. J., 2008, 136, 164–172 CrossRef CAS PubMed.
- A. A. Ahmad, B. H. Hameed and N. Aziz, J. Hazard. Mater., 2007, 141, 70–76 CrossRef CAS PubMed.
- M. V. Madurwar, R. V. Ralegaonkar and S. A. Mandavgane, Construct. Build. Mater., 2013, 38, 872–878 CrossRef PubMed.
- W. Tangchirapat, C. Jaturapitakkul and P. Chindaprasirt, Construct. Build. Mater., 2009, 23, 2641–2646 CrossRef PubMed.
- N. Liu, K. Huo, M. McDowell, J. Zhao and Y. Cui, Sci. Rep., 2013, 3, 1919 Search PubMed.
- K.-M. Kim, Y.-S. Heo, S.-P. Kang and J. Lee, Cem. Concr. Compos., 2014, 49, 84–91 CrossRef CAS PubMed.
- D. Li and X. Zhu, Mater. Lett., 2011, 65, 1528–1530 CrossRef CAS PubMed.
- Y. Liu, Y. Guo, W. Gao, Z. Wang, Y. Ma and Z. Wang, J. Cleaner Prod., 2012, 32, 204–209 CrossRef CAS PubMed.
- W. Wang, J. Martin, X. Fan, A. Han, Z. Luo and L. Sun, ACS Appl. Mater. Interfaces, 2012, 4, 977–981 CAS.
- D. Li, D. Chen and X. Zhu, Bioresour. Technol., 2011, 102, 7001–7003 CrossRef CAS PubMed.
- Y. Liu, Y. Guo, Y. Zhu, D. An, W. Gao, Z. Wang, Y. Ma and Z. Wang, J. Hazard. Mater., 2011, 186, 1314–1319 CrossRef CAS PubMed.
- J. Z. Zhang, T. J. Chen, J. L. Wua and J. H. Wu, RSC Adv., 2014, 4, 17513–17520 RSC.
- S. Ceylan and Y. Topcu, Bioresour. Technol., 2014, 156, 182–188 CrossRef CAS PubMed.
- P. Ptacek, D. Kubatova, J. Havlica, J. Brandstetr, F. Soukal and T. Opravil, Thermochim. Acta, 2010, 501, 24–29 CrossRef CAS PubMed.
- L. Vlaev, N. Nedelchev, K. Gyurova and M. Zagorcheva, J. Anal. Appl. Pyrolysis, 2008, 81, 253–262 CrossRef CAS PubMed.
- J. A. Augis and J. E. Bennett, J. Therm. Anal., 1978, 13, 283–292 CrossRef CAS.
- T. Ozawa, Bull. Chem. Soc. Jpn., 1965, 38, 1881–1886 CrossRef CAS.
- S. M. Pourmortazavi, I. Kohsari, M. B. Teimouri and S. S. Hajimirsadeghi, Mater. Lett., 2007, 61, 4670–4673 CrossRef CAS PubMed.
- A. W. Coats and J. P. Redfern, Nature, 1964, 201, 68–69 CrossRef CAS.
- B. An, W. Wang, G. Ji, S. Gan, G. Gao, J. Xu and G. Li, Energy, 2010, 35, 45–49 CrossRef CAS PubMed.
- U. Schwertmann and R. M. Cornell, Iron oxides in the laboratory, John Wiley & Sons, 2008 Search PubMed.
- D. Li, D. Chen and X. Zhu, Bioresour. Technol., 2011, 102, 7001–7003 CrossRef CAS PubMed.
- R. R. Zaky, M. M. Hessien, A. A. El-Midany, M. H. Khedr, E. A. Abdel-Aal and K. A. El-Barawy, Powder Technol., 2008, 185, 31–35 CrossRef CAS PubMed.
- M. Irfan Khan, K. Azizli, S. Sufian and Z. Man, Ceram. Int., 2015, 41, 2794–2805 CrossRef CAS PubMed.
- Z. Jing and S. Wu, Mater. Lett., 2004, 58, 3637–3640 CrossRef CAS PubMed.
- M. Noushad, I. A. Rahman, N. S. Che Zulkifli, A. Husein and D. Mohamad, Ceram. Int., 2014, 40, 4163–4171 CrossRef CAS PubMed.
- G. M. Gao, H. F. Zou, S. C. Gan, L. B. Zhao-Jun, B. C. An, J. J. Xu and G. H. Li, Powder Technol., 2009, 191, 47–51 CrossRef CAS PubMed.
- P. Chindaprasirt, P. De Silva, K. Sagoe-Crentsil and S. Hanjitsuwan, J. Mater. Sci., 2012, 47, 4876–4883 CrossRef CAS.
- S. Ghosh and M. K. Naskar, RSC Adv., 2013, 3, 4207–4211 RSC.
- J. Payá, J. Monzó, M. Borrachero, A. Mellado and L. Ordoñez, Cem. Concr. Res., 2001, 31, 227–231 CrossRef.
- I. Ismail, S. A. Bernal, J. L. Provis, R. S. Nicolas, S. Hamdan and J. S. J. van Deventer, Cem. Concr. Compos., 2014, 45, 125–135 CrossRef CAS PubMed.
- P. Ptacek, F. Soukal, T. Opravil, J. Havlica and J. Brandstetr, Powder Technol., 2011, 208, 20–25 CrossRef CAS PubMed.
- F.-Y. Wang, C.-C. M. Ma and W.-J. Wu, J. Appl. Polym. Sci., 2001, 80, 188–196 CrossRef CAS.
- R. M. Braga, J. M. F. Barros, D. M. A. Melo, M. A. F. Melo, F. d. M. Aquino, J. C. d. O. Freitas and R. C. Santiago, J. Therm. Anal. Calorim., 2012, 111, 1013–1018 CrossRef.
- M. L. Saladino, T. E. Motaung, A. S. Luyt, A. Spinella, G. Nasillo and E. Caponetti, Polym. Degrad. Stab., 2012, 97, 452–459 CrossRef PubMed.
- N. S. Vrandečić, M. Erceg, M. Jakić and I. Klarić, Thermochim. Acta, 2010, 498, 71–80 CrossRef PubMed.
- Z. Chen, Y. Xia, S. Liao, Y. Huang, Y. Li, Y. He, Z. Tong and B. Li, Food Chem., 2014, 155, 81–86 CrossRef CAS PubMed.
- N. Chaiyo, R. Muanghlua, S. Niemcharoen, B. Boonchom, P. Seeharaj and N. Vittayakorn, J. Therm. Anal. Calorim., 2011, 107, 1023–1029 CrossRef PubMed.
| This journal is © The Royal Society of Chemistry 2015 |

