Vibrational and electronic peculiarities of NiTiO3 nanostructures inferred from first principle calculations
M. A. Ruiz Preciadoabc,
A. Kassibab,
A. Morales-Acevedoc and
M. Makowska-Janusik*a
aInstitute of Physics, Jan Dlugosz University in Czestochowa, Al. Armii Krajowej 13/15, 42200 Czestochowa, Poland. E-mail: m.makowska@ajd.czest.pl
bInstitute of Molecules and Materials of Le Mans, Université du Maine, 72085 Le Mans, France
cCentro de Investigación y Estudios Avanzados del IPN, Unidad Zacatenco, Mexico
First published on 30th January 2015
Abstract
Structural, electronic and vibrational properties of nanostructured (NiTiO3)n clusters were calculated by numerical models based on DFT and semi-empirical quantum chemistry codes. The clusters were built by using the initial atomic positions of crystalline ilmenite, which were relaxed to ensure stable and energetically favourable geometries. For the electronic properties, the semi-empirical PM6 parameterisation method was used to evaluate the HOMO–LUMO energy differences versus nanocrystal sizes. The quantum confinement effect was induced with cluster size reduction. Theoretical UV-Vis absorption and Raman spectroscopy showed the drastic influence of the surface characteristics on the electronic and the vibrational properties of the nanoclusters. Theoretically, it was proved that powder NiTiO3 exhibits a patchwork of the properties of the bulk ilmenite material, amorphous Ni–Ti–O structures and atoms located at the surface of the investigated cluster.
Introduction
Photocatalytic processes have been intensively discussed and investigated in the last two decades, due to their potential applications in solving problems of waste in the environment or alternatively in creating new sources of energy.1,2 For example, it can be mentioned that photocatalytic reactions contribute to the remediation of environmental pollution by the degradation of organic compounds or to the production of hydrogen by the dissociation of water for renewable energy.3–9 These processes are based on photoinduced charge transfers caused by light sources (visible or UV) in the semiconducting oxides.Beyond its applications in photovoltaic devices, titanium dioxide (TiO2) is one of the most efficient materials for photocatalytic reactions and possesses the best performance, associated with its good stability, versatile applications, non-toxicity and low cost.10–12 Photocatalytic reactions using TiO2 under UV irradiation have been carried out to remove different types of impurities from wastewater.13–16 The kinetics of the reactions are characterized by short relaxation times to achieve the complete removal of pollutants. However, the need for UV to induce the required charge transfer in the mentioned reactions limits the performance of TiO2. Therefore, photocatalytic materials that operate under visible light irradiation are of interest, since the solar light spectrum can be exploited on a large scale to activate high performance photocatalytic reactions.
The perovskite-type oxides, such as tantalates and titanates, have recently attracted much attention, because of their high photocatalytic activities under UV irradiation and, more remarkably, under visible light.17–19 These titanates, such as ATiO3 (A = Ca, Bi, Pb, Fe, Co, Mn, Ni, Cu, and Zn) have been studied as functional inorganic materials with many applications as electrodes for solid oxide fuel cells, metal–air barriers, gas sensors, solid lubricants, and high-performance catalysts.20–22 Among these materials, we consider the transition metal titanates, such as FeTiO3, CoTiO3, MnTiO3, NiTiO3, etc., that crystallize in the ilmenite structure under atmospheric pressure.23–26 They are of particular interest due to their versatile electrical and magnetic properties, such as their antiferromagnetic behavior.27,28 The related properties of several titanate oxides have been investigated experimentally and theoretically. FeTiO3 is of interest as a natural mineral and a major source of titanium for the commercial production of TiO2. The electronic, magnetic, structural and elastic properties of bulk FeTiO3 have been computed using the density functional theory (DFT) formalism and ab initio calculations.23–25 Within such approaches, the electronic ground-state properties and the charge transfer involved in FeTiO3 were determined by the strong coupling of the structure with the charge distribution. The quantum-mechanical description of these features is very sensitive to the treatment of electronic exchange and correlation energies. This allows us to conclude that the metal titanates are strongly correlated systems and therefore the electron correlation part should be taken into account sufficiently.
The present work reports theoretical approaches to model the nanostructures and simulate the electronic and vibrational properties of NiTiO3 nanoclusters. Comparative studies were also performed by using bulk crystal, with its infinite and periodic structure. Previous theoretical approaches developed by Xin et al.29 were used to compute the electronic properties of the bulk and infinite NiTiO3 system. However, to the best of our knowledge no particular models have been developed to compute and predict the physical properties of the NiTiO3 nanostructures. The study of nanosized systems, with regard to the critical role of the specific active surface in physical phenomena, is of great interest. Particularly, because the interfaces between the active material and the surrounding media contribute critically to the efficiency of heterogeneous catalysis. However, developing theoretical models and numerical simulations to predict the electronic, optical, structural, vibrational and related properties of nanoparticles is a challenging task. The numerical approach presented here was partially used in our former studies devoted to functional semiconducting systems.30–32 The nanostructures were built from their native bulk crystals with specified atomic positions as involved in defined space groups. Also, in this work, the modeling of bulk systems is of primary importance in developing the methodology for establishing the structural, vibrational and electronic properties of nanostructures. The quantum chemical calculations were based on first-principles calculations using the ultrasoft pseudopotential of the plane-wave within the DFT formalism. The generalized gradient approximation extended by Hubbard parameters was used to evaluate the electronic properties of the NiTiO3 bulk crystal.
The original task in this work consisted of modeling the crystal structure at the nanoscale, including the relaxation of the outermost surface atoms with suitable treatment. The changes in their electronic and vibrational properties were accurately described as a function of the structural features of the investigated nanoclusters. Also the influence of the surface on the physical properties of the clusters was demonstrated. The simulation of electronic band structures clarified the charge transfer characteristics. This approach paves the way to elucidating the mechanisms behind the photocatalytic activity of the nanosized NiTiO3 materials. The theoretical results are compared to the data obtained by experimental investigations of the relevant features of NiTiO3 nanostructures.
Computational details and cluster building methodology
The crystal structures were computed for two different configurations of the material. One of them was considered to represent the bulk NiTiO3 monocrystal crystallized in the ilmenite phase; i.e. space group R![[3 with combining macron]](https://www.rsc.org/images/entities/char_0033_0304.gif) (no. 148).33 The second was chosen to be a nanocrystalline cluster of varying size, possessing the ilmenite structure in the core. Therefore, the unit cell of ilmenite NiTiO3 was built using the cell parameters a = b = 5.0289 Å, c = 13.7954 Å and the angular parameters α = β = 90° and γ = 120°. The positions of representative atoms within the unit cell are summarized in Table 1. The crystal structure of NiTiO3 was built using the Materials Studio Program Package. The same simulation software was used to build the (NiTiO3)n nanostructures with diameters from 0.6 nm up to 2.6 nm, associated with clusters composed of (NiTiO3)2 and (NiTiO3)183 units, respectively. Consequently, all of the investigated nanocrystals exhibited spherical shapes and stoichiometric compositions. According to our previous work on other classes of nanocrystalline systems, dangling bonds were not specially saturated.31 The unit cell of the monocrystal and the morphology of the (NiTiO3)82 cluster are depicted in Fig. 1.
(no. 148).33 The second was chosen to be a nanocrystalline cluster of varying size, possessing the ilmenite structure in the core. Therefore, the unit cell of ilmenite NiTiO3 was built using the cell parameters a = b = 5.0289 Å, c = 13.7954 Å and the angular parameters α = β = 90° and γ = 120°. The positions of representative atoms within the unit cell are summarized in Table 1. The crystal structure of NiTiO3 was built using the Materials Studio Program Package. The same simulation software was used to build the (NiTiO3)n nanostructures with diameters from 0.6 nm up to 2.6 nm, associated with clusters composed of (NiTiO3)2 and (NiTiO3)183 units, respectively. Consequently, all of the investigated nanocrystals exhibited spherical shapes and stoichiometric compositions. According to our previous work on other classes of nanocrystalline systems, dangling bonds were not specially saturated.31 The unit cell of the monocrystal and the morphology of the (NiTiO3)82 cluster are depicted in Fig. 1.
| Atom name | x/a | y/b | z/c |
|---|---|---|---|
| Ni | 0 | 0 | 0.3499(1) |
| Ti | 0 | 0 | 0.1441(1) |
| O | 0.3263(7) | 0.0214(10) | 0.2430(3) |
| Cell parameters | a = b = 5.0289(1) Å, c = 13.7954(2) Å, α = β = 90°, γ = 120° | ||
| Space group | R![[3 with combining macron]](https://www.rsc.org/images/entities/char_0033_0304.gif) (no. 148) (no. 148) |
||
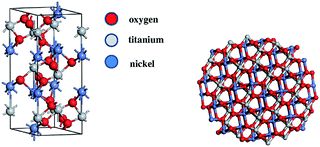 | ||
| Fig. 1 The unit cell of crystalline NiTiO3 (left) and the unpassivated nanocrystalline structure made by the formula (NiTiO3)82 (right). | ||
The electronic properties of the NiTiO3 single crystal were calculated using the DFT methodology. The quantum chemical calculations were performed using the Cambridge Serial Total Energy Package (CASTEP);34 i.e. the module of the Materials Studio Program. The CASTEP is based on the evaluation and analysis of the total energy inferred from the plane-wave pseudopotential method. The first task deals with the geometry optimisation of the investigated crystal structure, which is built and evaluated with respect to the total energy minimization within the Broyden–Fletcher–Goldfarb–Shanno (BFGS) algorithm.35 During the geometry optimisation procedure, the symmetry of the structure was frozen but the size of the unit cell was allowed to change. The convergence criteria for the optimization procedure were chosen as hereafter outlined. The convergence of the total energy during the geometry optimization procedure cannot be greater than 2 × 10⁻⁵ eV per atom, the force on the atom must be less than 0.01 eV Å−1, the stress on the atom less than 0.02 GPa and the maximal atomic displacement no more than 5 × 10⁻⁴ Å. The electron exchange–correlation energy was treated within the framework of the generalized gradient approximation (GGA) using Perdew–Burke–Ernzerhof (PBE)36 potential. To accelerate the computational runs, the ultrasoft pseudopotential formalism was used. In this frame, calculations were performed for Ti (3d2 4s2), Ni (3d8 4s2) and O (2s2 2p4) electrons. The cut-off energy of the plane-wave basis set was chosen to be equal to 500 eV. The integration by numerical sampling for specific directions over the Brillouin zone (BZ) were carried out using the Monkhorst–Pack method with an 8 × 8 × 8 special k-point mesh. The total energy convergence criterion was assumed to be fulfilled when the self-consistent field (SCF) tolerance; i.e. equal to 10−5 eV per atom.
The electronic properties of the NiTiO3 crystal were computed using the above-mentioned parameters, as specified for the geometry optimization procedure. The calculations were carried out in spin restricted as well as spin unrestricted procedures, applying the GGA/PBE potential and Heyd–Scuseria–Ernzerhof (HSE06) range-separated hybrid functional.37,38 Hummer et al.39 showed that the HSE06 functional yields the correct electronic band structure for the semiconductors of group-IV. Also the work of Śpiewak et al.40 shows that the HSE06 potential may better reproduce the electronic properties of Ge single crystals with defects. Contrary to this, other works indicate that the range-separated functionals show improvements for strong charge transfer systems.41,42 It is generally known that classical DFT potentials do not correctly reproduce far-nucleus asymptotic behaviour43,44 and underestimate the excitation energies, notably for charge transfer processes.45 The range-separated potentials lead to the partitioning of the total exchange energy into short-range and long-range contributions:
| EX = EsrX + ElrX. | (1) |
To improve the exchange functional, in terms of calculating the long-range electron–electron interactions using the HF exchange integral, the standard error function is used. The repulsion electron operator is also divided into short-range and long-range parts and can be defined for two electrons at the rij distance as:
 | (2) |
The Kohn–Sham equation was also solved using the GGA/PBE functional extended by the Hubbard parameters. The introduced methodology contributes to precise insights into the electronic properties of the material. The major drawback of all functionals lies in the underestimation of the calculated electronic band gap.46 This is frequently encountered due to the approximate calculations of the electron self-interaction energies. Also, pure local density approximations (LDA),47 generalized gradient approximations (GGA)48 and even hybrid functionals49–51 can lack precision in some instances, due to so-called “strongly correlated” systems.
One relevant solution for describing correlated electrons in solids concerns the Hubbard model,52 based on an extended LDA approach, also referred to as LDA + U. It decreases the electron self-interaction error by selectively adding an energy correction to localized electron states, such as d or f orbitals where the self-interaction is particularly large. To construct an appropriate functional, the LDA + U approach subdivides the charge density into two subsystems with delocalized and localized features. In the multiband Hubbard model the effective LDA + U energy functional is written as:
| ELDA+U = ELDA + EHF(nμν) − Edc(nμν) | (3) |
 | (4) |
In the present work, the electronic properties of the (NiTiO3)n nanoclusters were also calculated. To our knowledge, it is first time that nickel titanate nanostructures have been studied theoretically. The methodology requires two different calculation codes to perform the simulations and also to ensure their stability. Thus, the Gaussian09 and MOPAC (Molecular Orbital PACkage)58 quantum chemistry programs were used. With regard to the size of the investigated clusters, semiempirical single point calculations were performed, applying the parameterized self-consistent restricted HF (SCF RHF) PM6 method.59 The convergence of the SCF procedure was achieved with an energy uncertainty not greater than 10−6 hartrees and no more than 150 required iterations. Within such approaches, the electronic properties of two different cluster families were computed. The first one deals with (NiTiO3)n clusters possessing an ilmenite crystal structure without any reconstruction. The second considers the same clusters as specified previously, but their geometries were optimised according to the total energy minimization. The geometry of all clusters was specified in Cartesian coordinates with C1 symmetry. The gradient convergence tolerance was equal to 10−6 hartrees bohr−1 using the quadratic approximation (QA) method,60–62 updating the Hessian matrix during the optimization. The Hessian evaluation was performed to exclude the structures giving rise to negative frequency modes.
Results and discussion
Structure and electronic properties of bulk ilmenite NiTiO3
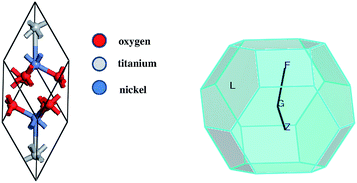
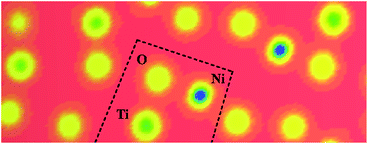
The GGA/PBE functional was used to build the stable NiTiO3 crystal geometry and to calculate the related physical responses. In the first step, the geometry optimization of the crystal structure was performed. The changes to the optimised atomic distances were less than 5% compared to the starting values from the defined crystallographic data. It is in agreement with the former report by Xin et al.29 The noticed departures from these values could be attributed to the fact that the present calculations were performed at T = 0 K, whereas the experimental structural data measurements were generally performed at room temperature. Thus, the relatively low deviation between the optimized values and experimental structural data indicates that GGA/PBE is a suitable computational functional for the description of the structures of the NiTiO3 crystal. Following the performed geometry optimization, one may conclude that the ilmenite NiTiO3 structure appears as the layered organisation depicted in Fig. 2 (left-hand panel), where Ti and Ni atoms form the layers separated by oxygen atoms.The electronic properties of the NiTiO3 crystal were computed within the spin polarized approach for a primitive unit cell (see Fig. 2). The band structure calculations were performed in the k space within the BZ directions shown in Fig. 2 (right-hand panel). The DFT/HSE06 functional gives unsatisfactory results. The obtained energy gap is equal to 1.23 eV, whereas the experimental data are within 2.12–2.18 eV.63–65 Also, the DFT/PBE functional was considered with and without the Hubbard approximation. The mentioned functional without the Hubbard approximation and in the spin polarized regime gives an energy gap equal to 0.77 eV for the NiTiO3 crystal. This shows that using nonempirically tuned range-separated DFT methods results in a significant improvement over traditional GGA functionals but does not give good results for the studied crystal. The large discrepancies suggest the presence of strongly correlated electrons from the considered (Ti and Ni) ions, leading to the necessity to explore the Hubbard approximation in such systems. Within the approach based on the DFT/PBE potential, the electron density depicted in Fig. 3 also informs us about the covalent character of the O–Ti, O–Ni and Ti–Ni bonds. This behavior indicates the nature of the strongly correlated system and the necessity to develop the theoretical functional to reconcile the predicted electronic features with the experimental findings.
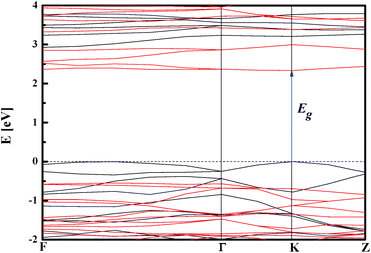
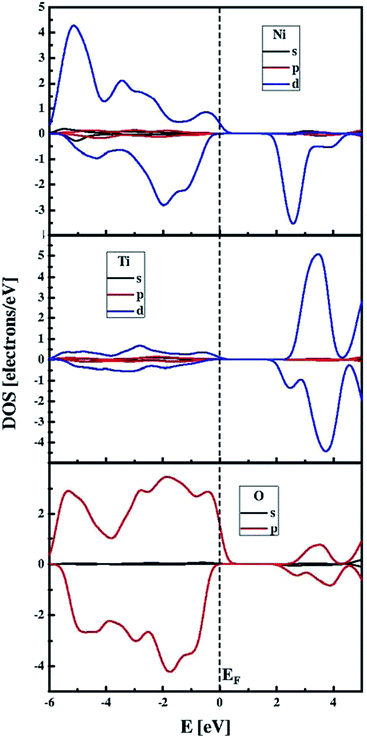
The functional modified by the Hubbard approximation uses parameters that can be chosen for Ti 3d and Ni 3d valence electrons in order to evaluate the energy band gap values. The influence of the chosen Hubbard parameter U on the obtained band gaps is demonstrated in the summary in Table 2. The correct evaluation of the electronic behaviour, in agreement with experimental findings, requires fixed Hubbard parameters at 3.5 eV and 4.5 eV for Ti 3d and Ni 3d electrons, respectively. Thus, the DFT/PBE + U method may provide a satisfactory qualitative electronic structure calculation with the correct choice of the Hubbard parameters. The electronic band structure computed with UTi = 3.5 eV and UNi = 4.5 eV is presented in Fig. 4. This plot indicates that the NiTiO3 structure exhibits a direct semiconducting nature with an energy gap equal to 2.33 eV. Its spin polarized character is also included in the predicted electronic features. Thus, the top of the valence band is constituted by spin polarized alpha electrons while the bottom of the conduction band is composed of the beta state. In addition, the partial density of states depicted in Fig. 5 shows that the spin polarized alpha electrons with energies at the top of the valence band derive from the hybridization of Ni 3d and O 2p orbitals; while hybridization of the Ti 3d and Ni 3d states defines the electronic structure at the bottom of the conduction band, in agreement with the previous work of Salvador et al.66
| Ti 3d | Ni 3d | Eg [eV] |
|---|---|---|
| 0 | 0 | 0.77 |
| 2.5 | 2.5 | 1.75 |
| 3.5 | 4.5 | 2.33 |
| 4.5 | 3.5 | 1.94 |
| 4.5 | 4.5 | 2.46 |
The energy dispersion of the electronic states allows us to calculate the effective masses of charge carriers. The diagonal elements of the effective mass tensor for electrons and holes are calculated as the energy derivatives around the K point of the BZ, following the equations:
 | (5) |
The effective mass of electrons and holes is determined by fitting the conduction and valence bands (see Fig. 4), respectively, to parabolic functions. One may see that the top of the valence band and bottom of the conduction band are symmetric around the K point of the BZ. In this case, the calculated effective masses of the electrons and holes are equal to m*e = 2.0986me and m*h = 0.6836me, with the same values in both the K–Z and K–Γ directions of the BZ. The relatively high values of the reported parameters suggest that the mobility of charges in the investigated NiTiO3 single crystal is relatively low. This result is of particular importance for the very low electrical conductivity (10−9 S m−1) achieved in NiTiO3 at moderate temperatures up to 200 °C.67 The performed calculations confirm that in the studied material the electrical conduction observed at temperatures below 700 K seems to be extrinsic, governed by impurities, interstitial sites, etc. It takes place via the small polaron hopping mechanism.64
Nanocrystalline ilmenite NiTiO3 clusters
Contrary to the results obtained by DFT, the PM6 semi-empirical methodology was successfully applied for such clusters, leading to the correct estimation of the energy gap in nanosized NiTiO3. In Fig. 6, the computed energy differences ΔEHOMO–LUMO versus the cluster sizes are depicted. The reported energy gap splitting as a function of the (NiTiO3)n units demonstrates the size induced quantum confinement effect. This is in agreement with the experimental report69 on NiTiO3 nanoparticles that give rise to a blue shift in the absorption spectra compared to the bulk material. The ΔEHOMO–LUMO value reaches saturation for clusters comprising n ≥ 50 (NiTiO3)n units. The energy gap value for the large clusters saturates at 2.55 eV.
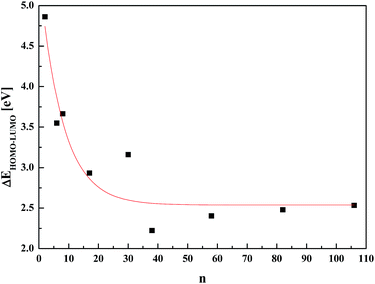 | ||
| Fig. 6 Evaluation of the ΔEHOMO–LUMO energy splitting versus number n of (NiTiO3)n units calculated by the PM6 methodology. | ||
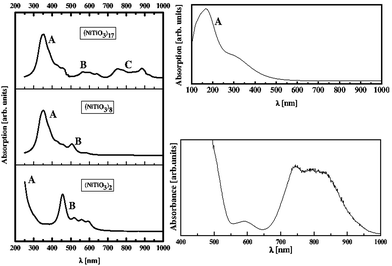
Using the PM6 model, UV-Vis absorption spectra were computed for selected clusters, namely (NiTiO3)2, (NiTiO3)8 and (NiTiO3)17. Large clusters were not considered due to the memory limitations of the computer system. The calculated spectra are presented in Fig. 7, along with the experimental data. A good agreement is demonstrated between the spectrum calculated by the PM6 model for the (NiTiO3)17 cluster and the measured one for the crystalline powder of NiTiO3. Increasing the cluster diameter (unit number n = 2–17), the position of the A band (see Fig. 7 left-hand panel) shifts to the red spectral range. The band labelled B, with pronounced intensity for small clusters, undergoes a red shift and decreases notably in intensity with increasing cluster size. For the cluster (NiTiO3)17 with a diameter of 1.20 nm an additional broad peak C develops in the range 750–900 nm. The broad band in that spectral range was also demonstrated experimentally. The UV-Vis spectrum calculated for the bulk crystal NiTiO3 by using the DFT/PBE + U functional (see Fig. 7, upper right-hand panel) did not match that obtained experimentally in the high wavelength range, where the C band is involved. This confirms that the surface effect in the experimental absorption spectrum of the NiTiO3 powders plays a key role.
The HOMO and LUMO orbitals, depicted in Fig. 8, for the investigated clusters (NiTiO3)2, (NiTiO3)8 and (NiTiO3)17, show their explicit separation and contribute to the low energy absorption spectra. The separation feature between HOMO and LUMO orbitals is not seen for the bulk NiTiO3, where the valence and conduction bands are attributed to the orbitals expanded through the volume of the crystal. The observed details suggest that the separation of the HOMO and LUMO orbitals gives rise to B and C bands.
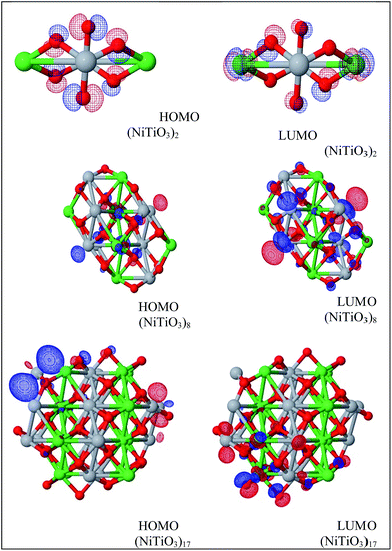 | ||
| Fig. 8 HOMO and LUMO orbitals calculated by the PM6 model for the (NiTiO3)2, (NiTiO3)8 and (NiTiO3)17 clusters. | ||
The comparison of the theoretical and the experimental UV-Vis absorption spectra of the (NiTiO3)17 nanocluster clearly indicates the interesting optical activity of the system in the UV and the visible range of the solar spectrum. A broad absorption edge situated at ∼410 nm is associated with O2− → Ti4+ charge transfer transitions. The higher wavelength shoulder is associated with the crystal field splitting of NiTiO3, giving rise to the Ni2+ → Ti4+ transitions.70 Thus, for the nanosized NiTiO3, the photoinduced charge transfers that are required for photocatalytic reactions may be ensured by several electronic transitions covering the UV and visible light range. These contribute to the efficient photocatalytic activity. Finally, it is worth noting that the resolved details on the theoretical absorption spectra are induced by calculations performed without any influence from the temperature on the structural relaxation of the NiTiO3 clusters. The possibility of reconciling the shapes of the absorption bands between the theory and experiments may be realized through the electron–phonon interactions and the Franck–Condon rule for the optical transition probabilities, as was used in our previous work.71
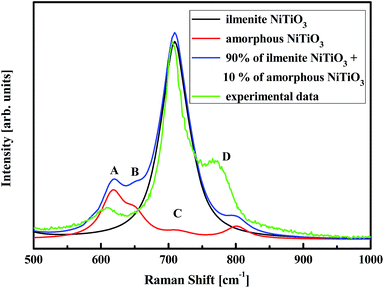 | ||
| Fig. 9 Raman spectra for the (NiTiO3)17 nanoparticles calculated by the parametrised PM6 method as well as experimental spectrum. | ||
For the cluster (NiTiO3)17 with a primarily ilmenite structure, the calculations show only a single mode at position C. The experimental Raman spectrum shows an intense band with a wavenumber position in agreement with the calculated value. The C band is also the most intense detail in the experimental Raman spectrum. The titanates, such as NiTiO3, CoTiO3 and Na4TiO4, possess hexacoordinated Ti–O–Ti groups and their Raman modes are associated with the main band, located at 705, 688, 737 cm−1, respectively.72–74 Therefore, it was established that the Ti–O–Ti stretching mode should appear in the vicinity of 700 cm−1. For NiTiO3, the band at 720 cm−1 corresponds to the Ti–O–Ti vibration of the crystal structure.
The Raman bands named A, B and D, with relatively low intensities compared to the C band, are associated to the full optimization and relaxation of the nanocluster structures. This procedure, which leads to stable amorphous networks, ensures molecular bonding distortions, including changes to bond lengths and angles. Such structural changes modify the vibrational features and, as shown experimentally and theoretically, cause new Raman bands to appear. A superposition of the main Raman band (90%) for O–Ti–O stretching and the secondary bands (10%) related to the amorphous structure leads to a theoretical Raman spectrum that reproduces the features of the experimental one. The slight departures from the experimental band positions may be explained by the fact that anharmonic vibration terms were not considered in the calculation model. The main origin may be related to bond frequency distributions due to amorphization or the occurrence of vacancies or antisites contributing to the damping and frequency shifts of Raman modes.75,76 In this frame, it was proved that the bands located at 617 and 690 cm−1 originate from the stretching of Ti–O and bending of O–Ti–O bonds, while the contribution at 547 cm−1 results from Ni–O bonds.69
As illustrated from the theoretical analysis and the experimental Raman investigations, the organization of the powder material is fully accounted for in the analysis that has been carried out. The particle core brings the signature features of the infinite and bulk crystal, while the outermost particle surface accounts for the amorphous features. This is presumably due to the manifestation of surface states with the relaxation and reconstruction of the outermost particle layers.
Conclusions
The electronic, optical and vibrational properties of (NiTiO3)n nanostructures were investigated and compared to those of bulk ilmenite NiTiO3. The investigated nanostructures possess a spherical shape with the number of (NiTiO3)n units modified from n = 2 up to 183. The PM6 semi-empirical methodology was able to provide a valuable estimation of the energy gap in nanosized NiTiO3 structures. The value of the ΔEHOMO–LUMO saturates at 2.55 eV for the clusters comprising at least n = 50 (NiTiO3)n units. The UV-Vis absorption spectra were calculated using the PM6 methodology for nanostructures and compared with those obtained experimentally. The obtained spectra confirm that the surface effects in NiTiO3 powders contribute with additional band edges. The comparison of the theoretical and the experimental UV-Vis absorption spectra obtained for the (NiTiO3)17 nanocluster clearly indicates the promising optical activity of the system in the UV and the visible range of the solar spectrum. The NiTiO3 nanoclusters also exhibit other relevant properties required for efficient photocatalysis.The calculated Raman spectra for the NiTiO3 clusters show the noticeable contribution of the surface to the vibrational properties. Among the features of the Raman spectra, those related to active modes of the ilmenite structure and those inferred from amorphous NiTiO3 can be distinguished. The theoretical superposition of a Raman band that constitutes 90% of the band intensity, and is associated with the O–Ti–O stretching mode, and secondary less intense bands (10%), related to the amorphous structure, represents the main features of the experimental spectrum.
Finally, the present work points out the relevant optical properties of the NiTiO3 clusters that allow them to harvest visible light for efficient photocatalytic reactions. However, the low mobility of charge carriers, demonstrated from the effective mass estimation, leaves open questions that can be solved using a doping procedure. This is a matter of current development.
Acknowledgements
Calculations have been carried out in Wroclaw Center for Networking and Supercomputing <http://www.wcss.wroc.pl> (Grant no. 171). The MATERIALS STUDIO package was used under POLAND COUNTRY-WIDE LICENSE. The authors acknowledge the financial support of Polonium program 31300 TA – 2014 for researchers’ mobility. Marco Ruiz acknowledges the doctoral school 3MPL and CONACyT-Mexico for the financial support.Notes and references
- L. Linsebigler, G. Lu and J. T. Yates Jr, Chem. Rev., 1995, 95, 735 CrossRef
.
- K. Nakata and A. Fujishima, J. Photochem. Photobiol., C, 2012, 13, 169 CrossRef CAS
.
- S. Bagwasi, B. Tian, J. Zhang and M. Nasir, Chem. Eng. J., 2013, 217, 108 CrossRef CAS
.
- C. L. Torres-Martinez, R. Kho, O. I. Mian and R. K. Mehra, J. Colloid Interface Sci., 2001, 240, 525 CrossRef CAS PubMed
.
- A. Di Paola, E. García-López, G. Marcì and L. Palmisano, J. Hazard. Mater., 2012, 211–212, 3 CrossRef CAS PubMed
.
- Y. Liu, G. Su, B. Zhang, G. Jiang and B. Yan, Analyst, 2011, 136, 872 RSC
.
- D. Deng, S. T. Martin and S. Ramanathan, Nanoscale, 2010, 2, 2685 RSC
.
- M. M. Khin, A. Sreekumaran Nair, V. Jagadeesh Babu, R. Murugan and S. Ramakrishna, Energy Environ. Sci., 2012, 5, 8075 CAS
.
- K. Ariga, S. Ishihara, H. Abe, M. Lia and J. P. Hill, J. Mater. Chem., 2012, 22, 2369 RSC
.
- X. B. Chen, L. Liu, P. Y. Yu and S. S. Mao, Science, 2011, 331, 746 CrossRef CAS PubMed
.
- J. Thomas, K. P. Kumar and S. Mathew, Sci. Technol. Adv. Mater., 2011, 3, 59 CrossRef
.
- X. J. Xu, X. S. Fang, T. Y. Zhai, H. B. Zeng, B. D. Liu, X. Y. Hu, Y. Bando and D. Golberg, Small, 2011, 7, 445 CrossRef CAS PubMed
.
- M. A. Lazar, S. Varghese and S. S. Nair, Catalysts, 2012, 2, 572 CrossRef CAS
.
- K. Hashimoto, H. Irie and A. Fuhjishima, Jpn. J. Appl. Phys., 2005, 44, 8269 CrossRef CAS
.
- S. M. Gupta and M. Tripathi, Chin. Sci. Bull., 2011, 56, 1639 CrossRef CAS
.
- Y. Ruzmanova, M. Ustundas, M. Stoller and A. Chianese, Chem. Eng. Transac., 2013, 32, 2233 Search PubMed
.
- W. F. Yao, X. H. Xu, H. Wang, J. T. Zhou, X. N. Yang, Y. Zhang, S. Shang and B. B. Huang, Appl. Catal., B, 2004, 52, 109 CrossRef CAS
.
- J. Kim, D. W. Hwang, H. G. Kim, S. W. Bae, S. M. Ji and J. S. Lee, Chem. Commun., 2002, 2488 RSC
.
- H. G. Kim, D. W. Hwang and J. S. Lee, J. Am. Chem. Soc., 2004, 126, 8912 CrossRef CAS PubMed
.
- A. Navrotsky, Chem. Mater., 1998, 10, 2787 CrossRef CAS
.
- D. M. Giaquinta and H.-C. zur Loye, Chem. Mater., 1994, 6, 365 CrossRef CAS
.
- J. M. Neil, A. Navrotsky and O. J. Kleppa, Inorg. Chem., 1971, 10, 2076 CrossRef CAS
.
- N. C. Wilson, J. Muscat, D. Mkhonto, P. E. Ngoepe and N. M. Harrison, Phys. Rev. B: Condens. Matter Mater. Phys., 2005, 71, 075202 CrossRef
.
- N. C. Wilson, S. P. Russo, J. Muscat and N. M. Harrison, Phys. Rev. B: Condens. Matter Mater. Phys., 2005, 72, 024110 CrossRef
.
- S. W. Chen, M. J. Huang, P. A. Lin, H. T. Jeng, J. M. Lee, S. C. Haw, S. A. Chen, H. J. Lin, K. T. Lu, D. P. Chen, S. X. Dou, X. L. Wang and J. M. Chen, Appl. Phys. Lett., 2013, 102, 042107 CrossRef
.
- F. J. Craig, Phys. Rev. Lett., 2008, 100, 167203 CrossRef
.
- P. B. Fabritchnyi, M. V. Korolenko, M. I. Afanasov, M. Danot and E. Janod, Solid State Commun., 2003, 125, 341 CrossRef CAS
.
- P. B. Fabritchnyi, A. Wattiaux, M. V. Korolenko, M. I. Afanasov and C. Delmas, Solid State Commun., 2009, 149, 1535 CrossRef CAS
.
- C. Xin, Y. Wang, Y. Sui, Y. Wang, X. Wang, K. Zhao, Z. Liu, B. Li and X. Liu, J. Alloys Compd., 2014, 613, 401 CrossRef CAS
.
- M. Makowska-Janusik and A. Kassiba, Functional Nanostructures and Nanocomposites – Numerical Modeling Approach and Experiment, in Handbook of Computational Chemistry, ed. J. Leszczynski, Springer, 2012 Search PubMed
.
- M. Makowska-Janusik, O. Gladii, A. Kassiba, J. Boucle and N. Herlin-Boime, J. Phys. Chem. C, 2014, 118, 6009 CAS
.
- H. Melhem, P. Simon, J. Wang, C. Di Bin, B. Ratier, Y. Leconte, N. Herlin-Boime, M. Makowska-Janusik, A. Kassiba and J. Boucle, Sol. Energy Mater. Sol. Cells, 2013, 117, 624 CrossRef CAS
.
- P. S. Anjana and M. T. Sebastian, J. Am. Ceram. Soc., 2006, 89, 2114 CAS
.
- S. J. Clark, M. D. Segall, C. J. Pickard, P. J. Hasnip, M. J. Probert, K. Refson and M. C. Payne, Z. Kristallogr., 2005, 220, 567 CAS
.
- B. G. Pfrommer, M. Cate, S. G. Louie and M. L. Cohen, J. Comput. Phys., 1997, 131, 233 CrossRef CAS
.
- J. P. Perdew, K. Burke and M. Ernzerhof, Phys. Rev. Lett., 1996, 77, 3865 CrossRef CAS PubMed
.
- J. Heyd, G. E. Scuseria and M. Ernzerhof, J. Chem. Phys., 2003, 118, 8207 CrossRef CAS
.
- J. Heyd, G. E. Scuseria and M. Ernzerhof, J. Chem. Phys., 2006, 124, 219906 CrossRef
.
- K. Hummer, J. Harl and G. Kresse, Phys. Rev. B: Condens. Matter Mater. Phys., 2009, 80, 115205 CrossRef
.
- P. Śpiewak, J. Vanhellemont and K. J. Kurzydłowski, J. Appl. Phys., 2011, 110, 063534 CrossRef
.
- M. E. Foster and B. M. Wong, J. Chem. Theory Comput., 2012, 8, 2682 CrossRef CAS PubMed
.
- B. W. Wong, M. Piacenza and F. D. Sala, Phys. Chem. Chem. Phys., 2009, 11, 4498 RSC
.
- C. O. Almbladh and A. C. Pedroza, Phys. Rev. A, 1984, 29, 2322 CrossRef CAS
.
- M. Levy, J. P. Perdew and V. Sahni, Phys. Rev. A, 1984, 30, 2745 CrossRef
.
- A. Dreuw, J. L. Weisman and M. Head-Gordon, J. Chem. Phys., 2003, 119, 2943 CrossRef CAS
.
- M. S. Hybertsen and S. G. Louie, Phys. Rev. B: Condens. Matter Mater. Phys., 1986, 34, 5390 CrossRef CAS
.
- W. Kohn and L. J. Sham, Phys. Rev. A, 1965, 140, 1133 CrossRef
.
- D. C. Langreth and J. P. Perdew, Phys. Rev. B: Condens. Matter Mater. Phys., 1980, 21, 5469 CrossRef
.
- P. J. Stephenset, F. J. Devlin, C. F. Chabalowski and M. J. Frisch, J. Phys. Chem., 1994, 98, 11623 CrossRef
.
- J. P. Perdew, M. Ernzerhof and K. Burke, J. Chem. Phys., 1996, 105, 9982 CrossRef CAS
.
- J. Heyd, G. E. Scuseria and M. Ernzerhof, J. Chem. Phys., 2003, 118, 8207 CrossRef CAS
.
- V. I. Anisimov, J. Zaanen and O. K. Andersen, Phys. Rev. B: Condens. Matter Mater. Phys., 1991, 44, 943 CrossRef CAS
.
- A. Jain, G. Hautier, S. P. Ong, C. J. Moore, C. C. Fischer, K. A. Persson and G. Ceder, Phys. Rev. B: Condens. Matter Mater. Phys., 2011, 84, 045115 CrossRef
.
- R. Laskowski, N. E. Christensen, P. Blaha and B. Palanivel, Phys. Rev. B: Condens. Matter Mater. Phys., 2009, 79, 165209 CrossRef
.
- Q. J. Liu and Z. T. Liu, Appl. Phys. Lett., 2011, 99, 091902 CrossRef
.
- A. Sayede, R. Khenata, A. Chahed and O. Benhelal, J. Appl. Phys., 2013, 113, 173501 CrossRef
.
- J. R. Huang and C. Cheng, J. Appl. Phys., 2013, 113, 033912 CrossRef
.
- MOPAC2012: Stewart, J. J. P. Stewart Computational Chemistry, Colorado Springs: CO, http://OpenMOPAC.net.
- J. J. P. Stewart, J. Mol. Model., 2007, 13, 1173 CrossRef CAS PubMed
.
- J. Baker, J. Comput. Chem., 1986, 7, 385 CrossRef CAS
.
- T. Helgaker, Chem. Phys. Lett., 1991, 182, 503 CrossRef CAS
.
- P. Culot, G. Dive, V. H. Nguyen and J. M. Ghuysen, Theor. Chim. Acta, 1992, 82, 189 CrossRef CAS
.
- Y. Qu, W. Zhou, Z. Ren, S. Du, X. Meng, G. Tian, K. Pan, G. Wanga and H. Fu, J. Mater. Chem., 2012, 22, 16471 RSC
.
- R. S. Singh, T. H. Ansari, R. A. Singh and B. M. Wanklyn, Mater. Chem. Phys., 1995, 40, 173 CrossRef CAS
.
- J.-L. Wang, Y.-Q. Li, Y.-J. Byon, S.-G. Mei and G.-L. Zhang, Powder Technol., 2013, 235, 303 CrossRef CAS
.
- P. Salvador, C. Gutierrez and J. B. Goodenough, Appl. Phys. Lett., 1982, 40, 188 CrossRef CAS
.
- S. Yuvaraj, V. D. Nithya, K. Saiadali Fathima, C. Sanjeeviraja, G. Kalai Selvan, S. Arumugam and R. Kalai Selvan, Mater. Res. Bull., 2013, 48, 1110 CrossRef CAS
.
- T. Stein, H. Eisenberg, L. Kronik and R. Baer, Phys. Rev. Lett., 2010, 105, 266802 CrossRef PubMed
.
- R. Vijayalakshmi and V. Rajendran, E-J. Chem., 2012, 9, 282 CrossRef CAS
.
- K. P. Lopes, L. S. Cavalcante, A. Z. Simoes, J. A. Varela, E. Longo and E. R. Leite, J. Alloys Compd., 2009, 468, 327 CrossRef CAS
.
- A. Kassiba, M. Makowska-Janusik, J. Boucle, J. F. Bardeau, A. Bulou and N. Herlin-Boime, Phys. Rev. B: Condens. Matter Mater. Phys., 2002, 66, 155317 CrossRef
.
- Y. Su and M. L. Balmer, J. Phys. Chem. B, 2000, 104, 8160 CrossRef CAS
; G. Busca, G. Ramis, J. M. Gallardo Amcres, V. Sanchez Escribano and P. Piaggio, J. Chem. Soc., Faraday Trans., 1994, 90, 3181 RSC
.
- F. X. Llabrés i Xamena, A. Damin, S. Bordiga and A. Zecchina, Chem. Commun., 2003, 1514 RSC
.
- M. I. Baraton, G. Busca, M. C. Prieto, G. Ricchiardi and V. Sanchez Escribano, J. Solid State Chem., 1994, 112, 9 CrossRef CAS
.
- B. A. Scott and G. Burns, J. Am. Ceram. Soc., 1972, 55, 225 CrossRef CAS
.
- J. B. Bellam, M. A. Ruiz-Preciado, M. Edely, J. Szade, A. Jouanneaux and A. Kassiba, RSC Adv., 2015, 5, 10551 RSC
.
| This journal is © The Royal Society of Chemistry 2015 |

