Preparation and characterization of a polyethersulfone/polyaniline nanocomposite membrane for ultrafiltration and as a substrate for a gas separation membrane
Shu Zhuabc,
Mengqi Shiabc,
Song Zhao*abc,
Zhi Wangabc,
Jixiao Wangabc and
Shichang Wangabc
aChemical Engineering Research Center, School of Chemical Engineering and Technology, Tianjin University, Tianjin 300072, P. R. China. E-mail: songzhao@tju.edu.cn; Fax: +86 02227404496; Tel: +86 02227404533
bTianjin Key Laboratory of Membrane Science and Desalination Technology, Tianjin 300072, P. R. China
cState Key Laboratory of Chemical Engineering (Tianjin University), Synergetic Innovation Center of Chemical Science and Engineering, Tianjin 300072, P. R. China
First published on 10th March 2015
Abstract
In this work, polyethersulfone (PES)/polyaniline (PANI) nanocomposite membranes were fabricated by an immersion precipitation process through incorporation of uniform and well-dispersed PANI nanorods. Transmission electron microscopy (TEM) and dynamic light scattering (DLS) were used to identify the nanoparticle size and dispersion. The influence of incorporated PANI nanorods on membrane structure was investigated by attenuated total reflectance Fourier transform infrared spectroscopy (ATR-FTIR) and scanning electron microscopy (SEM). The properties of the nanocomposite membrane were evaluated by water contact angle, cross-flow ultrafiltration (UF) and antifouling measurements. The results indicated that the surface pore structure and hydrophilicity of PES membrane were improved by the incorporation of PANI nanorods. The PES/PANI nanocomposite membrane showed higher flux and better antifouling properties compared to the pure PES membrane without sacrificing the separation performance of BSA protein. Meanwhile, PES/PANI nanocomposite membrane was also used as the substrate to prepare a gas separation composite membrane by coating polyvinylamine (PVAm) aqueous solution on the surface. The gas permeation results showed that the PVAm/PES/PANI composite membrane exhibited higher gas permselectivity for CO2–N2 separation than the PVAm/PES composite membrane, which may result from the improved surface porosity of PES/PANI substrate and the improved interface adhesion between the selective layer and the substrate.
1. Introduction
Since the first commercial membrane was invented via a phase inversion method in the 1960s, membrane separation technologies have been developing rapidly. To date, several major processes including ultrafiltration (UF), reverse osmosis (RO) and gas separation (GS) have been established in large-scale membrane production, and their applications cover almost every industrial sector including environmental, energy, chemical and biotechnological areas.1,2 However, low permeability and serious membrane fouling have been considered to be “bottlenecks” in the industrial applications of membrane separation technologies due to the increase of operational cost. Currently, much effort is being devoted to improve the permeability and antifouling property of the existing membranes.Poly(ether sulfone) (PES) is widely used commercial UF membrane material due to its good physico-chemical stability and easy processing capacity. It can be applied directly in UF process, such as wastewater treatment, purification and fractionation of various products in food and biotechnological industries.2–4 Besides, it appears to be used as the substrate for fabricating RO or GS composite membranes. However, the inherent hydrophobicity of PES molecular structure not only leads to low flux and poor antifouling property of the prepared UF membrane, but also influences the uniformity of the formation and spreading of selective layer over it. Therefore, the modified PES membrane with excellent hydrophilicity, permeability and antifouling property is of great significance to the applications in UF process as well as composite membrane fabrication.
Numerous efforts have been made in order to improve the property of PES membrane, including surface coating,5,6 surface grafting polymerization7,8 and hydrophilic modifier blending.9,10 Among these methods, modifier blending appears to be a promising modification method because of its facile operation, high efficiency and low cost.11 Besides, in the blending technique, the changes in the composition of the casting solution could result in the improvement of the entire membrane structure. In the recent years, hydrophilic nanoparticles, including silica (SiO2) nanoparticles, titania (TiO2) nanoparticles and carbon nanotubes (CNT) were blended into PES matrix to fabricate nanocomposite membranes with improved property.12–17 It has been demonstrated that the addition of nanomaterials could enhance surface hydrophilicity, water flux and fouling resistance of PES membrane, and the modification effect of nanoparticles is closely related to their size distribution, dispersion and surface property.14–18 Vatanpour et al. investigated the effect of TiO2 nanoparticles on performance of PES/TiO2 hybrid membrane and found TiO2 nanoparticles with smaller size and higher surface area could effectively improve membrane hydrophilicity and antifouling property.15 Zhang et al. modified TiO2 nanoparticles with 2-hydroxyethyl methacrylate to overcome the agglomeration of nanoparticles and used it for membrane blending modification.17
PES membrane, having surface pore sizes ranging from 1 nm to 30 nm, is frequently used as the substrate for fabricating composite membrane via interfacial polymerization or coating method.19,20 Generally, the permeability and selectivity of composite membrane are mainly influenced by the properties of selective layer. While recently more and more researchers are realizing the importance of porous support membrane on the performance of composite membrane and attempt to figure out the suitable properties of substrates for fabricating composite membrane.19–26 In the published studies, the surface properties of the substrates were mainly altered by varying the polymer concentration21 and blending polyvinylpyrrolidone (PVP) or poly(ethylene glycol) (PEG)23 in the casting solution. It was reported that the porous support membrane could exert an effect on the selective layer structure besides providing the mechanical support for composite membrane. During the fabrication of RO composite membrane by interfacial polymerization, the surface hydrophilicity and pore size of the substrate have close relation with the thickness, roughness and cross-linking degree of polyamide selective layer.24 During the fabrication of GS composite membrane by coating, the pore size or surface functional groups of the substrate could influence the interface structure between the selective layer and support layer.25,26
As one of the most promising conducting polymers, polyaniline (PANI) has received great attention as a membrane material or blending modifier during the preparation of UF and GS membranes.27–34 PANI nanomaterials could be incorporated into the casting solution or coating solution to modify the porous membrane or the selective layer of the composite membrane.30–34 The results indicated that the incorporation of PANI nanofibers or nanospheres could regulate the surface hydrophilicity and pore size of the porous membrane.30–32 In the previous study, polyvinylamine (PVAm) aqueous solution was usually coated onto commercial polysulfone substrate to fabricate composite gas separation membrane, and the prepared PVAm/polysulfone gas separation membrane showed low CO2 permselectivity. Small molecules or nanomaterials were used to incorporate into PVAm coating solution to modify the structure of selective layer to enhance the gas separation performance of composite membrane.33–35 Different with the previous studies, this work focuses on the investigation of PES/PANI nanocomposite membrane performing as both UF membrane with enhanced performance and effective substrate for GS composite membrane. PANI nanomaterials were incorporated into PES polymer to modify the surface pore and hydrophilicity of the membrane. In order to emphatically investigate the effect of substrate on separation performance of GS composite membrane, the selective layer is kept as pure PVAm. To the best of our knowledge, this is the first report using PES/PANI nanocomposite membrane as the substrate to prepare composite membrane.
The investigation in this work can be divided into three aspects. First, uniform and well-dispersed PANI nanorods were synthesized through dispersion polymerization. The size distribution and dispersity of PANI nanorods were determined by transmission electron microscope (TEM) and dynamic light scattering (DLS). Second, PANI nanorods were used as the blending modifier to prepare PES/PANI nanocomposite membrane. The effects of PANI nanorods on membrane structure and properties, including surface and cross-sectional morphology, pure water flux, protein rejection and antifouling properties, were investigated. Third, non-woven fabrics supported PES and PES/PANI membrane was fabricated and used as the substrate for fabricating GS composite membrane using PVAm as the selective layer. The effects of the surface property of substrates on gas permselectivity of composite membrane were investigated in terms of CO2 permeance and CO2–N2 selectivity.
2. Material and methods
2.1 Materials
A commercial Radel® PES (Ultrason E6020P, with Mw = 58![[thin space (1/6-em)]](https://www.rsc.org/images/entities/char_2009.gif) 000 g mol−1) purchased from BASF was used as membrane material. Aniline, hydrochloric acid (HCl), ammonium peroxydisulfate (APS), 1-methyl-2-pyrrolidone (NMP) and acetone were purchased from Kewei Chemical Reagent Co. Ltd. (Tianjin, China). Aniline was distilled under reduced pressure to purify before use. Polyvinylpyrrolidone (PVP, K96) and egg albumin (EA, 43 kDa) were supplied by Aladdin Reagent Co. (Shanghai, China). BSA (molecular weight: 67 kDa) was electrophoresis pure and purchased from Zhengjiang High-technology Co. (Tianjin, China). PVAm was synthesized through the polymerization of N-vinylformamide monomer in deionized water with 2,2′-azobis (2-methylpropion-amidine) dihydrochloride as an initiator.36 The molecular weight of PVAm is 3.7 × 10⁵ g mol−1, which was measured with the viscosity method.35 Non-woven polyester fabrics were provided by Vontron Technology Co., Ltd. (Guiyang, China) and used for preparing supported membrane. Pure water was manufactured by a reverse osmosis system.
000 g mol−1) purchased from BASF was used as membrane material. Aniline, hydrochloric acid (HCl), ammonium peroxydisulfate (APS), 1-methyl-2-pyrrolidone (NMP) and acetone were purchased from Kewei Chemical Reagent Co. Ltd. (Tianjin, China). Aniline was distilled under reduced pressure to purify before use. Polyvinylpyrrolidone (PVP, K96) and egg albumin (EA, 43 kDa) were supplied by Aladdin Reagent Co. (Shanghai, China). BSA (molecular weight: 67 kDa) was electrophoresis pure and purchased from Zhengjiang High-technology Co. (Tianjin, China). PVAm was synthesized through the polymerization of N-vinylformamide monomer in deionized water with 2,2′-azobis (2-methylpropion-amidine) dihydrochloride as an initiator.36 The molecular weight of PVAm is 3.7 × 10⁵ g mol−1, which was measured with the viscosity method.35 Non-woven polyester fabrics were provided by Vontron Technology Co., Ltd. (Guiyang, China) and used for preparing supported membrane. Pure water was manufactured by a reverse osmosis system.
2.2 Synthesis and characterization of PANI nanorods
PANI nanorods were synthesized using the dispersion polymerization method with APS as the oxidant and PVP (K96) as the steric stabilizer, according to a published procedure.37,38 Firstly, PVP aqueous solution was prepared by adding 0.7 g Aniline and 1 g PVP in 35 ml pure water with stirring for about 4 h at 0 °C. APS aqueous solution was made by dissolving 0.45 g APS in acid medium and dropwise added to PVP aqueous solution. The polymerization was allowed to proceed at about 5 °C for 12 h. At last, the product was obtained by precipitation with an excess of acetone and centrifugation.Morphology of PANI nanorods was characterized using transmission electron microscopy (TEM, JEM-100 CX, JEOL). The particle size distribution of PANI nanorods was determined based on dynamic light scattering (DLS) method using Master Sizer Laser Diffraction Particle Size Analyzer (Malvern Instrument Ltd., Malvern, UK). The chemical composition of PANI nanorods was confirmed by Fourier transform infrared spectroscopy (FTIR) and ultraviolet-visible (UV-vis) spectroscopy. FTIR spectrum was carried out on a spectrometer (FTS-6000, Bio-Rad, USA). UV-vis spectrum was recorded using a spectrometer (TU-1810DPC, China).
2.3 Fabrication and characterization of unsupported PES/PANI nanocomposite UF membrane
In order to measure porosity, the membrane sample with known area was immersed in distillated water for at least 12 h to make sure that all the membrane pores were filled. After that, the sample was weighted immediately after cleaning water on the surface cautiously (mw). Subsequently, the samples were dried at 60 °C for 12 h to remove water from membrane pores and weighted in dry state (md). For one sample, at least three measurements were conducted to minimize experimental error and guarantee the accuracy. Porosity, ε, the ratio of pore volume to geometrical volume for the membranes, was calculated using eqn (1).
 | (1) |
The pure water flux of the membrane sample, having an effective area of 19.3 cm2, was tested using a cross-flow UF experimental apparatus.31 Initially, the membrane was operated at transmembrane pressure (TMP) of 0.30 MPa for precompaction and stabilization. Then, the pure water flux was measured at 0.20 MPa and calculated using eqn (2).
 | (2) |
BSA and EA rejections of the membranes were tested using 1.0 g L−1 BSA and EA aqueous solution. The protein concentrations in the feed solution and the permeate solution were measured by UV-vis spectrophotometer at the wavelength of 280 nm. Protein rejection (%R) was calculated by eqn (3).
 | (3) |
In order to study membrane fouling, protein solution composed of a 200 mg L−1 BSA aqueous solution was injected into the filtration system and the flux (JP) was continuously recorded for one hour. After BSA filtration, the membrane was cleaned with pure water for 10 minutes and water flux of cleaned membranes (Jw2) was measured. The flux decline tendency was recorded during the filtration and the flux recovery ratio (FRR) was calculated by eqn (4) to assess the antifouling property of the membrane.
 | (4) |
2.4 Fabrication and characterization of PVAm/PES/PANI composite GS membrane
Increasing the polymer concentration for fabricating the substrate is due to the following reasons. Firstly, the performance of gas separation membrane is commonly investigated under the feed pressures ranging from 0.1 to 2.0 MPa, which are higher than ultrafiltration. Thus, the substrates of the composite membrane should provide sufficient mechanical stability to prevent the compaction or collapse of membranes when being applied to high pressure processes.39 Increasing the polymer concentration is an effective method for increasing the mechanical stability by reducing the macrovoids, which were considered as weak points that may lead to mechanical deformation of the polymeric membrane matrix in high pressure or vibrational operation.40 Thus, considering the resistance to pressure, the PES concentration was increased to 20 wt% for fabricating the substrate of gas separation membrane. Secondly, the PES concentration was increased to 20 wt% because the high viscosity was needed for casting the solution on the porous non-woven fabrics. When the casting solution containing 15 wt% of PES was cast onto the non-woven fabrics, it would leak in passing through the non-woven fabrics. Thus, the PES concentration in the casting solution was increased to 20 wt% to enhance the viscosity, thereby effectively prevent the leakage during the preparation of the substrates.
Composite GS membrane was prepared by coating 2.0 wt% of PVAm aqueous solution on non-woven fabrics supported PES and PES/PANI substrates with a pre-set wet coating thickness of 100 μm. Prior to the test, the composite membrane was dried in an artificial climate chamber (Climacell 222R, Germany) at 30 °C and 40% relative humidity for about 24 h.
3. Results and discussion
3.1 Characterization of PANI nanorods
TEM image and the particle size distributions of PANI nanorods are shown in Fig. 1. It can be seen that PANI nanoparticles exhibit uniform rod-like shape and well dispersion. The average diameter and length of PANI nanorods are 72 and 184 nm, respectively. Dynamic light scattering (DLS) measurement was also performed on PANI nanorods aqueous dispersion in order to estimate the size distribution and polydispersity index (PDI). As can be seen in Fig. 1(c), PANI nanorods in aqueous dispersion have a narrow particle size distribution. The average particle size measured by DLS is 236 nm, which is larger than the average length measured by TEM. This may result from the test condition and the dispersibility of the samples. For one thing, The DLS measurement yields an ensemble average of the particle size in dispersion while the TEM provides information about the size distribution of dehydrated and immobilized particles.41 The dehydration of TEM sample may lead to structural distortions compared to the solvent swollen state, which displays a smaller particle size. For another, the dispersibility influences the particle size value during DLS measurement. Nanoparticles may form agglomerates in a solution, resulting in the larger measured value.42 Thus, the particle size of PANI nanorods measured using DLS is larger than those measured by TEM analysis. The PDI is measured as 0.067, indicating the well dispersion state of nanorods. The dispersion of nanomaterials is related to the stability of the casting solution. Therefore, uniform and well-dispersed PANI nanorods will benefit the preparation and stability of the casting solution. | ||
| Fig. 1 TEM image and the particle size distributions of PANI nanorods measured by Malvern Master Sizer. | ||
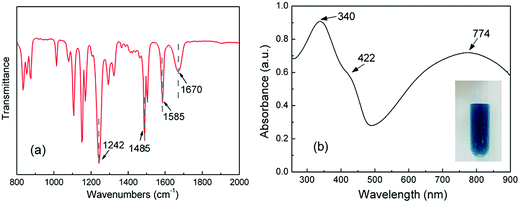
Fig. 2 shows the FTIR and UV-vis spectra of PANI nanorods. The bands at 1585, 1485, and 1242 cm−1 in the FTIR spectrum of PANI nanorods can be ascribed to C![[double bond, length as m-dash]](https://www.rsc.org/images/entities/char_e001.gif) C stretching of quinoid (Q) ring, benzenoid (B) ring, and C–N stretching mode of the benzenoid ring of PANI, respectively.37 Due to the existence of PVP during the synthesis of PANI, the precipitating PANI nanomaterials would get attached to PVP.43 As can be seen from FTIR spectrum, the band at 1670 cm−1 is attributed to C
C stretching of quinoid (Q) ring, benzenoid (B) ring, and C–N stretching mode of the benzenoid ring of PANI, respectively.37 Due to the existence of PVP during the synthesis of PANI, the precipitating PANI nanomaterials would get attached to PVP.43 As can be seen from FTIR spectrum, the band at 1670 cm−1 is attributed to C![[double bond, length as m-dash]](https://www.rsc.org/images/entities/char_e001.gif) O group of PVP adsorption on PANI nanorods by hydrogen bonding during the dispersion polymerization.43 As can be seen in Fig. 2(b), the UV-vis spectrum of PANI nanorods shows three peaks at 340, 422 and 774 nm in accordance with the reported spectra of PANI nanorods.37,38 The first peak is assigned to π → π* transition of the benzenoid ring. The second and third absorption bands are related to the doping level and the formation of polaron. The picture shows good dispersity of PANI nanorods in water.
O group of PVP adsorption on PANI nanorods by hydrogen bonding during the dispersion polymerization.43 As can be seen in Fig. 2(b), the UV-vis spectrum of PANI nanorods shows three peaks at 340, 422 and 774 nm in accordance with the reported spectra of PANI nanorods.37,38 The first peak is assigned to π → π* transition of the benzenoid ring. The second and third absorption bands are related to the doping level and the formation of polaron. The picture shows good dispersity of PANI nanorods in water.
3.2 Characterization of unsupported PES/PANI nanocomposite UF membrane
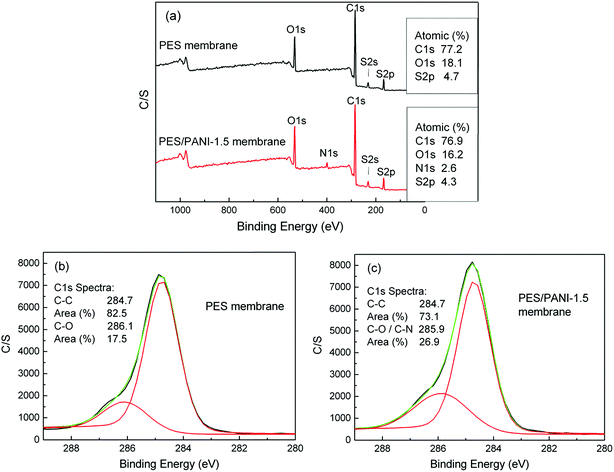
XPS analysis is employed to further investigate the chemical compositions of membrane surface. Fig. 4 presents XPS spectra of PES membrane and PES/PANI-1.5 nanocomposite membrane. It can be seen that the emission peak for nitrogen at 401 eV appeared on the spectrum of PES/PANI-1.5 nanocomposite membrane. For PES membrane, XPS signal observed at C1s region at 284.7 eV is attributed to alkyl carbon (C–C), and that at 286.1 eV is attributed to ether carbons (C–O). For the PES/PANI-1.5 nanocomposite membrane, XPS signal observed at C1s region at 284.7 eV is attributed to C–C peak, and that at 285.9 eV is attributed to C–O and C–N peaks. The area ratio of the peaks was also calculated and it can be seen that the area ratio of C–O/C–N peak increases from 17.5% to 26.9% with the addition of PANI nanorods.
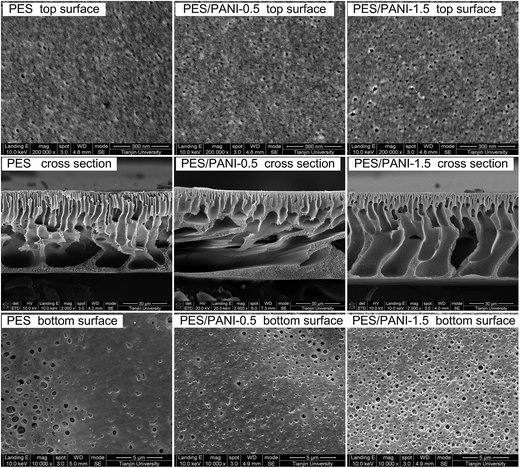 | ||
| Fig. 5 Top surface, cross-sectional and bottom surface SEM images of PES membrane and PES/PANI nanocomposite membranes. | ||
| Membranes | Surface pore size (nm) | Porosity (%) | Contact angle (°) | FRR (%) | ||
|---|---|---|---|---|---|---|
| 1st cycle | 2nd cycle | 3rd cycle | ||||
| PES | 8.9 ± 1.8 | 64.7 ± 2.1 | 75.2 ± 3.0 | 57 | 48 | 40 |
| PES/PANI-0.5 | 10.2 ± 1.9 | 77.8 ± 2.5 | 63.6 ± 3.7 | 83 | 66 | 50 |
| PES/PANI-1.5 | 11.8 ± 2.3 | 81.2 ± 2.4 | 60.1 ± 2.6 | 68 | 62 | 49 |
In order to detect the distribution of PANI nanorods in the membrane matrix, element mapping was conducted with scanning microscope equipped with energy dispersive X-ray spectrum Meter (EDX, Genesis XM2 APEX 60SEM). As shown in Fig. 6, the N element, highlighted as the green spot, shows even distribution in the membrane cross-section. Since there is no N element in the molecule of PES, the N element represents the existence of PANI nanorods, thereby indicating that the nanorods were homogeneously distributed in the membrane matrix.
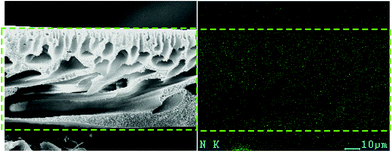 | ||
| Fig. 6 EDX mapping image of N element distribution in cross-sectional SEM images of PES/PANI-0.5 nanocomposite membrane. | ||
As can be seen in Table 1, the water contact angles of PES/PANI nanocomposite membranes are lower than that of PES membrane. These results indicated that the addition of PANI nanorods improved membrane surface hydrophilicity, which may be because the hydrophilic nanorods embedded in the prepared membrane are favorable to the high affinity to water of the surface.
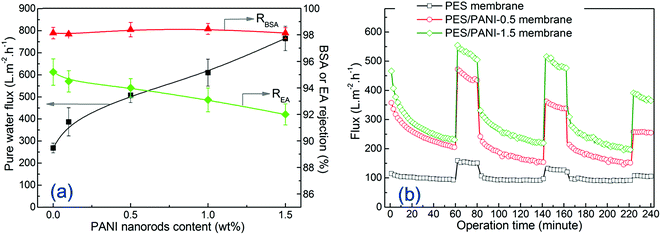 | ||
| Fig. 7 (a) Pure water flux, BSA and EA rejection of the membranes at 0.20 MPa; (b) time-dependent fluxes of the membranes during the filtration of 200 mg L−1 BSA solution at 0.20 MPa. | ||
To determine the effect of PANI nanomaterials on antifouling property, the filtration of BSA solution was performed on the PES membrane and PES/PANI nanocomposite membranes. As shown in Fig. 7(b), the filtration includes three BSA filtrations during 0–60th, 80–140th and 160–220th minutes and three water filtrations during 60–80th, 140–160th and 220–240th minutes. It can be seen that the BSA flux of all the membranes decreased rapidly with the operation time due to the absorption and deposition of BSA molecular on membrane surface and pore. The time-dependent BSA fluxes of PES/PANI nanocomposite membranes were obviously higher than that of PES membrane. After BSA filtration, the protein molecules may be entrapped in the pores and cannot be easily removed by hydraulic cleaning. Thus, the water flux of all the membranes after cleaning can not be fully recovered to the initial value. The calculated flux recovery values are summarized in Table 1 to further evaluate the antifouling properties of the membranes. It can be seen that the FRR values of PES/PANI nanocomposite membranes were higher than that of the pure PES membrane during the three cycles. Generally, membrane antifouling property is influenced by membrane hydrophilicity and surface pore size. Hydrophilic membrane surface could not be absorbed by protein molecules. The membrane with larger surface pore size could easily suffer serious pore blocking or pore adsorption than the membrane with smaller surface pore size.46,47 Therefore, it is reasonable to deduce that the more hydrophilic the membrane surface is and the smaller the surface pore size is, the better the membrane antifouling property is. Thus, the relatively low FRR value of PES/PANI-1.5 membrane during the first cycle may be due to its larger surface pore size, making the foulant easily cumulate and block up the surface pore. In comparison to those in the first cycle, the FRR values of all the membranes during the second and third cycles decrease, which may be due to the aggravation of membrane fouling. The FRR value of PES membrane during the second cycles is 48% while FRR values of PES/PANI nanocomposite membranes kept above 60%. On the whole, during the filtration of BSA solution, it can be found that PES/PANI nanocomposite membranes always showed higher BSA fluxes and better antifouling property than PES membrane, which can result from the improvement of membrane flux and hydrophilicity by incorporating PANI nanorods.
Based on an overall consideration of water flux, protein rejection and antifouling property, PES/PANI nanocomposite membrane with incorporating 0.5 wt% PANI nanorods exhibited the optimal property during the ultrafiltration process.
3.3 Characterization of PES/PANI substrate and PVAm/PES/PANI composite GS membrane
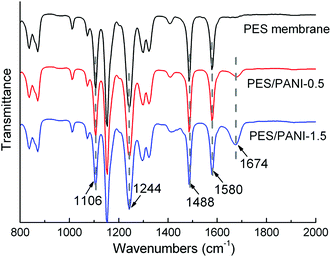
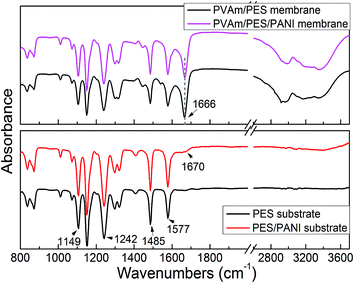
![[double bond, length as m-dash]](https://www.rsc.org/images/entities/char_e001.gif) O stretching vibration.
O stretching vibration.
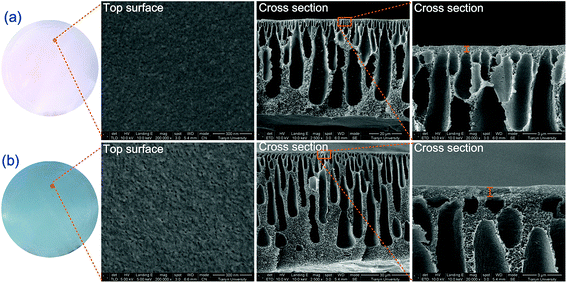
It can be seen from the top surface SEM image that PES/PANI substrate exhibited a little larger and more surface pore than PES substrate, which was in accordance with the results in Section 3.2.2. Thus, the surface porosity of PES/PANI substrate was much larger than that of PES substrate. The cross-sectional SEM images showed that there was little macrovoids in the sublayer of the membranes, which may result from the high casting solution viscosity by increasing PES content. Compared with PES substrate, the skin layer became thick in the cross section of PES/PANI substrate. The thicker skin layer of PES/PANI substrate can be explained by the viscosity of the casting solution and phase inversion kinetics. In the casting solution for fabricating PES/PANI substrate, the interaction between PANI nanorods and NMP decreased the effective solvating power of NMP for PES, which resulted in the inter-molecular and intra-molecular entanglements of the polymer chains and then caused the increase of the casting solution viscosity.49 Generally, the high viscosity of casting solution can hinder the diffusional exchange rate of solvent (NMP) and nonsolvent (water) during the phase separation, resulting in the formation of a thick skin layer.50 Consequently, the kinetic hindrance due to viscosity caused the thick skin layer of PES/PANI substrate.
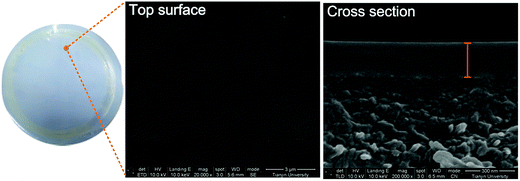
Fig. 10 shows top surface and cross-sectional SEM images of PVAm selective layer in PVAm/PES/PANI composite GS membranes. It can be seen that the top surface of PVAm selective layer was intact and even. The thickness of PVAm selective layer was measured as around 220 nm from the cross-sectional SEM image. Besides, it can be seen from the cross-sectional SEM image that the PVAm selective layer has a certain interfacial adhesion with the substrate.
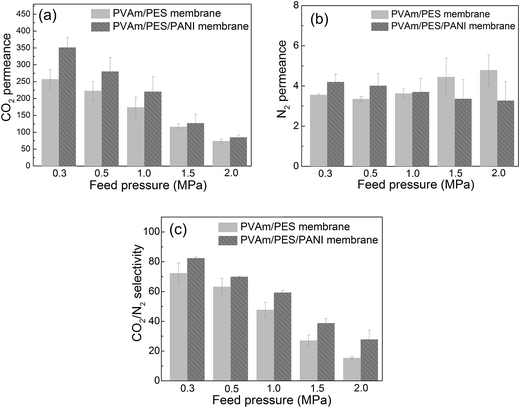 | ||
| Fig. 11 The gas separation properties of PVAm/PES and PVAm/PES/PANI composite GS membranes, (a) CO2 permeance, (b) N2 permeance and (c) CO2–N2 selectivity. | ||
Compared with PVAm/PES membrane, it can be seen that the CO2 permeance, N2 permeance and CO2–N2 selectivity were increased by using PES/PANI substrate. At 0.30 MPa of the feed pressure, the CO2 permeance and CO2–N2 selectivity increased about 36% and 14%, respectively, when using PES/PANI substrate instead of PES substrate. At 2.0 MPa of the feed pressure, the CO2 permeance and CO2–N2 selectivity increased about 15% and 82%, respectively, when using PES/PANI substrate instead of PES substrate. Besides, in the previous study, PVAm aqueous solution was usually coated onto the commercial polysulfone substrate to fabricate composite GS membrane.33,34 The prepared PVAm/polysulfone composite GS membrane showed around 100 GPU of CO2 permeance and around 50 of CO2–N2 selectivity at 0.30 MPa of the feed pressure. While in this study, the prepared PVAm/PES/PANI composite GS membrane showed around 350 GPU of CO2 permeance and 80 of CO2–N2 selectivity at 0.30 MPa of the feed pressure. Thus, it can be seen that the substrate characteristics exert influence on the separation performance of composite GS membrane.
Since the same PVAm coating solution was used to fabricate composite GS membrane, the difference in gas properties of the composite membranes could be ascribed to the different structure of the substrate, which would exert an influence on the interface between selective layer and substrate. Henis and Tripodi proposed a model to analyze the transport behaviour of composite gas separation membranes.54 The total resistance of a composite membrane consists of four parts, i.e. the resistance of the top selective layer, the “dense region” of the substrate, the intruded polymer and the bulk substrate. In the study of Li et al.,26 the total resistance was simplified by ignoring the resistance of bulk substrate under the condition that the top coating layer had a much higher permeability than the support layer. The simplified equation of total resistance is as follows and the symbols are presented in Fig. 12.
 | ||
| Fig. 12 Schematic diagram of gas transport through PVAm/PES and PVAm/PES/PANI composite GS membranes. | ||
According to the Equation, the influence of the substrate on total resistance of composite membrane have relations with the intrusion depth (l2) and the surface area of porous region (A2). The decrease in l2 and the increase in A2 would enhance permeance of composite membrane. In the reported literature, several methods were applied to reduce l2 in order to enhance gas permeance. The study of Chen et al.18 indicated that CO2 permeance and CO2–N2 selectivity of the resultant PES-PEG composite membranes increased with a decrease in surface pore size of hollow fibers because of the reduced intrusion. The study of Peter and Peinemann55 prevented the penetration of coating solution into the substrate pores through enhancing the viscosity of Matrimid coating solution. Filling up the pores with a pre-wetting material before coating could also prevent the intrusion of the coating solution.26,56 Apart from these, the increase in surface area of porous region (A2) could also enhance gas permeance of composite membrane.
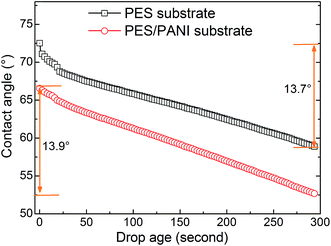
In this work, according to the analysis of surface structure of the substrates in the above sections, the effect of substrates on gas permeability could be explained from the following aspects. First, as schematically described in Fig. 12, compared with PES substrate, the high surface porosity of PES/PANI substrate increased the gas transport passage. That is to say, the surface area of porous region (A2) of PES/PANI substrate was obvious larger than that of PES substrate, which could result in the decrease of the total transfer resistance of composite membrane. Therefore, PVAm/PES/PANI membrane presented higher gas permeance than PVAm/PES membrane. Second, the N–H group of PANI on the surface of PES/PANI substrate may have H–H bond with the N–H2 group of PVAm. This interaction could enhance the interface adhesion and increase the interface compatibility between the selective layer and the substrate, which may decrease the possibility of interface voids occurring at high feed pressure and are in favour of achieving high gas selectivity. As seen from Fig. 11(b), the N2 permeance of PVAm/PES membrane increased a lot when the feed pressure increased to 2.0 MPa, while the N2 permeance of PVAm/PES/PANI membrane changed little. Third, the relative hydrophilic surface and large surface pore size of PES/PANI substrate may favor to the surface spread and pore intrusion of PVAm coating solution. It was reported that the polymer chains within the pores displayed lower mobility and were described as “chain rigidification”, which would cause a decrease of gas permeance and an increase of selectivity.25 In order to investigate the difference in the spread and penetration of coating solution on PES and PES/PANI substrates, the dynamic contact angle of coating solution on the substrats was recorded using 2.0 wt% PVAm coating solution as the dispense liquid. As shown in Fig. 13, the contact angle of PES/PANI substrate is about 4–6° lower than that of PES substrate, indicating that the coating solution could well spread over the surface of PES/PANI substrate. With increasing the drop ages, the contact angles decrease gradually mainly due to the penetration of coating solution as well as the evaporation of water. The decrease of contact angles on PES and PES/PANI substrates during 300 s of drop ages were both about 13.5°, indicating that there was no great difference between the penetration of PVAm coating solution on PES and PES/PANI substrates. Thus, even though PES/PANI substrate had slight larger surface pore size than PES substrate, the penetration of coating solution on the PES/PANI substrate did not appear obvious. This may be due to the high molecular weight of PVAm (about 3.7 × 10⁵ g mol−1) and the high viscosity of 2.0 wt% of PVAm aqueous solution (about 70.2 mPa s−1), which was measured using a rotating viscometer (Brookfield DV-III Ultra) at the room temperature with a rotating rate of 50 rpm. Thus, during the coating, PVAm could not easily penetrate deeply into the surface pore of PES and PES/PANI substrates, which had the surface pore sizes in the range of 6–12 nm. The intrusion depth (l2) of PVAm/PES/PANI membrane may be similar with that of PVAm/PES membrane. Considering the above three factors, the structure of PES/PANI substrate contributed to improve the permselectivity of the as-prepared composite GS membrane.
4. Conclusions
In this work, PES/PANI nanocomposite membranes were fabricated by immersion precipitation process using well-dispersed PANI nanorods. The nanocomposite membrane showed excellent permeability and antifouling property during UF process, but also exhibited as superior substrate in fabricating PVAm/PES/PANI composite GS membrane. Main conclusions were listed as follows.(1) PANI nanorods with fine dispersion and narrow particle size distribution were synthesized using the dispersion polymerization method. With the incorporation of PANI nanorods, the surface hydrophilicity, surface pore size and porosity of PES UF membrane were improved. The pure water fluxes of PES/PANI nanocomposite membranes were greatly enhanced with a moderate decrease of EA rejection. Moreover, PES/PANI nanocomposite membranes showed better antifouling property than PES membrane, including higher fluxes and FRR values after simple cleaning.
(2) Non-woven fabrics supported PES/PANI substrate was used to fabricate PVAm/PES/PANI composite GS membrane. The increase in the surface area of porous region of PES/PANI substrate and the improvement of interface adhesion between the selective layer and the substrate are favourable to the enhancement of CO2 permeance as well as CO2–N2 selectivity of as-prepared composite membrane. Thus, PES/PANI substrate could be used as the excellent substrate to prepare composite GS membrane with enhanced gas permselectivity.
Acknowledgements
This research was supported by National Natural Science Foundation of China (no. 21306130), Major State Basic Research Development Program of China (973 Program, no. 2009CB623405), Science & Technology Pillar Program of Tianjin (no. 10ZCKFSH01700) and Program of Introducing Talents of Discipline to Universities (no. B06006). The authors gratefully acknowledge assistance in characterization by Analysis Centre of Tianjin University.References
- F. Liu, N. A. Hashim, Y. Liu, M. R. M. Abed and K. Li, J. Membr. Sci., 2011, 375, 1–27 CrossRef CAS PubMed.
- M. M. Pendergast and E. M. V. Hoek, World Health, 2011, 1946–1971 CAS.
- N. Maximous, G. Nakhla, W. Wan and K. Wong, J. Membr. Sci., 2009, 341, 67–75 CrossRef CAS PubMed.
- Z. L. Xu and F. A. Qusay, J. Membr. Sci., 2004, 233, 101–111 CrossRef CAS PubMed.
- C. Cheng, S. Li, W. Zhao, Q. Wei, S. Nie, S. Sun and C. Zhao, J. Membr. Sci., 2012, 417–418, 228–236 CrossRef CAS PubMed.
- Y.-H. La, B. D. McCloskey, R. Sooriyakumaran, A. Vora, B. Freeman, M. Nassar, J. Hedrick, A. Nelson and R. Allen, J. Membr. Sci., 2011, 372, 285–291 CrossRef CAS PubMed.
- H. Susanto and M. Ulbricht, Langmuir, 2007, 23, 7818–7830 CrossRef CAS PubMed.
- P. S. Yune, J. E. Kilduff and G. Belfort, J. Membr. Sci., 2011, 377, 159–166 CrossRef CAS PubMed.
- W. Zhao, J. Huang, B. Fang, S. Nie, N. Yi, B. Su, H. Li and C. Zhao, J. Membr. Sci., 2011, 369, 258–266 CrossRef CAS PubMed.
- A. Rahimpour and S. S. Madaeni, J. Membr. Sci., 2010, 360, 371–379 CrossRef CAS PubMed.
- H. Susanto and M. Ulbricht, J. Membr. Sci., 2009, 327, 125–135 CrossRef CAS PubMed.
- J.-N. Shen, H.-M. Ruan, L.-G. Wu and C.-J. Gao, Chem. Eng. J., 2011, 168, 1272–1278 CrossRef CAS PubMed.
- J. Huang, K. Zhang, K. Wang, Z. Xie, B. Ladewig and H. Wang, J. Membr. Sci., 2012, 423–424, 362–370 CrossRef CAS PubMed.
- J. María Arsuaga, A. Sotto, G. del Rosario, A. Martínez, S. Molina, S. B. Teli and J. de Abajo, J. Membr. Sci., 2013, 428, 131–141 CrossRef PubMed.
- V. Vatanpour, S. S. Madaeni, A. R. Khataee, E. Salehi, S. Zinadini and H. A. Monfared, Desalination, 2012, 292, 19–29 CrossRef CAS PubMed.
- A. Razmjou, A. Resosudarmo, R. L. Holmes, H. Li, J. Mansouri and V. Chen, Desalination, 2012, 287, 271–280 CrossRef CAS PubMed.
- G. Zhang, S. Lu, L. Zhang, Q. Meng, C. Shen and J. Zhang, J. Membr. Sci., 2013, 436, 163–173 CrossRef CAS PubMed.
- A. Razmjou, J. Mansouri and V. Chen, J. Membr. Sci., 2011, 378, 73–84 CrossRef CAS PubMed.
- Y. Wang, R. Ou, Q. Ge, H. Wang and T. Xu, Desalination, 2013, 330, 70–78 CrossRef CAS PubMed.
- Y. Sun, L. Xue, Y. Zhang, X. Zhao, Y. Huang and X. Du, Desalination, 2014, 336, 72–79 CrossRef CAS PubMed.
- P. Veerababu, B. B. Vyas, P. S. Singh and P. Ray, Desalination, 2014, 346, 19–29 CrossRef CAS PubMed.
- M. F. Jimenez-Solomon, P. Gorgojo, M. Munoz-Ibanez and A. G. Livingston, J. Membr. Sci., 2013, 448, 102–113 CrossRef CAS PubMed.
- M. Fathizadeh, A. Aroujalian and A. Raisi, Desalination, 2012, 284, 32–41 CrossRef CAS PubMed.
- A. K. Ghosh and E. M. V. Hoek, J. Membr. Sci., 2009, 336, 140–148 CrossRef CAS PubMed.
- Y. Li, S. Wang, H. Wu, R. Guo, Y. Liu, Z. Jiang, Z. Tian, P. Zhang, X. Cao and B. Wang, ACS Appl. Mater. Interfaces, 2014, 6, 6654–6663 CAS.
- P. Li, H. Z. Chen and T.-S. Chung, J. Membr. Sci., 2013, 434, 18–25 CrossRef CAS PubMed.
- S. Bhadra, D. Khastgir, N. K. Singha and J. H. Lee, Prog. Polym. Sci., 2009, 34, 783–810 CrossRef CAS PubMed.
- G. R. Guillen, T. P. Farrell, R. B. Kaner and E. M. V. Hoek, J. Mater. Chem., 2010, 20, 4621–4628 RSC.
- Y. Gupta, K. Hellgardt and R. J. Wakeman, J. Membr. Sci., 2006, 282, 60–70 CrossRef CAS PubMed.
- S. Zhao, Z. Wang, J. Wang, S. Yang and S. Wang, J. Membr. Sci., 2011, 376, 83–95 CrossRef CAS PubMed.
- Z. Fan, Z. Wang, N. Sun, J. Wang and S. Wang, J. Membr. Sci., 2008, 320, 363–371 CrossRef CAS PubMed.
- S. Zhao, Z. Wang, J. Wang and S. Wang, Ind. Eng. Chem. Res., 2014, 53, 11468–11477 CrossRef CAS.
- J. Zhao, Z. Wang, J. Wang and S. Wang, J. Membr. Sci., 2012, 403, 203–215 CrossRef PubMed.
- S. Zhao, Z. Wang, Z. Qiao, X. Wei, C. Zhang, J. Wang and S. Wang, J. Mater. Chem. A, 2013, 1, 246–249 CAS.
- Z. Ma, Z. Qiao, Z. Wang, X. Cao, Y. He, J. Wang and S. Wang, RSC Adv., 2014, 4, 21313–21317 RSC.
- S. Yuan, Z. Wang, Z. Qiao, M. Wang, J. Wang and S. Wang, J. Membr. Sci., 2011, 378, 425–437 CrossRef CAS PubMed.
- P. Ghosh, S. K. Siddhanta and A. Chakrabarti, Eur. Polym. J., 1999, 35, 699–710 CrossRef CAS.
- E. Subramanian, G. Anitha and N. Vijayakumar, J. Appl. Polym. Sci., 2007, 106, 673–683 CrossRef CAS.
- M. A. Aroon, A. F. Ismail, M. M. Montazer-Rahmati and T. Matsuura, Sep. Purif. Technol., 2010, 72, 194–202 CrossRef CAS PubMed.
- N. Peng, N. Widjojo, P. Sukitpaneenit, M. M. Teoh, G. G. Lipscomb, T.-S. Chung and J.-Y. Lai, Prog. Polym. Sci., 2012, 37, 1401–1424 CrossRef CAS PubMed.
- T. Ito, L. Sun, M. A. Bevan and R. M. Crooks, Langmuir, 2004, 20, 6940–6945 CrossRef CAS PubMed.
- H. L. Karlsson, J. Gustafsson, P. Cronholm and L. Möller, Toxicol. Lett., 2009, 188, 112–118 CrossRef CAS PubMed.
- S. Zhao, Z. Wang, X. Wei, B. Zhao, J. Wang, S. Yang and S. Wang, Ind. Eng. Chem. Res., 2012, 51, 4661–4672 CrossRef CAS.
- Y.-n. Yang, W. Jun, Z. Qing-zhu, C. Xue-si and Z. Hui-xuan, J. Membr. Sci., 2008, 311, 200–207 CrossRef CAS PubMed.
- C. A. Smolders, A. J. Reuvers, R. M. Boom and I. M. Wienk, J. Membr. Sci., 1992, 73, 259–275 CrossRef CAS.
- C. W. Li and Y. S. Chen, Desalination, 2004, 170, 59–67 CrossRef CAS PubMed.
- I. N. H. M. Amin, A. W. Mohammad, M. Markom, L. C. Peng and N. Hilal, J. Membr. Sci., 2010, 351, 75–86 CrossRef CAS PubMed.
- G. R. Guillen, Y. Pan, M. Li and E. M. V. Hoek, Ind. Eng. Chem. Res., 2011, 50, 3798–3817 CrossRef CAS.
- J.-H. Kim and K.-H. Lee, J. Membr. Sci., 1998, 138, 153–163 CrossRef CAS.
- A. Rahimpour and S. S. Madaeni, Journal of Membrane Science, 2007, 305, 299–312 CrossRef CAS PubMed.
- T.-J. Kim, H. Vrålstad, M. Sandru and M.-B. Hägg, J. Membr. Sci., 2013, 428, 218–224 CrossRef CAS PubMed.
- T. Yamaguchi, L. M. Boetje, C. A. Koval, R. D. Noble and C. N. Bowman, Ind. Eng. Chem. Res., 1995, 34, 4071–4077 CrossRef CAS.
- S. Yuan, Z. Wang, Z. Qiao, M. Wang, J. Wang and S. Wang, J. Membr. Sci., 2011, 378, 425–437 CrossRef CAS PubMed.
- J. M. S. Henis and M. K. Tripodi, J. Membr. Sci., 1981, 8, 233–246 CrossRef CAS.
- J. Peter and K. V. Peinemann, J. Membr. Sci., 2009, 340, 62–72 CrossRef CAS PubMed.
- T.-S. Chung, E. R. Kafchinski, R. S. Kohn, P. Foley and R. S. Straff, J. Appl. Polym. Sci., 1994, 53, 701–708 CrossRef CAS.
| This journal is © The Royal Society of Chemistry 2015 |

