Lipid monolayer disruption caused by aggregated carbon nanoparticles†
Nililla Nisoha,
Mikko Karttunenb,
Luca Monticellicd and
Jirasak Wong-ekkabut*a
aDepartment of Physics, Faculty of Science, Kasetsart University, 50 Phahon Yothin Rd, Chatuchak, Bangkok, 10900, Thailand. E-mail: jirasak.w@ku.ac.th
bDepartment of Chemistry and Waterloo Institute for Nanotechnology, University of Waterloo, 200 University Avenue West, Waterloo, Ontario N2L 3G1, Canada
cIBCP, CNRS UMR 5086, Lyon, 69007, France
dUniversité, Claude Bernard Lyon I, Lyon, 69007, France
First published on 8th January 2015
Abstract
Carbon nanoparticles (CNP) have significant impact on the Pulmonary Surfactant (PS), the first biological barrier in the respiratory system. CNPs – abundant in the environment due to combustion – can translocate into our bodies by crossing the alveolar epithelium barrier, and they can be retained in the lungs due to slow clearance. The physical mechanisms of how CNPs perturb PS remain unclear yet such knowledge is crucial for developing effective strategies against the adverse effects of CNPs. Molecular dynamics (MD) simulations of model PS monolayers in the presence of C60 fullerenes were performed at time scales of tens of microseconds and varying C60 content. In contrast to bilayers, fullerenes affected both structural and dynamic properties of the PS monolayer. Surface tension/area isotherms of the monolayer were changed by fullerenes and perturbations of the physical structure of the PS monolayer became major at high fullerene concentrations due to fullerene aggregation. At high compression (area per molecule of 0.48 nm2), the monolayer became unstable and collapsed forming a bilayer in the water phase. At low compression, pore formation occurred. Free energy calculations suggest that increasing fullerene concentration leads to decreased preference for the fullerenes to reside inside the monolayer. However, the free energy barrier for transferring fullerene out of the monolayer is rather large at all fullerene concentrations; spontaneous translocation of fullerene out of the monolayer is thermodynamically unfavorable. The results illustrate some of the potentially harmful effects of CNPs on the respiratory system and also the physical mechanism of how CNPs disturb pulmonary surfactant. This may be related to the difficulty of CNP clearance from lung surfactant. The total simulation time was 370 microseconds.
Introduction
Carbon nanoparticles (CNPs) have myriad applications in diverse fields from pharmaceuticals to mechanical and electronics industries;1–4 the industrial demand for CNPs is expected to reach %1 trillion market value by 2015.5 CNPs are also produced by combustion engines and heating plants, and are increasingly abundant in the environment.6,7 Consequently, the general public is constantly exposed to CNPs, which raises questions about possible health risks, particularly their direct absorption through breathing – a risk that is serious in urban environments.8,9 CNPs are typically internalized through inhalation and may remain in lungs for long times similar to other nanoparticles.8,10 The retained CNPs likely interact with the pulmonary surfactant layer11,12 and may lead to effects similar to lung pathologies such as pulmonary fibrosis and lung cancer.13,14Several in vivo and in vitro studies have investigated the effects of nanoparticles on pulmonary monolayers.15–20 The results are, due to the complexity of the system, however, often conflicting and unclear. For example, minor toxicity of CNPs towards lung tissue has been reported21 consistent with minor effects of C60 on the surface tension/area isotherms of lipid monolayers.22 Despite the small influence on the above properties,23 C60 may cause a lack of effective surfactant resulting in respiratory distress syndrome (RDS).24–26 Moreover, in vivo studies have shown CNPs can induce airway fibrosis and granulomas in the mice lung.18,27–30 In these cases, toxicity was attributed to CNP aggregation31 which was not easily removed from the lungs.27
Analyzing molecular interactions at the microscopic level through computer simulations provides an alternative approach to characterize nanoparticles' interactions with PS. All-atom molecular dynamics32 and coarse-gained molecular dynamics (CG-MD)23 simulations have been used to study the effects of CNPs on lipid monolayers. Simulations show that CNPs can easily penetrate lipid monolayers, while further translocation of CNPs into the water phase was unfavorable.32 CG-MD simulations have further suggested a possible pathway for CNP entry into the body through lung inhalation.23 Despite these advances, the precise physical mechanisms of how CNPs perturb monolayers remain unclear.
We performed microsecond CG-MD simulations to investigate the effects of C60 fullerene nanoparticles on model pulmonary surfactant (PS) monolayers. Dipalmitoylphosphatidylcholine (DPPC) lipid monolayer was used as a model PS system because DPPC is the major component of lung surfactant.33 The surface tension/area isotherms at different fullerene concentrations and their structural and dynamical properties were analyzed. We also calculated fullerene cluster sizes, diffusion coefficients and lipid ordering. To understand the partitioning of fullerenes in the monolayer, free energy calculations were performed. Our simulations show that aggregated fullerenes are capable of inducing structural disruption and pore formation. Simulations also clarify the mechanism of monolayer perturbation by fullerenes.
Methodology
System setup
The simulated systems consisted of a slab of water bounded by two monolayers of DPPC lipids at the interface between the water and vapor phases (Fig. S1†). The same monolayer preparation protocol as described by Baoukina et al.34 was used. Fullerenes were randomly placed onto the monolayers with [C60]/[DPPC] ratios of 0, 0.1, 0.2 and 0.3. The details of all the systems are provided in Table 1. Simulations were performed under constant particle number, volume and temperature (NVT). The area per DPPC molecule was varied in the range 0.48–0.68 nm2. In this range, pure DPPC lipid monolayers can be found in three phase regions of the isotherm: (1) coexistence of liquid condensed (LC) and liquid expanded (LE) phases (Fig. S2†), (2) pure LE phase, and (3) LE phase coexisting with a gas phase.34| Fullerene concentration | Molecules | Surface area (nm2) | |||||||
|---|---|---|---|---|---|---|---|---|---|
| DPPC | Fullerene | Water | 0.48 | 0.52 | 0.56 | 0.60 | 0.64 | 0.68 | |
| No fullerene | 800 | — | 26![[thin space (1/6-em)]](https://www.rsc.org/images/entities/char_2009.gif) 416 416 |
✓ | ✓ | ✓ | ✓ | ✓ | ✓ |
| 3200 | — | 105![[thin space (1/6-em)]](https://www.rsc.org/images/entities/char_2009.gif) 664 664 |
✓ | ✓ | ✓ | ✓ | ✓ | ✓ | |
| 10% | 728 | 72 | 26![[thin space (1/6-em)]](https://www.rsc.org/images/entities/char_2009.gif) 416 416 |
✓ | ✓ | ✓ | ✓ | ✓ | ✓ |
| 2912 | 288 | 105![[thin space (1/6-em)]](https://www.rsc.org/images/entities/char_2009.gif) 664 664 |
✓ | ✓ | ✓ | ✓ | ✓ | ✓ | |
| 20% | 664 | 136 | 26![[thin space (1/6-em)]](https://www.rsc.org/images/entities/char_2009.gif) 416 416 |
✓* | ✓* | ✓ | ✓ | ✓ | ✓ |
| 2656 | 544 | 105![[thin space (1/6-em)]](https://www.rsc.org/images/entities/char_2009.gif) 664 664 |
✓* | ✓ | ✓ | ✓ | ✓ | ✓ | |
| 30% | 616 | 184 | 26![[thin space (1/6-em)]](https://www.rsc.org/images/entities/char_2009.gif) 416 416 |
✓* | ✓* | ✓ | ✓ | ✓ | ✓ |
| 2464 | 736 | 105![[thin space (1/6-em)]](https://www.rsc.org/images/entities/char_2009.gif) 664 664 |
✓* | ✓ | ✓ | ✓ | ✓ | ✓ | |
Simulation details
The MARTINI coarse grained (CG) force field version 2.1 (ref. 35) was used with the latest updated version for fullerenes.36 The newer fullerene model36 is optimized by matching experimental free energies of transfer. This version can reproduce the atomistic Potential of Mean Force (PMF) profile of transferring fullerene through a lipid membrane. The molecular models and systems are shown in Fig. S1.† Simulations were performed with the Gromacs software package version 4.5.4.37 The NVT ensemble (constant particle number, volume and temperature) was used in most simulations, with additional control simulations using the NpT ensemble (constant particle number, pressure and temperature). Temperature was kept constant at 298 K using the Berendsen weak coupling algorithm38 with a time constant of 1 ps. For NpT simulations, the Berendsen barostat38 was semi-isotropically applied for constant pressure at 1, 20, 22, and 30 bars with a 1 ps time constant and with compressibilities in lateral and z-components set to 5 × 10⁻⁶ and 0 bar−1, respectively. Following standard protocol,35,39 a cutoff of 1.2 nm was used for non-bonded interactions: the Lennard-Jones interactions were shifted to zero between 0.9 and 1.2 nm, and the Coulomb potential was shifted to zero between 0 and 1.2 nm; while electrostatic interactions in atomistic systems must be computed using Ewald summation or multipole based methods,40–42 the MARTINI model is parameterized for shifting and cutoff.35 The relative dielectric constant was 15 (default required by parameterization for this force field35) and the time step was set to 20 fs. First, energy minimization using the steepest decent algorithm to remove cavities and close contacts was performed. Then, for each of the systems, an equilibration MD run was performed over 500 ns. The production runs were simulated for at least 5 μs. Snapshots showing the last frames of all the systems with 400 molecules per monolayer are shown in Fig. S2 and S3.†Potential of mean force (PMF)
The PMF of a single fullerene transferring across the lipid monolayer was calculated using the umbrella sampling technique43 with the Weighted Histogram Analysis Method44 (WHAM). The pure DPPC monolayer contained 200 DPPC molecules and 6604 waters. The simulation box was 7.48 × 7.48 × 50.00 nm3, corresponding to the area per molecule of 0.56 nm2. The initial configuration of each sampling window was extracted from an equilibrium trajectory where the fullerene was placed in the vacuum phase. Monolayers were oriented with their normal in the direction of the z-axis. The distance in z-direction between the center of mass (COM) of the fullerene and the monolayer as defined by the phosphate groups of the lipid molecules was restrained with a harmonic potential (force constant: 1000 kJ mol−1 nm−2) between −4.5 nm and 2.0 nm, with 0.1 nm increments (0.0 nm corresponds to the COM of the phosphate group). Those distances correspond to the fullerene being placed in the vapor and water phases, respectively. Simulations were performed in the NVT ensemble at 298 K for the total time of 66 μs (1 μs per each window). The statistical uncertainty in umbrella sampling simulations was estimated using the bootstrap analysis method.45 To investigate the effect of fullerene concentration, we determined the free energy profiles of a single fullerene transferring across the lipid–fullerene monolayer in the presence of other fullerenes with [C60]/[DPPC] ratios of 0, 0.1, 0.2 and 0.3.Results and discussion
Effects of fullerene on the structure of lipid monolayer
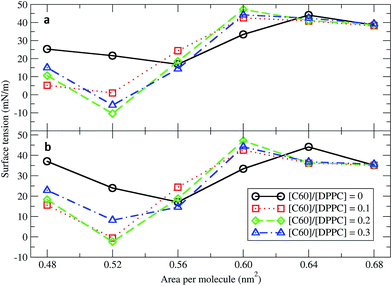
Surface tension is an essential determinant of monolayer structure.46–48 To investigate the effect of fullerenes upon it, systems with 400 DPPC molecules per monolayer with varying [C60]/[DPPC] and constant areas per molecule (A) of 0.48, 0.52, 0.56, 0.60, 0.64, and 0.68 nm2 (Table 1) were studied. The surface tension for planar monolayers was calculated from the average diagonal components of the pressure tensor:| γm = 〈(PN − PL)Lz〉/2 | (1) |
Next, fullerenes were added. In their absence, the surface tension maximum and minimum were found at 0.64 and 0.56 nm2. With fullerenes present, the maximum and minimum were shifted to smaller areas per lipid, 0.60 and 0.52 nm2, respectively. After the addition of fullerenes, LC phase could be rarely observed especially at high concentration of fullerenes. Because fullerenes mostly occupied the hydrophobic chain region,49–51 the orientation and ordering of the lipid head groups did not change significantly with increasing concentrations of fullerene. Perturbation of the monolayers could be observed in hydrocarbon chain region (Fig. S5a†), especially at the level of the last hydrocarbon bead: the order parameter decreased significantly with increasing fullerene concentration (Fig. S5b†). This result is in agreement with previous studies showing that hydrophobic nanoparticles inhibit the monolayer ordering transition under compression.50,52 With fullerenes present, the lipids tails are no longer stretching along the membrane normal but they wrap around the fullerene surface, due to strong dispersion interactions; wrapping of fullerene by the lipids causes a decrease in the ordering of the lipid chains and in the thickness of the monolayer (Fig. S6†). We notice that changes in lipid chain ordering, area per lipid, and monolayer thickness were small in comparison with the fullerene–lipid bilayer systems.49,53
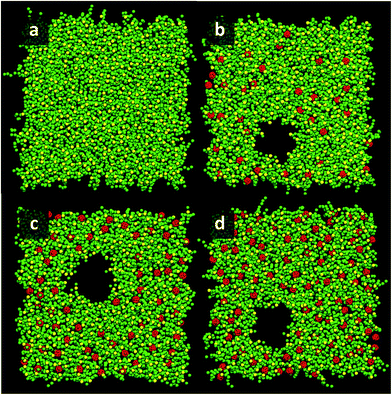
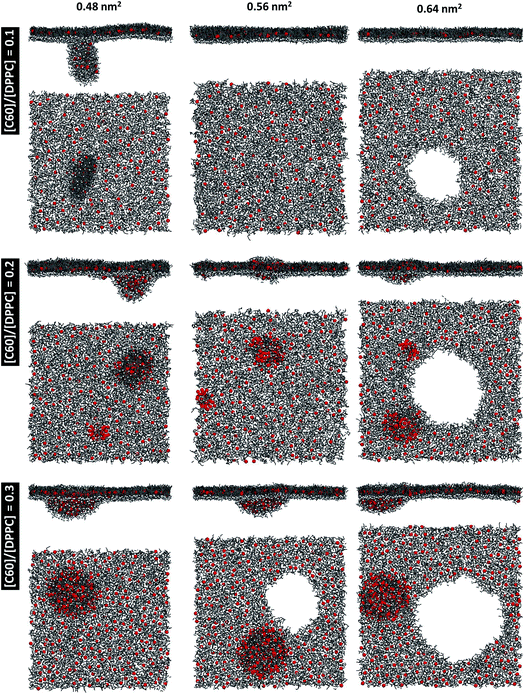
At areas per molecule larger than 0.52 nm2, the monolayers were flat and the fullerenes were homogeneously distributed over the xy-plane in the lipid chain region. At the area of 0.60 nm2, the surface tension of monolayers with fullerene increased significantly compared to the ones without fullerene. This is in agreement with previous experimental studies.19,54 When the area per molecule was increased to 0.64 and 0.68 nm2, pore formation was observed (Fig. 2), indicating the coexistence between the LE phase and a 2D gas phase. As noticed by Baoukina et al.,34 the MARTINI model underestimates the area at which the 2D gas phase is formed. This is due to a severe underestimation of water–vapor surface tension34 and can be easily seen when compared to atomistic simulations of pure DPPC monolayers.55 Qualitative behavior, however, is not influenced. Our results suggest that, at high enough areas, the presence of nanoparticles favors the formation of pores.
At area per molecule of 0.52 nm2, surface tension decreased significantly and became negative in the presence of high concentration of fullerene ([C60]/[DPPC] ratios of 0.2 and 0.3). Note that monolayers with negative surface tension are generally unstable and collapse via buckling.56 In our simulations, the amplitude of bending increased with increasing fullerene concentrations (Fig. S3†). However, the monolayers did not collapse within the simulation time. Only when the area per lipid reached 0.48 nm2, monolayers collapsed. In this case, the monolayer folded into a bilayer for [C60]/[DPPC] ratio of 0.2 and a hemi-spherical budding for [C60]/[DPPC] ratio of 0.3 (Fig. 3). Once the monolayer was completely folded, surface tension increased and positive values were restored (Fig. 1). This behavior is fully consistent with recent observations on monolayers consisting of ternary lipid mixtures; in that case, monolayer collapse was observed at higher values of surface tension in the presence of fullerene.52
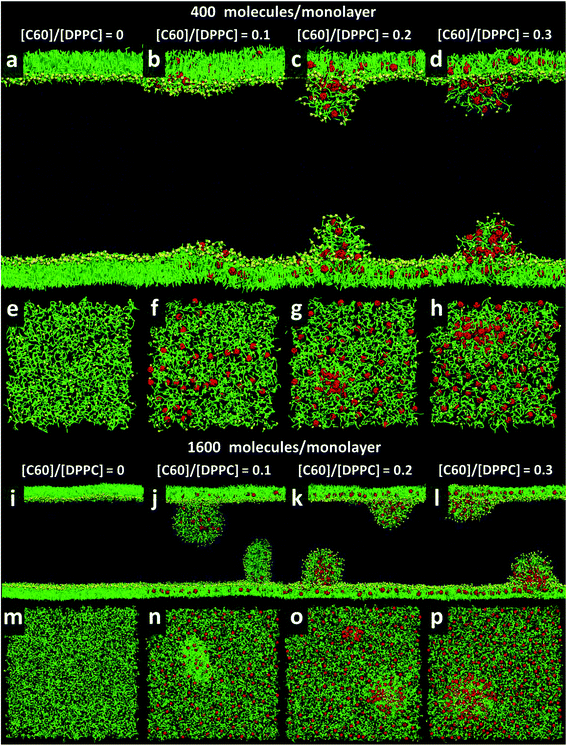 | ||
| Fig. 3 Snapshots illustrating systems with the area per molecule of 0.48 nm2 with [C60]/[DPPC] ratios of 0 (a, e, i, and m), 0.1 (b, f, j, and n), 0.2 (c, g, k, and o), and 0.3 (d, h, l, and p) The systems consist of 400 (a–h) and 1600 (i–p) molecules per monolayer. Colors as in Fig. 2. | ||
To investigate the monolayer structure under the NpT ensemble, the monolayer at 0.64 nm2 for all fullerene concentrations was used as the initial structure and performed at 1 bar. The area per molecule of the monolayer was decreased and equilibrated at 0.467 ± 0.001, 0.517 ± 0.004, 0.537 ± 0.001, and 0.527 ± 0.001 nm2 for [C60]/[DPPC] ratios of 0, 0.1, 0.2, and 0.3, respectively. The structure of monolayer was similar to the simulations under NVT ensemble at equivalent areas per molecule for all [C60]/[DPPC] ratios in which monolayer structure deformation and pore formation could not be observed. On the other hand, the monolayers at 0.48 nm2 were expanded with lateral pressures of 20, 22, and 30 bars. The results show that pore formation occurs only for [C60]/[DPPC] = 0.3 at 20 bars and [C60]/[DPPC] = 0.2 and 0.3 at 22 bars (Fig. S7†). At 30 bars, pores occurred for all [C60]/[DPPC] ratios. When pores formed under the NpT ensemble, they were unstable and continuously expanded leading to monolayer rupture. This shows that pore formation is not simulation artifact. Furthermore, it was also observed in pure DPPC monolayers.57,58
To study the effect of system size on monolayer collapse, we simulated large systems consisting of 1600 lipids per monolayer at area per molecule of 0.48 nm2. We found that the monolayers collapsed for the fullerene–lipid mixtures but not for the pure DPPC monolayer (Fig. 3). In the case of [C60]/[DPPC] = 0.1, the shape of the bilayer fold was semi-elliptical (disk-like) and oriented approximately perpendicular to the monolayer. At [C60]/[DPPC] ratios of 0.2 and 0.3, the monolayer fold shape became a hemisphere with clustered fullerenes inside, similar to the small systems. At high fullerene concentrations ([C60]/[DPPC] ratios = 0.3), lipid flip-flop was observed, in which lipid molecules transferred from lipid–water into lipid–vacuum interface at the base of hemi-spherical budding. The time evolution of budding in monolayer can be seen in Fig. S8.†
Fullerene aggregation in the monolayer
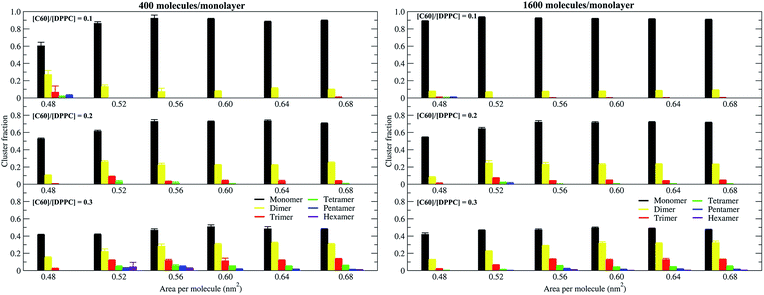
To study the aggregation of fullerenes in PS monolayers, we calculated aggregation as a function of simulation time using previously validated software (g_aggregate, see ref. 51). Two fullerene molecules were considered to be aggregated when the distance between their centers of mass was less than 1.30 nm. The value of 1.30 nm corresponds to the first maximum of the PMF for fullerene dimerization. Fig. 4 shows the time evolution of the largest cluster of fullerenes in the systems of 400 molecules per monolayer. At high compression (area per molecule of 0.48 nm2), fullerenes aggregated rapidly, and the cluster size reached a steady state in about 5 μs. At the area per molecule of 0.60 nm2, the cluster size was rather stable with few monomeric fullerene molecules even at high concentration ([C60]/[DPPC] = 0.3). Fullerene cluster size increased with increasing fullerene concentration, and it rapidly decreased with increasing area per molecule (Fig. 5). A comparison between the system shows that the number of molecules in the largest cluster size for the large system (1600 molecule per monolayer) is significantly higher than the small system (400 molecule per monolayer) especially when monolayer folded. Fig. 6 shows that the monomeric fullerene is the most population in monolayer. At areas per molecule ≥0.56 nm2, the fractions of monomeric fullerene for both system sizes were 0.91, 0.72, and 0.48 at C60![[thin space (1/6-em)]](https://www.rsc.org/images/entities/char_2009.gif) :
:![[thin space (1/6-em)]](https://www.rsc.org/images/entities/char_2009.gif) DPPC molar ratios of 0.1, 0.2, and 0.3, respectively; these values are similar to the ones found in lipid bilayers.51 At the area per molecule of 0.48 nm2 the fraction of monomeric fullerene significantly decreased, reaching 0.60, 0.56 and 0.43 at C60
DPPC molar ratios of 0.1, 0.2, and 0.3, respectively; these values are similar to the ones found in lipid bilayers.51 At the area per molecule of 0.48 nm2 the fraction of monomeric fullerene significantly decreased, reaching 0.60, 0.56 and 0.43 at C60![[thin space (1/6-em)]](https://www.rsc.org/images/entities/char_2009.gif) :
:![[thin space (1/6-em)]](https://www.rsc.org/images/entities/char_2009.gif) DPPC molar ratios of 0.1, 0.2 and 0.3, respectively for the small systems, and 0.87, 0.55 and 0.44 at C60
DPPC molar ratios of 0.1, 0.2 and 0.3, respectively for the small systems, and 0.87, 0.55 and 0.44 at C60![[thin space (1/6-em)]](https://www.rsc.org/images/entities/char_2009.gif) :
:![[thin space (1/6-em)]](https://www.rsc.org/images/entities/char_2009.gif) DPPC molar ratios of 0.1, 0.2 and 0.3, respectively for the large systems. The population of aggregated fullerene increases with fullerene concentration and with increasing compression of the monolayer compression, as expected. We conclude that, at relatively large values of the area per molecule, the aggregation behavior of fullerene in lipid monolayers is similar to lipid bilayers, where fullerene aggregation is limited.49,51 In contrast, at high monolayer compression, fullerene aggregation is more pronounced. Fullerene aggregation causes a decrease of the effective area per molecule, resulting in lower surface tension, as also observed by Chiu et al.23 Fullerene clusters have a larger size than the monolayer thickness, resulting in bending and folding of the monolayer into a bilayer, which then folds into a hemi-spherical budding to prevent exposure of fullerene clusters to the vapor phase.
DPPC molar ratios of 0.1, 0.2 and 0.3, respectively for the large systems. The population of aggregated fullerene increases with fullerene concentration and with increasing compression of the monolayer compression, as expected. We conclude that, at relatively large values of the area per molecule, the aggregation behavior of fullerene in lipid monolayers is similar to lipid bilayers, where fullerene aggregation is limited.49,51 In contrast, at high monolayer compression, fullerene aggregation is more pronounced. Fullerene aggregation causes a decrease of the effective area per molecule, resulting in lower surface tension, as also observed by Chiu et al.23 Fullerene clusters have a larger size than the monolayer thickness, resulting in bending and folding of the monolayer into a bilayer, which then folds into a hemi-spherical budding to prevent exposure of fullerene clusters to the vapor phase.
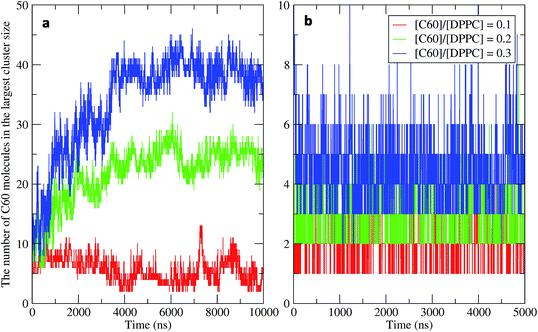 | ||
| Fig. 4 Time evolution of the largest cluster size in the systems of 400 molecules per monolayer for different [C60]/[DPPC] ratios at the area per molecule of (a) 0.48 nm2 and (b) 0.60 nm2. | ||
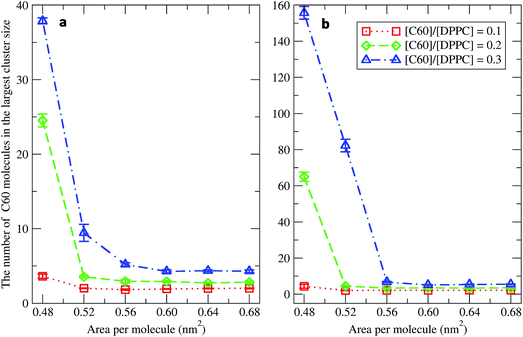 | ||
| Fig. 5 The average largest cluster size as a function of the area per molecule in the systems of (a) 400 and (b) 1600 molecules per monolayer at different [C60]/[DPPC] ratios. | ||
Diffusion coefficients of fullerene and lipids
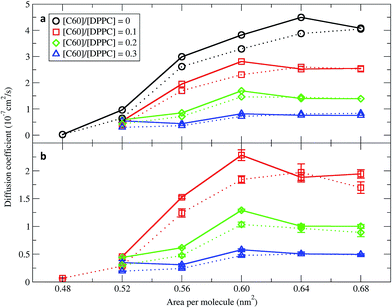
In order to quantify the effect of fullerene concentration on the dynamical properties of the monolayer, we calculated the lateral diffusion coefficients of the lipid and fullerene molecules. Lateral diffusion coefficients for the lipid molecules were calculated from the mean squared displacement (MSD) after removing the motion of center of mass of the monolayer. Diffusion coefficients were calculated using Einstein's relation 〈 r2 〉 ∼4Dt, where D is the diffusion coefficient and t is time. Fig. 7 shows them for the DPPC lipids as a function of area per molecule. For the pure monolayer, the diffusion coefficient increases with increasing area per molecule, in agreement with previous results on pure lipid monolayers.34,59 In the presence of fullerene, diffusion coefficients decreased significantly, in agreement with previous bilayer studies.49,60 The diffusion coefficients of fullerene showed qualitatively similar behavior as a function of area per molecule (i.e., they decrease with decreasing area). Fullerenes move more slowly than the lipids (Fig. 7). Diffusion coefficients in the smaller and larger systems are similar, and minor differences can be ascribed to the deviations from the 2D geometry in the larger systems.Monolayer expansion
During the process of breathing, PS expands and compresses. To model the expanded state following compression, i.e., when the lipids in the PS monolayer have the largest area available for them, the lateral box dimensions (Lx and Ly) were increased at equal rates while keeping the z-dimension (Lz) constant. The initial compressed systems containing 1600 molecules per monolayer with an area per molecule of 0.48 nm2 were used as the starting configurations. The systems were expanded at a constant rate of 0.264 nm ns−1 to areas per molecule of 0.56 and 0.64 nm2. After reaching the target areas per lipid, the simulations were run for 1 μs. The folds disappeared at low fullerene concentration: both the lipids and the fullerene molecules translocated back into the interfacial monolayer (Fig. 8). This is analogous to the behavior observed in the absence of fullerene.61 At molar ratios of 0.2 and 0.3, the initial fullerene clusters persisted, although budding become smaller and lipid molecules enclosed it. At A = 0.64 nm2 all monolayers had one large pore, while at A = 0.56 nm2 only the [C60]/[DPPC] = 0.3 had a pore (as shown in Fig. 8). This is different from pure DPPC bilayers which tend to rupture after pore formation starts.62 The results show that monolayer disruption during expansion depends strongly upon the fullerene concentration and is also directly related to the fullerene aggregation. The energy to break a fullerene cluster may be greater than the energy to create a hole in the monolayer, and therefore both a fullerene cluster and pore formation could be observed after expanding the monolayer fold. These results suggest that high fullerene concentrations may induce physical damage on the PS monolayer during monolayer expansion. However, care should be taken when pore formation in monolayer is observed in simulations with the MARTINI model. Coexistence between a gas phase and a liquid phase is observed in experiments20,63,64 and atomistic simulations57,58 at significantly larger area per lipid (∼0.98 nm2 per molecule). The MARTINI model lacks hydrogen bonding interaction and orientation of the dipoles, which results in a severe underestimation of the surface tension at the water–vapor interface.34 Therefore the low surface tension stabilizes the pores and prevents the actual expansion of the monolayer. Moreover, this work had been focused only on a simple CG model with the homogenous monolayer. In order to gain more realistic fashion, one could consider an atomistic modeling and more complex system with the heterogeneous compositions to represent a real pulmonary surfactant system. However, the increase of system complexity was limited by the computational power and is beyond the current manuscript.Potential of mean force (PMF) profiles for fullerene translocation into monolayers
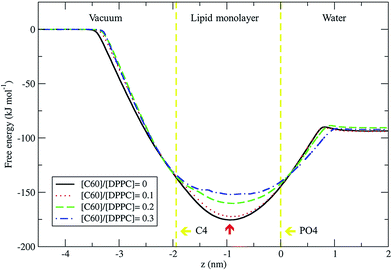
We used the umbrella sampling method43,44 to study the free energy of transferring a fullerene from the vapor phase through the DPPC lipid monolayer into the water phase. We calculated the potential of mean force (PMF) profiles for the translocation of a single fullerene molecule across all four systems with different concentration of C60, with an area per lipid of 0.56 nm2. All PMF profiles show that the systems reach a free energy minimum when fullerene is inside the monolayer, at a distance of about 0.9 nm from the lipid phosphate groups (z = 0.0 nm) (Fig. 9). This result shows that fullerenes can spontaneously diffuse into lipid monolayers and preferably stay in lipid tail region, similarly to lipid bilayers.36,49 The most stable position (the lowest energy) of fullerenes for all concentrations was found at around 0.9 nm away from the phosphate groups, corresponding to the hydrocarbon region in between C1 and C2 beads. The free energies of transfer of a single fullerene from vacuum to the most stable position in the monolayer (ΔGvacuum–monolayer) are −175.4, −172.3, −160.2, and −152.0 kJ mol−1 for monolayers with [C60]/[DPPC] ratios of 0, 0.1, 0.2 and 0.3, respectively. The free energies of transfer from the most stable position in the monolayer to bulk water (ΔGwater–monolayer) are −81.8, −78.3, −69.6, and −59.8 kJ mol−1, for monolayer with [C60]/[DPPC] ratios of 0, 0.1, 0.2 and 0.3 respectively. ΔGvacuum–monolayer and ΔGwater–monolayer suggest that the higher the [C60]/[DPPC] ratio, the lesser the preference for a fullerene to be inside the monolayer. This is probably due to the decrease in the free volume in the monolayer interior at higher [C60]/[DPPC] ratio. In the case of high [C60]/[DPPC] ratio and small area per molecule, the unbiased simulation showed that the monolayer folded to form a bilayer in the water phase in order to accommodate fullerenes in the hydrophobic region. On other hand, the free energy barriers of transferring fullerene out of the monolayer are rather large for all fullerene concentrations, and therefore spontaneous translocation of fullerene to water and vacuum is thermodynamically unfavorable. This result suggests that an active mechanism would be required in order to remove fullerene (and possibly other carbon nanoparticles) from lung surfactant.23,27Conclusions
Proper lung function requires low surface tension at the air–liquid interface to minimize the work needed for breathing, and this is provided by lung surfactant.65–67 Pure DPPC monolayers can provide the necessary low surface tension on compression of the alveolar interface that accompanies exhalation. However, during the expansion that occurs on inhalation, the rapid spreading or adsorption of pure DPPC to cover the new interface is not possible.25,26,68 Therefore, multiple lipid and protein components are necessary to achieve both low tension and fast spreading of the surfactant monolayer. In the present work, we studied the interaction of C60 fullerene with DPPC lipid monolayers. We found that fullerene partitioning into lipid monolayers is highly favorable, indicating that lipid monolayers (as well as bilayers, see ref. 36 and 49) can act as a trap for fullerenes, and potentially other carbon nanoparticles. This result suggests that clearance of carbon nanoparticles might be difficult, which points to one possible mechanism of lung membrane damage.The deposition of fullerenes into lung membranes may affect the surface tension of the interfacial monolayer. To obtain the surface tension/area isotherms, a total of 48 systems over 250 microseconds were simulated. Our results show that, at high compression (small area per molecule), fullerene decreases the surface tension of the monolayer. Fullerenes reduce lipid tail order50,52 causing LE and LC phases in monolayer at the regions with the presence and absence of fullerenes, respectively. Recent results in bilayers69 suggest that fullerene may show preferential partitioning to the LE phase. Therefore, the DPPC monolayer in the presence of fullerene collapses at larger areas per molecule compared to the pure DPPC monolayer, consistent with recent results from simulations of phase separated monolayers consisting of ternary lipid mixtures.52 On the one hand, this result may have important consequences on breathing, as the LC phase plays a fundamental role in monolayer collapse in which the lung surfactant contains different lipid species, and the LC and LE phase coexist at physiological temperature, over a wide surface pressure range.70 At low compression (large area per molecule), fullerene increases the surface tension. As a result, pores formed at the area per molecule of 0.64 nm2. In agreement with the expanding box simulations of the collapsed monolayer, pore formation in monolayers was observed at the area per molecule of 0.64 nm2 for [C60]/[DPPC] = 0.1, 0.2 and 0.3 and at the area per molecule of 0.56 nm2 for [C60]/[DPPC] = 0.3. These findings suggest a physical mechanism for how CNPs may cause the respiratory system to malfunction by changing the surface tension of the lung surfactant which can contribute to respiratory distress syndrome.25,26,71,72
Acknowledgements
Financial support was provided by Kasetsart University Research and Development Institute (KURDI; J.W.), the Faculty of Science (N.N. and J.W.), the Graduate School at Kasetsart University (J.W.), and the Asia Research Center (ARC; J.W.) at Chulalongkorn University. L.M. acknowledges funding by the Institut National de la Santé et de la Recherche Médicale (INSERM) and the Agence nationale de sécurité sanitaire de l'alimentation, de l'environnement et du travail (ANSES; grant NANOVHYP – EST 2011/096). Computational resources were provided by SHARCNET (http://www.sharcnet.ca) and the Department of Physics, Faculty of Science, Kasetsart University.References
- D. Peer, J. M. Karp, S. Hong, O. C. Farokhzad, R. Margalit and R. Langer, Nat. Nanotechnol., 2007, 2, 751–760 CrossRef CAS PubMed.
- P. Innocenzi and G. Brusatin, Chem. Mater., 2001, 13, 3126–3139 CrossRef CAS.
- R. H. Baughman, A. A. Zakhidov and W. A. de Heer, Science, 2002, 297, 787–792 CrossRef CAS PubMed.
- C. Buzea, I. I. Pacheco and K. Robbie, Biointerphases, 2007, 2, 17–71 CrossRef.
- A. Nel, T. Xia, L. Madler and N. Li, Science, 2006, 311, 622–627 CrossRef CAS PubMed.
- S. T. Bagley, K. J. Baumgard, L. D. Gratz, J. H. Johnson and D. G. Leddy, Res. Rep.-Health Eff. Inst., 1996, 1–75 CAS.
- H. S. Jung, A. Miller, K. Park and D. B. Kittelson, J. Air Waste Manage. Assoc., 2013, 63, 1199–1204 CAS.
- G. Oberdorster, J. Ferin and B. E. Lehnert, Environ. Health Perspect., 1994, 102, 173–179 CrossRef PubMed.
- G. Oberdorster, Int. Arch. Occup. Environ. Health, 2001, 74, 1–8 CrossRef CAS PubMed.
- C. Muhlfeld, B. Rothen-Rutishauser, F. Blank, D. Vanhecke, M. Ochs and P. Gehr, Am. J. Physiol.: Lung Cell. Mol. Physiol., 2008, 294, L817–L829 CrossRef CAS PubMed.
- M. Griese, Eur. Respir. J., 1999, 13, 1455–1476 CrossRef CAS PubMed.
- H. M. Mansour, Y. S. Rhee and X. Wu, Int. J. Nanomed., 2009, 4, 299–319 CrossRef CAS.
- K. Donaldson, R. Aitken, L. Tran, V. Stone, R. Duffin, G. Forrest and A. Alexander, Toxicol. Sci., 2006, 92, 5–22 CrossRef CAS PubMed.
- C. A. Poland, R. Duffin, I. Kinloch, A. Maynard, W. A. H. Wallace, A. Seaton, V. Stone, S. Brown, W. MacNee and K. Donaldson, Nat. Nanotechnol., 2008, 3, 423–428 CrossRef CAS PubMed.
- C. M. Sayes, J. D. Fortner, W. Guo, D. Lyon, A. M. Boyd, K. D. Ausman, Y. J. Tao, B. Sitharaman, L. J. Wilson, J. B. Hughes, J. L. West and V. L. Colvin, Nano Lett., 2004, 4, 1881–1887 CrossRef CAS.
- A. Magrez, S. Kasas, V. Salicio, N. Pasquier, J. W. Seo, M. Celio, S. Catsicas, B. Schwaller and L. Forro, Nano Lett., 2006, 6, 1121–1125 CrossRef CAS PubMed.
- S. Kraszewski, M. Tarek and C. Ramseyer, ACS Nano, 2011, 5, 8571–8578 CrossRef CAS PubMed.
- J. P. Ryman-Rasmussen, E. W. Tewksbury, O. R. Moss, M. F. Cesta, B. A. Wong and J. C. Bonner, Am. J. Respir. Cell Mol. Biol., 2009, 40, 349–358 CrossRef CAS PubMed.
- G. Q. Hu, B. Jiao, X. H. Shi, R. P. Valle, Q. H. Fan and Y. Y. Zuo, ACS Nano, 2013, 7, 10525–10533 CrossRef CAS PubMed.
- Q. H. Fan, Y. E. Wang, X. X. Zhao, J. S. C. Loo and Y. Y. Zuo, ACS Nano, 2011, 5, 6410–6416 CrossRef CAS PubMed.
- A. Huczko, H. Lange, E. Calko, H. Grubek-Jaworska and P. Droszcz, Fullerene Sci. Technol., 2001, 9, 251–254 CrossRef CAS.
- Z. Wang and S. Yang, ChemPhysChem, 2009, 10, 2284–2289 CrossRef CAS PubMed.
- C. C. Chiu, W. Shinoda, R. H. DeVane and S. O. Nielsen, Soft Matter, 2012, 8, 9610–9616 RSC.
- F. Bringezu, J. Q. Ding, G. Brezesinski and J. A. Zasadzinski, Langmuir, 2001, 17, 4641–4648 CrossRef CAS.
- F. R. Poulain and J. A. Clements, West. J. Med., 1995, 162, 43–50 CAS.
- B. Robertson and H. L. Halliday, Biochim. Biophys. Acta, 1998, 1408, 346–361 CrossRef CAS.
- J. P. Ryman-Rasmussen, M. F. Cesta, A. R. Brody, J. K. Shipley-Phillips, J. I. Everitt, E. W. Tewksbury, O. R. Moss, B. A. Wong, D. E. Dodd, M. E. Andersen and J. C. Bonner, Nat. Nanotechnol., 2009, 4, 747–751 CrossRef CAS PubMed.
- A. A. Shvedova, E. R. Kisin, R. Mercer, A. R. Murray, V. J. Johnson, A. I. Potapovich, Y. Y. Tyurina, O. Gorelik, S. Arepalli, D. Schwegler-Berry, A. F. Hubbs, J. Antonini, D. E. Evans, B. K. Ku, D. Ramsey, A. Maynard, V. E. Kagan, V. Castranova and P. Baron, Am. J. Physiol.: Lung Cell. Mol. Physiol, 2005, 289, L698–L708 CrossRef CAS PubMed.
- A. A. Shvedova, E. Kisin, A. R. Murray, V. J. Johnson, O. Gorelik, S. Arepalli, A. F. Hubbs, R. R. Mercer, P. Keohavong, N. Sussman, J. Jin, J. Yin, S. Stone, B. T. Chen, G. Deye, A. Maynard, V. Castranova, P. A. Baron and V. E. Kagan, Am. J. Physiol.: Lung Cell. Mol. Physiol, 2008, 295, L552–L565 CrossRef CAS PubMed.
- J. Muller, F. Huaux, A. Fonseca, J. B. Nagy, N. Moreau, M. Delos, E. Raymundo-Pinero, F. Beguin, M. Kirsch-Volders, I. Fenoglio, B. Fubini and D. Lison, Chem. Res. Toxicol., 2008, 21, 1698–1705 CrossRef CAS PubMed.
- G. M. Mutlu, G. R. S. Budinger, A. A. Green, D. Urich, S. Soberanes, S. E. Chiarella, G. F. Alheid, D. R. McCrimmon, I. Szleifer and M. C. Hersam, Nano Lett., 2010, 10, 1664–1670 CrossRef CAS PubMed.
- S. Choe, R. Chang, J. Jeon and A. Violi, Biophys. J., 2008, 95, 4102–4114 CrossRef CAS PubMed.
- R. Veldhuizen, K. Nag, S. Orgeig and F. Possmayer, Biochim. Biophys. Acta, 1998, 1408, 90–108 CrossRef CAS.
- S. Baoukina, L. Monticelli, S. J. Marrink and D. P. Tieleman, Langmuir, 2007, 23, 12617–12623 CrossRef CAS PubMed.
- S. J. Marrink, H. J. Risselada, S. Yefimov, D. P. Tieleman and A. H. de Vries, J. Phys. Chem. B, 2007, 111, 7812–7824 CrossRef CAS PubMed.
- L. Monticelli, J. Chem. Theory Comput., 2012, 8, 1370–1378 CrossRef CAS.
- B. Hess, C. Kutzner, D. van der Spoel and E. Lindahl, J. Chem. Theory Comput., 2008, 4, 435–447 CrossRef CAS.
- H. J. C. Berendsen, J. P. M. Postma, W. F. Vangunsteren, a. Dinola and J. R. Haak, J. Chem. Phys., 1984, 81, 3684–3690 CrossRef CAS.
- S. J. Marrink, A. H. de Vries and A. E. Mark, J. Phys. Chem. B, 2004, 108, 750–760 CrossRef CAS.
- M. Pannuzzo, A. Raudino, D. Milardi, C. La Rosa and M. Karttunen, Sci. Rep., 2013, 3, 2781, DOI:10.1038/srep02781.
- G. A. Cisneros, M. Karttunen, P. Y. Ren and C. Sagui, Chem. Rev., 2014, 114, 779–814 CrossRef CAS PubMed.
- J. Wong-Ekkabut and M. Karttunen, J. Chem. Theory Comput., 2012, 8, 2905–2911 CrossRef CAS.
- G. M. Torrie and J. P. Valleau, J. Comput. Phys., 1977, 23, 187–199 CrossRef.
- S. Kumar, D. Bouzida, R. H. Swendsen, P. A. Kollman and J. M. Rosenberg, J. Comput. Chem., 1992, 13, 1011–1021 CrossRef CAS.
- J. S. Hub, B. L. de Groot and D. van der Spoel, J. Chem. Theory Comput., 2010, 6, 3713–3720 CrossRef CAS.
- J. Heesemann, J. Am. Chem. Soc., 1980, 102, 2167–2176 CrossRef CAS.
- F. Sun, Biophys. J., 2002, 82, 2511–2519 CrossRef CAS PubMed.
- H. Möhwald, Handbook of biological physics, ed. R. Lipowsky and E. Sackmann, Elsevier, Amsterdam, 1995, vol. 1, pp. 161–211 Search PubMed.
- J. Wong-Ekkabut, S. Baoukina, W. Triampo, I. M. Tang, D. P. Tieleman and L. Monticelli, Nat. Nanotechnol., 2008, 3, 363–368 CrossRef CAS PubMed.
- X. Lin, T. Bai, Y. Y. Zuob and G. Gu, Nanoscale, 2014, 6, 2759–2767 RSC.
- J. Barnoud, G. Rossi and L. Monticelli, Phys. Rev. Lett., 2014, 112, 068102 CrossRef PubMed.
- J. Barnoud, L. Urbini and L. Monticelli, J. R. Soc. Interface DOI:10.1098/rsif.2014.0931.
- S. Zhang, Y. Mu, J. Z. Zhang and W. Xu, PLoS One, 2013, 8, e77436 CAS.
- T. R. Sosnowski, M. Kolinski and L. Gradon, Ann. Occup. Hyg., 2011, 55, 329–338 CrossRef CAS PubMed.
- B. Liu, M. I. Hoopes and M. Karttunen, J. Phys. Chem. B, 2014, 118, 11723–11737 CrossRef CAS PubMed.
- S. Baoukina, L. Monticelli, H. J. Risselada, S. J. Marrink and D. P. Tieleman, Proc. Natl. Acad. Sci. U. S. A., 2008, 105, 10803–10808 CrossRef CAS PubMed.
- V. Knecht, M. Muller, M. Bonn, S. J. Marrink and A. E. Mark, J. Chem. Phys., 2005, 122, 024704 CrossRef PubMed.
- S. L. Duncan and R. G. Larson, Biophys. J., 2008, 94, 2965–2986 CrossRef CAS PubMed.
- M. Javanainen, L. Monticelli, J. B. de la Serna and I. Vattulainen, Langmuir, 2010, 26, 15436–15444 CrossRef CAS PubMed.
- K. Lai, B. A. Wang, Y. Zhang and Y. Zheng, Phys. Chem. Chem. Phys., 2013, 15, 270–278 RSC.
- S. Baoukina, L. Monticelli, M. Amrein and D. P. Tieleman, Biophys. J., 2007, 93, 3775–3782 CrossRef CAS PubMed.
- J. Y. Xie, G. H. Ding and M. Karttunen, Biochim. Biophys. Acta, Biomembr., 2014, 1838, 994–1002 CrossRef CAS PubMed.
- P. Kulovesi, J. Telenius, A. Koivuniemi, G. Brezesinski, A. Rantamaki, T. Viitala, E. Puukilainen, M. Ritala, S. K. Wiedmer, I. Vattulainen and J. M. Holopainen, Biophys. J., 2010, 99, 2559–2567 CrossRef CAS PubMed.
- V. M. Kaganer, H. Möhwald and P. Dutta, Rev. Mod. Phys., 1999, 71, 779–819 CrossRef CAS.
- S. Schurch, J. Goerke and J. A. Clements, Proc. Natl. Acad. Sci. U. S. A., 1976, 73, 4698–4702 CrossRef CAS.
- S. Schurch, J. Goerke and J. A. Clements, Proc. Natl. Acad. Sci. U. S. A., 1978, 75, 3417–3421 CrossRef CAS.
- J. Goerke, Biochim. Biophys. Acta, 1998, 1408, 79–89 CrossRef CAS.
- K. Y. Lee, J. Majewski, T. L. Kuhl, P. B. Howes, K. Kjaer, M. M. Lipp, A. J. Waring, J. A. Zasadzinski and G. S. Smith, Biophys. J., 2001, 81, 572–585 CrossRef CAS PubMed.
- J. Barnoud, G. Rossi, S. J. Marrink and L. Monticelli, PLoS Comput. Biol., 2014, 10, e1003873, DOI:10.1371/journal.pcbi.1003873.
- J. A. Zasadzinski, J. Ding, H. E. Warriner, F. Bringezu and A. J. Waring, Curr. Opin. Colloid Interface Sci., 2001, 6, 506–513 CrossRef CAS.
- J. A. Clements, Arch. Environ. Health, 1961, 2, 280–283 CrossRef CAS PubMed.
- J. A. Clements, Physiologist, 1962, 5, 11–28 CAS.
Footnote |
| † Electronic supplementary information (ESI) available. See DOI: 10.1039/c4ra17006g |
| This journal is © The Royal Society of Chemistry 2015 |

