Preparation, fracture, and fatigue of exfoliated graphene oxide/natural rubber composites†
Bin Donga,
Chang Liua,
Liqun Zhangb and
Youping Wu*b
aState Key Laboratory of Organic-Inorganic Composites, Beijing University of Chemical Technology, Beijing 100029, China
bBeijing Engineering Research Center of Advanced Elastomers, Beijing University of Chemical Technology, Beijing 100029, China. E-mail: wuyp@mail.buct.edu.cn; Fax: +86 10 64456158; Tel: +86 10 64442621
First published on 2nd February 2015
Abstract
Exfoliated graphene oxide (GO) reinforced natural rubber (NR) composites were prepared by a simple and promising latex co-coagulation method. Latex co-coagulation realized the complete exfoliation and uniform dispersion of GO in a NR matrix. The quasi-static fracture and dynamic fatigue behaviors of the composites were investigated. Mechanical properties and J-testing were used to characterize the fracture resistance, and fatigue tests were carried out under cyclic conditions of constant strain. Results revealed that with increasing GO sheet content, the mechanical properties, fracture initiation and propagation resistance were all highly improved. A much higher reinforcing efficiency of GO sheets than that of traditional fillers was realized. Fatigue crack growth resistance was remarkably enhanced with the incorporation of only 1 phr GO sheets. The relatively weak fatigue resistance of composites filled with 3 phr and 5 phr GO was attributed to their high hysteresis loss and tearing energy input. It revealed that GO sheets would be promising fillers in preparation of rubber composites with high fracture and fatigue resistance at low filler content.
1. Introduction
Elastomers are filled with particulate fillers, mostly carbon black and silica, to meet certain demands of some applications in the rubber industry.1 Among these demands, fracture and fatigue resistance should be the primary consideration for some crucial applications like auto tires that have a direct relationship with security and the health of humans.2 Total failure of rubber products is mainly caused by crack initiation (or nucleation) from local stress concentration and then the following crack propagation process. Therefore, the resistance to crack initiation and propagation plays a dominating role in the failure of rubber composites.3,4 The incorporation of fillers highly influences the fracture and fatigue of rubber composites by increasing the chances of blunting and branching at the crack tip, and by providing another hysteresis mechanism which will consume the energy to crack growth.2 For reinforced filler, its particle size, shape factor, surface activity, filling fraction, and dispersion morphology in rubber matrix all highly influence the failure behaviors of rubber composites.Fracture mechanical concepts have been widely used in the investigation of fracture and fatigue behaviors of elastomers.5,6 J-integral theory, a powerful fracture mechanical method, can evaluate the quasi-static fracture initiation and propagation resistance of rubber materials from an energy perspective.7–9 Analytical methods for dynamic fatigue performance are mainly focused on crack nucleation methods and crack propagation methods.10 The maximum principal strain and strain energy density, two widely used fatigue parameters, are the foundation for nucleation methods. And crack nucleation methods mainly consider predicting the nucleation lifetime to the occurrence of cracks with certain size.11,12 Crack propagation methods, which are based on the tearing energy theory proposed by Rivlin and Thomas,13 concentrate on the relationships between fatigue crack growth rate and tearing energy. In recent years, new assistant analytical approach such as finite element analysis (FEA) has caused much attention. Because of its powerful functions in predicting the failure properties of rubber materials without destroying or failing the rubber products, FEA becomes widely available in failure analysis.14
Recently, because of its ultrathin (about 1 nm) two-dimensional nanostructure with extremely large specific surface area (theoretical limit: 2630 m2 g−1),15 exceptional physical performance, and versatile surface chemistry,16 graphene (GE) and its precursor graphene oxide (GO) have attracted tremendous attention as multifunctional filler for polymer based composites. Meanwhile, many investigations have been focused on the preparation of GE or GO sheets reinforced elastomer composites.17–23 Because of the strong Van der Waals and π–π interaction in GE sheets, the uniform dispersion of exfoliated nanosheets in rubber matrix is still the crucial and continuing challenge. Till now, concerns are mainly focused on the improvement in mechanical properties,18,19 electrical conductivity,20 thermal conductivity,21 dielectrical properties,22 and permeability performance.18,23 To our best knowledge, however, the fracture and fatigue crack growth performances of GE or GO reinforced elastomers, which are very significant for the application of rubber products, receive almost no attention.
The preparation methods of graphene based rubber composites, such as melt/mechanical compounding,22 in situ polymerization,24 solution compounding,20,25 and latex co-coagulation23,26,27 have attracted serious attention. Melt compounding seems to be the most economically attractive method to prepare graphene filled elastomer composites. However, its disadvantages of poor dispersion and serious breakage of graphene sheets under high shearing force are inevitable and should not be ignored.26 Compared with solution compounding, which owns persistent problems of pollution and difficulty in removal of residual solvent, latex co-coagulation appears to be a more environment-friendly and promising method.26 Latex co-coagulation has been extensively used in preparation of well dispersed nanoclay filled rubber composites by our research group of Zhang and even has been successfully industrialized.28–30 In consideration that graphene has similar two-dimensional structure like nanoclay, an analogous method of latex co-coagulation can be expected to prepare graphene filled rubber composites.
In the present study, NR composites reinforced with exfoliated and well dispersed GO sheets were prepared by latex compounding and co-coagulation approach. The effects of exfoliated GO sheets on mechanical properties, fracture and fatigue resistance of NR nanocomposites were systematically investigated. The incorporation of GO sheets promoted strain-induced crystallization (SIC) under deformation. A much more remarkable reinforcing efficiency of GO sheets than that of traditional fillers was realized. Mechanical properties and fracture resistance were both markedly enhanced with increasing GO sheet content. An optimum loading of GO sheets (1 phr) was realized in obtaining the most powerful fatigue crack growth resistance for GO/NR composites. Based on the results, the tearing energy input and hysteresis loss were both taken into account to investigate the failure mechanism. This exploratory work contributed new insights into the preparation of GO-based rubber composites with high fracture and fatigue crack growth resistance at low filler loading.
2. Experimental
2.1 Materials
High ammonia stabilized natural rubber latex (NRL) with solid content of 60% and pH about 10 was supplied by Hainan Natural Rubber Industry Group Co., Ltd., China. Natural flaked graphite was purchased from Huadong Graphite Factory, China. Concentrated sulphuric acid (H2SO4), potassium permanganate (KMnO4), concentrated hydrochloric acid (HCl), ammonia solution (NH3·H2O), and calcium chloride (CaCl2) were all provided by Beijing Chemical Factory, China. The other ingredients, such as zinc oxide (ZnO), stearic acid (SA), and sulfur (S), were all commercially available industrial products.2.2 Preparation of GO suspensions
Graphite oxide was prepared according to modified Hummers method.31 Briefly, natural flaked graphite was highly oxidized to graphite oxide by strong oxidizers concentrated H2SO4 and KMnO4. GO aqueous suspension with concentration of 2 mg mL−1 was produced by ultrasonic exfoliation of graphite oxide with an ultrasonic cell crusher for 40 min in water. No detectable precipitate was observed after high speed centrifugation. After the ultra-sonication, the pH of GO solution was adjusted to about 10 with ammonia solution to keep the stability of solution.2.3 Preparation of GO/NR nanocomposites
A latex compounding and co-coagulation method was adopted to prepare GO sheets reinforced NR composites. A designed amount of GO aqueous suspension was added into NR latex. After stirred vigorously for 20 min, the homogeneously mixed suspension was rapidly poured into CaCl2 solution (1 wt%), accompanied with the rapid co-coagulation procedure. The obtained compound was cut up and washed with plenty of water for several times, and then dried in an oven at 50 °C until a constant weight.The formulae of the prepared five composites are detailed in Table 1. The symbols GO-0, GO-0.5, GO-1, GO-3, and GO-5, mean that the loadings of GO sheets are 0 phr, 0.5 phr, 1 phr, 3 phr, and 5 phr, respectively. The volume fraction vol% of GO in NR composites was determined by using the density of 2.20 g cm−3 for GO and the density of 1.01 g cm−3 for unfilled NR composite. The volume fractions of GO-0.5, GO-1, GO-3, and GO-5 are 0.2 vol%, 0.4 vol%, 1.2 vol%, and 2.0 vol%, respectively. After the latex co-coagulation, the dried mixture was blended with the residual ingredients (presented in Table 1) by an open two-roll mill. The obtained GO/NR compounds with different GO content were then vulcanized in the form of 2 mm thick sheets at 143 °C and 15 MPa for optimum cure time t90 determined by a moving die rheometer.
| Samples | GO-0 | GO-0.5 | GO-1 | GO-3 | GO-5 |
|---|---|---|---|---|---|
| a phr: parts per hundred parts of rubbers.b 4010 NA: N-isopropyl-N′-phenyl-p-phenylenediamine.c DM: 2,2-dibenzothiazole disulfide (MBTS). | |||||
| Graphene oxide | 0 | 0.5 | 1 | 3 | 5 |
| Natural rubber | 100 | 100 | 100 | 100 | 100 |
| Zinc oxide | 5 | 5 | 5 | 5 | 5 |
| Stearic acid | 2 | 2 | 2 | 2 | 2 |
| 4010 NAb | 2 | 2 | 2 | 2 | 2 |
| Solid wax | 1 | 1 | 1 | 1 | 1 |
| DMc | 1.8 | 1.8 | 1.8 | 1.8 | 1.8 |
| Sulfur | 1.8 | 1.8 | 1.8 | 1.8 | 1.8 |
2.4 Characterization and measurement
 | (1) |
For SENT specimens we adopted, tearing energy G, which was dependent on the strain energy density SED (also abbreviated as w), was measured by the eqn (2):4
 | (2) |
3. Results and discussion
3.1 Structural characterization of GO
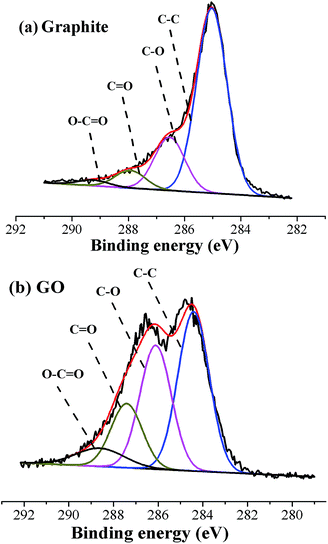
The typical SEM graphs of graphite oxide and exfoliated GO sheets (shown in ESI, Fig. S1(a) and (b)†) suggested that the graphite oxide with thousands of multiple layers was exfoliated to single sheets by sonication. AFM measurement in tapping mode (shown in ESI, Fig. S1(c)†) revealed that the thickness of the single GO sheet obtained was about 1 nm, suggesting the complete exfoliation of graphite oxide.33 The XRD spectra (shown in ESI, Fig. S1(d)†) revealed that the interlayer distance of graphite was expanded from 0.34 nm to 0.73 nm after oxidization. No detectable diffraction peak was observed for GO, indicating the existence of single sheets and the successful exfoliation of graphite oxide. The Raman spectra (shown in ESI, Fig. S2†) revealed that the intensity ratio of D band and G band (ID/IG) increased from 0.10 for graphite to 0.91 for GO, suggesting that the ordered structure of graphite was destroyed to some extent after oxidation.The C1s XPS spectra of graphite and GO sheets (shown in Fig. 1) confirmed that the C/O atom ratio for graphite was 5.62; however, the C/O atom ratio for GO was 2.10. Results were in well agreement with that reported in literature.31 The relative percentage contents of functional groups of graphite and GO sheets were summarized in Table S1.† Notable to find that the contents of oxygenic groups of GO were highly improved after oxidization. The abundant oxygenic groups on the surface of GO sheets, such as –COOH and –OH groups, could highly facilitate the solubility and stability of GO sheets in aqueous solution, providing the premise for latex compounding and co-coagulation.33,34
3.2 Preparation of GO/NR composites and dispersion state of GO sheets
A detailed schematic illustration of the fabrication process of GO/NR composites by latex compounding and co-coagulation is presented in Fig. 2. The hydrophobic cis-1,4-polyisoprene core of NRL particle was surrounded by a protective hydrophilic shell comprising principally protein–phospholipids complex.35 In ammonia solution with pH about 10, NRL particles were highly negative charged because of the ionization of carboxylic acid groups of surface protein. Exfoliated GO sheets with abundant hydrophilic groups were also negative charged in alkaline condition.32 Zeta potential, which was strongly pH dependent, could be used to measure the colloidal stability. According to colloidal science, colloidal particles with zeta potential more negative than −30 mV could ensure its sufficient stability by mutual repulsion.36 When pH approached about 10, zeta potential of GO sheets could reach about −43 mV;33 however, zeta potential of NRL particles could reach about −89 mV.37 Therefore, the electrostatic repulsion among NRL particles and GO sheets could ensure the uniform and stable dispersion in aqueous phase. The latex flocculation should be a competition between NRL particles and exfoliated GO sheets upon the addition of positive cationic flocculants, such as CaCl2 solution. With much more negative zeta potential of NRL particles than that of GO sheets, the restack of GO sheets could be kinetically restricted and prevented by the much more rapid coagulation of NRL particles. Therefore, the original dispersion morphology of GO sheets and NRL particles in aqueous solution could be maintained.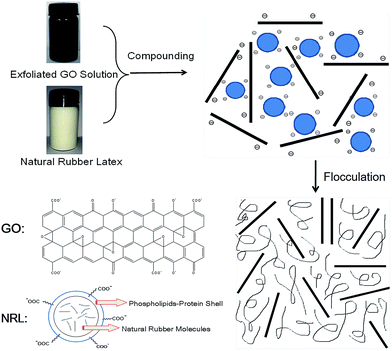 | ||
| Fig. 2 Schematic illustration of preparation of GO/NR composites by latex compounding and co-coagulation method. | ||
To directly examine the dispersion morphology of GO sheets in NR matrix, we performed TEM for the GO/NR composites. The TEM images of GO/NR composites at a magnification of 9900 are presented in Fig. 3. TEM graphs of GO/NR composites at a higher magnification are shown in Fig. S3.† It clearly suggested that GO were finely exfoliated and uniformly dispersed throughout the NR matrix, and no obvious layer-by-layer restack of GO sheets was observed, even when the content of GO sheets was 5 phr. Therefore, well exfoliated and dispersed GO sheets reinforced NR composites were successfully prepared by latex co-coagulation method.
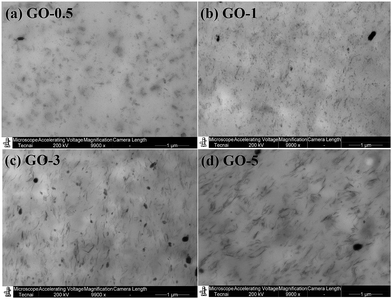 | ||
| Fig. 3 TEM micrographs of GO/NR composites at a magnification of 9900: (a) GO-0.5; (b) GO-1; (c) GO-3; (d) GO-5. | ||
3.3 Mechanical performance of GO/NR composites
Mechanical properties of GO/NR composites are summarized in Table 2, and the representative stress–strain curves are shown in Fig. S4.† With increase in GO sheet content, the modulus at 100%, modulus at 300%, tensile strength, tear strength, and Shore A hardness were all highly elevated, accompanied with a slightly decreased elongation at break because of the restricted movement of NR chains. Compared with those of GO-0, the modulus at 100% and modulus at 300% of GO-5 were enhanced by 100% and 257%, respectively. However, for NR composites filled with 5 phr carbon black (N330), Pal et al. obtained an increase of about 40% in modulus at 300%,38 and Potts et al. found an increase of about 24% in modulus at 100% and 42% in modulus at 300%.39 Therefore, composites filled with equal content of GO (5 phr) obtained a much higher enhancement in tensile modulus. Such increase in tensile modulus was unusual. These results revealed that the reinforcing efficiency of two-dimensional GO sheets was much higher than that of traditional fillers, which was mainly attributed to the much higher specific surface area and aspect ratio of exfoliated GO sheets. The corresponding BET surface area of carbon black, silica, and GO are summarized in Table S2.†| Samples | GO-0 | GO-0.5 | GO-1 | GO-3 | GO-5 |
|---|---|---|---|---|---|
| Modulus at 100% (MPa) | 0.6 | 0.7 | 0.8 | 1.0 | 1.2 |
| Modulus at 300% (MPa) | 1.4 | 1.9 | 2.2 | 3.4 | 5.0 |
| Tensile strength (MPa) | 20.6 | 22.9 | 24.1 | 25.8 | 27.9 |
| Tear strength (kN m−1) | 25.4 | 28.3 | 30.7 | 37.9 | 45.9 |
| Elongation at break (%) | 745 | 718 | 705 | 682 | 657 |
| Shore A hardness | 34.8 | 37.4 | 39.1 | 45.3 | 47.5 |
For the purpose of evaluating the effect of GO sheets on strain-induced crystallization (SIC), which played a crucial influence on reinforcement for NR, modified Mooney–Rivlin plots of GO/NR composites were analyzed. The stress–strain curves were transformed into modified Mooney–Rivlin plots according to the following eqn (3), first proposed by Furukawa, to eliminate the effect of finite extensibility of rubber chains.40
 | (3) |
In eqn (3), σ is the nominal stress, λ is the extension ratio, C1 and C2 are Mooney–Rivlin constants independent of λ. And f(λ) is a function of λ and its expression is shown in eqn (4):
 | (4) |
 | (5) |
Modified Mooney–Rivlin plots of σ/F(λ) versus λ−1 are presented in Fig. 4, and its corresponding values of C1, C2, and λup are summarized in Table S3.† The gradually increased C1 values indicated the elevated elastic modulus and crosslink density.41 With increase in GO sheet content, the upturn points gradually shifted to higher λ−1 (mean lower strains), and the values of critical λup decreased, which suggested that the initial strain for SIC was decreased; therefore, the ability of SIC was promoted. The elevated SIC could be attributed to the increased effective volume fraction of filler and the pronounced strain amplification effect induced by two-dimensional GO with high special surface area.39,42
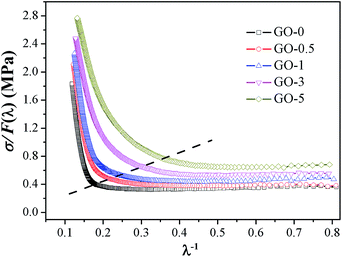 | ||
| Fig. 4 Representative modified Mooney–Rivlin plots of σ/F(λ) versus reciprocal extension ratio λ−1 of GO/NR composites. | ||
3.4 Quasi-static fracture resistance
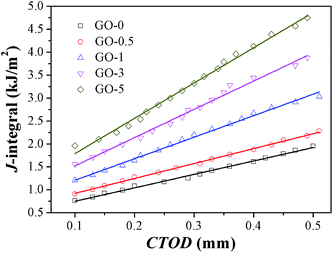
The quasi-static fracture resistance of GO/NR composites was measured by J-integral testing. Critical energy value JIC was used to measure crack initiation resistance, and tearing modulus TR was adopted to characterize crack propagation resistance. Fracture resistance plots (J-value versus CTOD) of GO/NR composites at pre-cut length of 1 mm were presented in Fig. 5. The obtained values of JIC and TR are shown in Table 3. At the same CTOD, the corresponding J-value was increased by increasing the GO sheet content. The markedly elevated JIC and TR shown in Table 3 revealed the fact that the incorporation of exfoliated GO nanosheets highly improved the fracture initiation and propagation resistance. Studies have shown that fillers with layered two-dimensional structure, just like layered silicate, could easily orient along deformation direction.43 The enhanced fracture resistance was mainly attributed to crack blunting at the crack tip, which was mainly resulted from the orientation of GO sheets and strain-induced crystallization of NR chains along the deformation direction.| Samples | GO-0 | GO-0.5 | GO-1 | GO-3 | GO-5 |
|---|---|---|---|---|---|
| JIC (kJ m−2) | 0.76 | 0.91 | 1.21 | 1.56 | 1.96 |
| TR (MPa) | 2.92 | 3.26 | 4.69 | 6.16 | 7.70 |
3.5 Dynamic fatigue resistance
The dynamic fatigue resistance of GO/NR composites under broad strains that ranged from 30% to 80% was investigated. The plots of crack length a versus fatigue cycles N under strain of 50% and corresponding fatigue lifetimes are presented in Fig. 6, as a typical example. The stable crack growth rate da/dN was measured by the linear slope of crack length a versus fatigue cycles N in the crack range of 1 mm to 2 mm. The fatigue lifetimes and crack growth rates of GO/NR composites under varied strains are shown in Fig. 7a and b, respectively. We noted that GO-1 exhibited the longest lifetimes and slowest crack growth rates under all strains investigated, which suggested the strongest fatigue crack growth performance. For example, under strain of 50%, the fatigue lifetime of NR composite filled with only 1 phr exfoliated GO was enhanced by 38%, and the crack growth rate was reduced by 40%, compared with GO-0. Such remarkable enhancement in fatigue crack growth resistance at such low filler loading (1 phr) was unusual. Unexpected to note that GO-3 and GO-5 exhibited the weakest fatigue resistance even than NR-0, which was different from the results of quasi-static fracture tests. That was to say, an optimum loading of GO sheets (1 phr) was realized when obtaining the most powerful fatigue crack growth resistance for GO/NR composites, and the fatigue resistance would rapidly decrease after the GO sheet content exceeded the optimum loading. Based on the results stated above, the tearing energy input and hysteresis loss, which both greatly influenced the crack growth resistance, were taken into account to investigate the failure mechanism of GO/NR composites.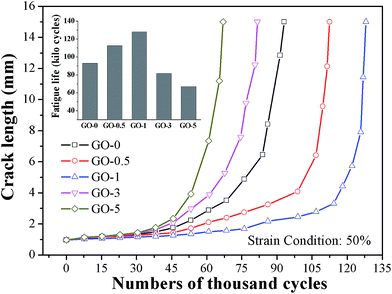 | ||
| Fig. 6 Crack length versus fatigue cycles and its fatigue lifetimes of GO/NR composites under strain of 50%. | ||
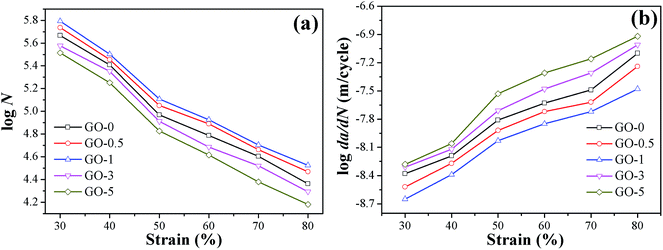 | ||
| Fig. 7 Fatigue crack growth performance of GO/NR composites under different strains: (a) fatigue lifetimes N; (b) crack growth rates da/dN. | ||
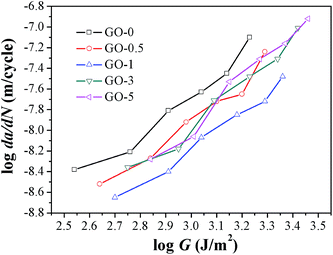
Studies demonstrated that the fatigue crack growth resistance for certain elastomers could be determined by the input tearing energy.44 Considering that the fatigue tests were performed under constant strain, we also compared the fatigue resistance of composites under constant tearing energy. The tearing energy under strain of 50% was shown in Table 4 as a representative example. It confirmed that the tearing energy input per cycle was greatly enhanced by increasing GO sheet content. Compared with that of NR-0 under strain of 50%, tearing energy was increased by 55% for GO-3 and 73% for GO-5, respectively. The plots of fatigue crack growth rate under varied tearing energy are presented in Fig. 8. Dramatic to note that GO-0 exhibited the lowest fatigue resistance under certain constant tearing energy, and GO-1 possessed the highest fatigue resistance in the investigated tearing energy range. That was to say, if we compared the fatigue resistance from the energy perspective, the incorporation of GO sheets would always improve the fatigue resistance. However, the strikingly increased tearing energy input, as shown in Table 4, would cause catastrophic influence on dynamic fatigue resistance for GO/NR composites.
| Samples | GO-0 | GO-0.5 | GO-1 | GO-3 | GO-5 |
|---|---|---|---|---|---|
| Tearing energy G (J m−2) | 810 | 951 | 1110 | 1252 | 1403 |
3.6 Hysteresis loss
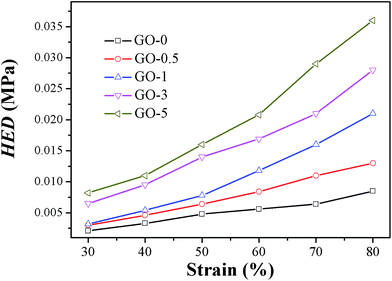
The viscoelastic dissipation mechanism is one of the most important factors in dominating the fatigue resistance of rubbers.45 Hysteresis plays a double-sided effect on crack growth resistance.46,47 Firstly, hysteresis enhances the crack growth resistance by consuming the energy which will be dissipated for crack growth. However, hysteresis also induces detrimental effect on dynamic crack growth because hysteresis energy will be all transformed into heat. Unless heat is dissipated rapidly, the elevated temperature by heat generation and build-up will always promote further fatigue cracking.48 Certainly, heat build-up should be ignored for quasi-static fracture.Hysteresis energy density HED of different GO/NR composites under varied strains are presented in Fig. 9. As a typical example, values of HED and H (%) under strain of 50% are shown in Table 5. Results indicated that HED and H (%) were both strikingly enhanced by increasing the content of GO sheets. Compared with those of GO-0, the HED and H (%) of GO-5 advanced 3.5 times and 1.9 times, respectively, under strain of 50%. The highly elevated hysteresis would be detrimental for dynamic fatigue resistance.
| Samples | GO-0 | GO-0.5 | GO-1 | GO-3 | GO-5 |
|---|---|---|---|---|---|
| HED (MPa) | 0.005 | 0.006 | 0.008 | 0.014 | 0.017 |
| H (%) | 4.4 | 4.8 | 5.2 | 7.9 | 8.3 |
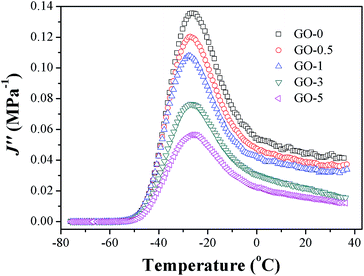
Different from the HED and H (%) which reflected the hysteresis in the bulk of rubber composites, loss compliance J′′, a viscoelastic parameter, could characterize the hysteresis at the crack tip under cyclic condition.45 Here DMTA method was adopted to measure the J′′ of GO/NR composites under different temperature. Based on the theory proposed by Persson et al.,45 an expression which described the relationship between J′′ and tearing energy G(ν) at a certain crack growth rate ν was proposed and presented in eqn (6).
 | (6) |
In eqn (6), G0 denotes the threshold energy to crack growth at the crack tip; F(ω) is a function of frequency ω, crack tip diameter a, and crack growth velocity ν. It shows that composite with lower J′′ corresponds to large tearing energy at the same crack growth velocity. The composite with a larger tearing energy means that it needs more energy dissipation or hysteresis energy at the same crack growth velocity near the crack tip.49 The J′′ of GO/NR composites plotted against temperature are presented in Fig. 10. At room temperature, the J′′ gradually decreased with the increase in GO sheet content, and GO-3 and GO-5 exhibited much lower J′′ than others did, suggesting that hysteresis energy near the crack tip was remarkably enhanced with increasing GO sheet content. The SEM micrographs of fracture surface after fatigue were measured and presented in Fig. S5.† The increased surface roughness indicated an increased hysteresis energy during the fatigue process. The strikingly increased hysteresis was attributed to the frictional slide at the interface between the surface of the GO sheets and rubber chains, and it would be detrimental for the dynamic fatigue performance. Therefore, the remarkable heat build-up caused by high hysteresis should be another reason for the relatively weak fatigue crack growth resistance of GO-3 and GO-5 composites.
Combined the discussions stated above, although the uniformly dispersed GO sheets in rubber matrix, highly oriented GO sheets under deformation, and greatly promoted SIC all contributed to enhance the fracture and fatigue resistance, the elevated tearing energy and hysteresis loss played the much more dominating role in fatigue resistance for GO-3 and GO-5. However, for uniaxial quasi-static fracture of GO/NR composites, heat generation caused by hysteresis should be ignored. Therefore, the optimum loading of GO sheets should be the critical concern to obtain GO/NR composites with excellent fatigue resistance.
4. Conclusions
Latex co-coagulation method was carried out to prepare completely exfoliated GO reinforced NR composites with exfoliated and uniform dispersion morphology. GO/NR composites exhibited dramatic promotion in mechanical properties and fracture resistance. For fatigue behavior, NR composites reinforced with 1 phr GO exhibited the most powerful crack growth resistance, suggesting that there existed an optimum loading of GO sheets for fatigue performance. Different from the fracture tests, the GO-3 and GO-5 exhibited the weakest fatigue resistance. Reasons could be attributed to the highly increased hysteresis loss and tearing energy input with increase in GO sheet content, which induced disastrous influence on fatigue performance. This exploratory work indicated that GO would be promising filler in preparation of rubber composites with high crack growth resistance at low filler content. It also revealed that an optimum GO content should be paid much attention when preparing GO reinforced rubber composites with excellent fatigue resistance.Acknowledgements
The authors would like to gratefully acknowledge the financial supports of the State Key Program of National Natural Science of China (51333004) and the National Key Technology Support Program of China (2013BAF08B03).References
- L. Bokobza, Macromol. Mater. Eng., 2004, 289, 607–621 CrossRef CAS.
- G. J. Lake, Rubber Chem. Technol., 1995, 68, 435–460 CrossRef CAS.
- G. R. Hamed, Rubber Chem. Technol., 1994, 67, 529–536 CrossRef CAS.
- G. J. Lake, Rubber Chem. Technol., 2003, 76, 567–591 CrossRef CAS.
- K. Reincke, W. Grellmann and G. Heinrich, Rubber Chem. Technol., 2004, 77, 662–677 CrossRef CAS.
- G. Weng, H. Yao, A. Chang, K. Fu, Y. Liu and Z. Chen, RSC Adv., 2014, 4, 43942–43950 RSC.
- C. L. Chow, J. Wang and P. N. Tse, Tire Sci. Technol., 1988, 16, 44–60 CrossRef.
- G. Ramorino, S. Agnelli, R. De Santis and T. Riccò, Eng. Fract. Mech., 2010, 77, 1527–1536 CrossRef PubMed.
- B. Dong, C. Liu and Y. P. Wu, Polym. Test., 2014, 38, 40–45 CrossRef CAS PubMed.
- W. V. Mars and A. Fatemi, Int. J. Fatigue, 2002, 24, 949–961 CrossRef CAS.
- W. V. Mars and A. Fatemi, Fatigue Fract. Eng. Mater. Struct., 2003, 26, 779–789 CrossRef CAS PubMed.
- E. Verron, J. B. Le Cam and L. Gornet, Mech. Res. Commun., 2006, 33, 493–498 CrossRef PubMed.
- R. S. Rivlin and A. G. Thomas, J. Polym. Sci., 1953, 10, 291–318 CrossRef CAS.
- Q. Li, J. Zhao and B. Zhao, Eng. Failure Anal., 2009, 16, 2304–2310 CrossRef CAS PubMed.
- V. Singh, D. Joung, L. Zhai, S. Das, S. I. Khondaker and S. Seal, Prog. Mater. Sci., 2011, 56, 1178–1271 CrossRef CAS PubMed.
- J. T. Paci, T. Belytschko and G. C. Schatz, J. Phys. Chem. C, 2007, 111, 18099–18111 CAS.
- A. Das, R. Boldt, R. Jurk, D. Jehnichen, D. Fischer, K. W. Stöckelhuber and G. Heinrich, RSC Adv., 2014, 4, 9300–9307 RSC.
- J. Wu, G. Huang, H. Li, S. Wu, Y. Liu and J. Zheng, Polymer, 2013, 54, 1930–1937 CrossRef CAS PubMed.
- W. Xing, M. Tang, J. Wu, G. Huang, H. Li, Z. Lei, X. Fu and H. Li, Compos. Sci. Technol., 2014, 99, 67–74 CrossRef CAS PubMed.
- B. Ozbas, C. D. O'Neill, R. A. Register, I. A. Aksay, R. K. Prud'homme and D. H. Adamson, J. Polym. Sci., Part B: Polym. Phys., 2012, 50, 910–916 CrossRef CAS.
- Y. Zhan, M. Lavorgna, G. Buonocore and H. Xia, J. Mater. Chem., 2012, 22, 10464–10468 RSC.
- M. Hernández, M. M. Bernal, R. Verdejo, T. A. Ezquerra and M. A. López-Manchado, Compos. Sci. Technol., 2012, 73, 40–46 CrossRef PubMed.
- H. Kang, K. Zuo, Z. Wang, L. Zhang, L. Liu and B. Guo, Compos. Sci. Technol., 2014, 92, 1–8 CrossRef CAS PubMed.
- H. Kim, Y. Miura and C. W. Macosko, Chem. Mater., 2010, 22, 3441–3450 CrossRef.
- L. Yang, S. L. Phua, C. L. Toh, L. Zhang, H. Ling, M. Chang, D. Zhou, Y. Dong and X. Lu, RSC Adv., 2013, 3, 6377–6385 RSC.
- Z. Tang, X. Wu, B. Guo, L. Zhang and D. Jia, J. Mater. Chem., 2012, 22, 7492–7501 RSC.
- J. R. Potts, O. Shankar, L. Du and R. S. Ruoff, Macromolecules, 2012, 45, 6045–6055 CrossRef CAS.
- L. Zhang, Y. Wang, Y. Wang, Y. Sui and D. Yu, J. Appl. Polym. Sci., 2000, 78, 1873–1878 CrossRef CAS.
- Y. P. Wu, L. Q. Zhang, Y. Q. Wang, Y. Liang and D. S. Yu, J. Appl. Polym. Sci., 2001, 82, 2842–2848 CrossRef CAS.
- Y. P. Wu, Y. Q. Wang, H. F. Zhang, Y. Z. Wang, D. S. Yu, L. Q. Zhang and J. Yang, Compos. Sci. Technol., 2005, 65, 1195–1202 CrossRef CAS PubMed.
- W. S. Hummers Jr and R. E. Offeman, J. Am. Chem. Soc., 1958, 80, 1339 CrossRef.
- K. Reincke, W. Grellmann and M. Klüppel, KGK, Kautsch. Gummi Kunstst., 2009, 62, 246–251 Search PubMed.
- D. Li, M. B. Müller, S. Gilje, R. B. Kaner and G. G. Wallace, Nat. Nanotechnol., 2008, 3, 101–105 CrossRef CAS PubMed.
- Y. Si and E. T. Samulski, Nano Lett., 2008, 8, 1679–1682 CrossRef CAS PubMed.
- M. M. Rippel, L. T. Lee, C. A. P. Leite and F. Galembeck, J. Colloid Interface Sci., 2003, 268, 330–340 CrossRef CAS PubMed.
- D. H. Everett, Basic Principles of Colloid Science, The Royal Society of Chemistry, London, 1988 Search PubMed.
- H. Yang, P. Liu, T. Zhang, Y. Duan and J. Zhang, RSC Adv., 2014, 4, 27687–27690 RSC.
- P. K. Pal, A. K. Bhowmick and S. K. De, Rubber Chem. Technol., 1982, 55, 23–40 CrossRef CAS.
- J. R. Potts, O. Shankar, S. Murali, L. Du and R. S. Ruoff, Compos. Sci. Technol., 2013, 74, 166–172 CrossRef CAS PubMed.
- J. Furukawa, Y. Onouchi, S. Inagaki and H. Okamoto, Polym. Bull., 1982, 6, 381–387 CrossRef CAS.
- Y. Nie, B. Wang, G. Huang, L. Qu, P. Zhang, G. Weng and J. Wu, J. Appl. Polym. Sci., 2010, 117, 3441–3447 CrossRef CAS.
- D. C. Stanier, A. J. Patil, C. Sriwong, S. S. Rahatekar and J. Ciambella, Compos. Sci. Technol., 2014, 95, 59–66 CrossRef CAS PubMed.
- M. Hernández, A. Sanz, A. Nogales, T. A. Ezquerra and M. A. López-Manchado, Macromolecules, 2013, 46, 3176–3182 CrossRef.
- D. G. Young, Rubber Chem. Technol., 1990, 63, 567–581 CrossRef CAS.
- B. N. J. Persson and E. A. Brener, Phys. Rev. E: Stat., Nonlinear, Soft Matter Phys., 2005, 71, 036123 CrossRef CAS.
- P. B. Lindley, Int. J. Fract., 1973, 9, 449–462 CAS.
- G. R. Hamed, Rubber Chem. Technol., 1991, 64, 493–500 CrossRef CAS.
- A. N. Gent, Engineering with Rubber: How to Design Rubber Components, Carl Hanser Verlag GmbH Co KG, 2012 Search PubMed.
- S. Rooj, A. Das, I. A. Morozov, K. W. Stöckelhuber, R. Stocek and G. Heinrich, Compos. Sci. Technol., 2013, 76, 61–68 CrossRef CAS PubMed.
Footnote |
† Electronic supplementary information (ESI) available: SEM graphs of graphite oxide and GO sheets; AFM tapping mode image and its height profiles; XRD patterns; Raman spectra of graphite and GO; TEM images at a higher magnification of 29![[thin space (1/6-em)]](https://www.rsc.org/images/entities/char_2009.gif) 000; stress–strain curves of GO/NR composites; SEM graphs of fracture surface after fatigue; table of XPS C1s peak position and relative atomic percentage; table of BET surface area; table of C1, C2 and λup. See DOI: 10.1039/c4ra17051b 000; stress–strain curves of GO/NR composites; SEM graphs of fracture surface after fatigue; table of XPS C1s peak position and relative atomic percentage; table of BET surface area; table of C1, C2 and λup. See DOI: 10.1039/c4ra17051b |
| This journal is © The Royal Society of Chemistry 2015 |

