Controlled synthesis of graphene–Gd(OH)3 nanocomposites and their application for detection of ascorbic acid†
Hong Ruan,
Baoyong Liu and
Hongguang Li*
Laboratory of Clean Energy Chemistry and Materials, Lanzhou Institute of Chemical Physics, Chinese Academy of Sciences, Lanzhou 730000, China. E-mail: hgli@licp.cas.cn
First published on 17th February 2015
Abstract
In this report, graphene–gadolinium hydroxide (GR–Gd(OH)3) nanocomposites have been prepared using the hydrothermal process. The crystalline structures of GR–Gd(OH)3 have been determined by X-ray diffraction (XRD) measurements and their morphologies have been revealed by field-emission scanning electron microscopy (FE-SEM) observations. The optical properties of GR–Gd(OH)3 have been examined by UV-vis and Fourier transform infrared (FTIR) measurements which revealed mutual interactions between GR and Gd(OH)3. GR–Gd(OH)3 was used to modify the glassy carbon electrode (GCE) which was subsequently utilized for electro-oxidation of ascorbic acid (AA) by cyclic voltammetry method. It was found that the electro-catalytic behavior of GCE modified by GR–Gd(OH)3 (GCE/GR–Gd(OH)3) was superior to that of the bare GCE. The catalytic oxidation peak current showed a linear dependence on the AA concentration and a linear calibration curve was obtained in the concentration range of 0.1–2.5 mM of AA with the lowest limit of detection (LOD) of 0.06 mM. Simultaneously, the oxidation peaks of AA over GCE/GR–Gd(OH)3 shifted to lower over potential compared to that of GCE modified by Gd(OH)3 (GCE/Gd(OH)3). The results indicate that GR–Gd(OH)3 can be used as a promising electrode modifier, which offers a new promising platform for application of the rare earth compound in electrochemistry and bioelectronics. Synchronously, the controlled synthesis of GR–Gd(OH)3 opens an efficient and facile strategy to design other GR-based, rare earth-containing nanocomposites.
1. Introduction
The discovery of graphene (GR) has instigated intense interest in two-dimensional nanomaterials. Owing to its large specific surface area, extraordinary electronic properties and excellent thermal conductivity, GR has been used as a promising material for application in electrochemical devices such as chemical sensors, biosensors, supercapacitors and batteries.1,2 In the case of electrochemical sensing, densities of attached analytic molecules were increased due to the high surface area of GR, which in turn can facilitate high sensitivity and device miniaturization.3 In addition, the function of GR can be further amplified by decoration with guest molecules and/or materials4 such as polymers5 and nanoparticles.6 The formed hybrid materials usually show additional and/or superior properties compared to the individual components.Rare earth compounds have been used in high performance luminescent devices, optical transmission, lighting displays and biochemical probes due to their outstanding optical, electronic and magnetic properties.7–9 One of the most attractive members in rare earth materials is Gd(OH)3 which has been used as catalyst, sorbent and precursor for the preparation of Gd2O3 by thermal dehydration.10–12 It is generally accepted that the size, morphology and crystallinity of a given rare earth material have a key effect on its property.13,14 Hence considerable attention has been paid to the synthesis of Gd(OH)3 nanomaterials with well-controlled morphologies such as rods, bundles and sheets.11,15–18 However, to the best of our knowledge, reports on GR–Gd(OH)3 nanocomposites with well-controlled shapes are yet to come. In addition, though the preparation of Gd(OH)3 nanomaterials have already been well-documented, little work has been carried out to investigate their electro-catalytic behavior.
In this work, we aim to prepare GR–Gd(OH)3 nanocomposites with well-defined morphologies by a facile hydrothermal method and to systematically investigate their electro-catalytic properties. For the latter purpose, oxidation of ascorbic acid (AA) was selected as a model reaction. It is known that AA is difficult to be directly oxidized at a conventional electrode due to its high over potential, low selectivity, poor sensitivity and poor reproducibility.19 To solve this problem, numerous attempts have been made by modifying the electrode surface with various nanostructured materials.20–24 However, little work has been focused on lowering the over potential of AA oxidation. Here, by modifying the GCE with GR–Gd(OH)3 nanocomposites, we have succeeded in improving the sensitivity and simultaneously lowering the over potential of AA oxidation, which offers a new promising platform for application of the rare earth compound in electrochemistry and bioelectronics.
2. Experimental
2.1. Materials
Graphite flakes (325 mesh), and all the other chemicals including KMnO4, H2SO4 (98 wt%), concentrated HNO3 and HCl, NaNO3, H2O2 (30 wt%), Gd(NO3)3, NaOH, Na2HPO4, KH2PO4, ascorbic acid (AA) and ethanol were obtained from Shanghai Chemical Company. AA solutions were prepared freshly prior to use. Phosphate buffered saline (PBS) of pH 7.0 were prepared using Na2HPO4 (0.1 mol L−1) and KH2PO4 (0.1 mol L−1). Deionized water was used throughout the experiments.2.2. Preparation of graphene oxide (GO)
GO was synthesized by a modified Hummers' method.25 In brief, graphite flakes were gradually added into a mixture of 20 mL of concentrated H2SO4![[thin space (1/6-em)]](https://www.rsc.org/images/entities/char_2009.gif) :
:![[thin space (1/6-em)]](https://www.rsc.org/images/entities/char_2009.gif) HNO3 (with a volume ratio of 3
HNO3 (with a volume ratio of 3![[thin space (1/6-em)]](https://www.rsc.org/images/entities/char_2009.gif) :
:![[thin space (1/6-em)]](https://www.rsc.org/images/entities/char_2009.gif) 1). The solution was heated to 80 °C followed by stirring for 8 h. The mixture was cooled to room temperature and poured into 50 mL cold (0 °C) water. After 12 h, the sample was centrifuged and washed with water. A black sample labeled as pre-oxidized graphite was obtained. To the mixed powder of 1 g pre-oxidized graphite and 1.03 g NaNO3, 62 g concentrated H2SO4 was slowly dropped, followed by the slow addition of 4.5 g KMnO4 under violent stirring. The temperature was kept below 20 °C during the whole process and the reaction was allowed to continue for two days before it is ended by 140 mL water. Then, 30 wt% H2O2 was added slowly until the solution turned bright yellow, which was centrifuged and washed first with 1 M HCl aqueous solution and then with water for several times until the pH of the mixture was neutral. Finally, the GO slurry was purified by dialysis for a week and dried in vacuum at 60 °C for further use.
1). The solution was heated to 80 °C followed by stirring for 8 h. The mixture was cooled to room temperature and poured into 50 mL cold (0 °C) water. After 12 h, the sample was centrifuged and washed with water. A black sample labeled as pre-oxidized graphite was obtained. To the mixed powder of 1 g pre-oxidized graphite and 1.03 g NaNO3, 62 g concentrated H2SO4 was slowly dropped, followed by the slow addition of 4.5 g KMnO4 under violent stirring. The temperature was kept below 20 °C during the whole process and the reaction was allowed to continue for two days before it is ended by 140 mL water. Then, 30 wt% H2O2 was added slowly until the solution turned bright yellow, which was centrifuged and washed first with 1 M HCl aqueous solution and then with water for several times until the pH of the mixture was neutral. Finally, the GO slurry was purified by dialysis for a week and dried in vacuum at 60 °C for further use.
2.3. Preparation of GR–Gd(OH)3 nanocomposites
3 mg GO was dispersed in 3 mL water and then ultrasonicated for 1 h. Subsequently, 0.19 mmol Gd(NO3)3 in 5 mL water was dropped slowly. The mixture was stirred for 30 min and 1 M NaOH or concentrated NH3·H2O solution was slowly added until the pH of the solution was 9. Finally 7 mL water was added and the mixture was stirred for 30 min before transferred to 20 mL Teflon-lined stainless steel autoclave. The hydrothermal treatment was conducted at 120 °C for 12 h followed by cooling to ambient temperature naturally. The black precipitate was separated by centrifugation and washed with water. A series of GR–Gd(OH)3 nanocomposites were obtained upon drying. When NaOH was used as a precipitator, the obtained nanocomposites were labeled as GR–Gd(OH)3-1. If the precipitator is NH3·H2O, the nanocomposites were named as GR–Gd(OH)3-2. The content of GR in two kinds of GR–Gd(OH)3 nanocomposites is calculated to be 7 wt%. For comparison, pure Gd(OH)3 was also synthesized at the absence of GO via the same procedure using NaOH as a precipitator.3. Characterization techniques
Powder X-ray diffraction (XRD) was carried out on a Bruker D8 Advance X-ray diffractometer at 40 kV and 40 mA with a Ni-filtered Cu Kα radiation. The Brunauer–Emmett–Teller (BET) surface areas and nitrogen adsorption–desorption isotherms were measured at 77 K on a Quantachrome. The absorption spectra of the nanocomposites dispersed in water were obtained by a UV-vis spectrophotometer (PE Lambda 35). Field-emission scanning electron microscopy (FE-SEM) images were obtained on a JSM-6701F spectrophotometer. Electrochemical measurements were performed on an electrochemical system (CHI-660D, China) in PBS. Bare or modified GCE of 3 mm in diameter was used as the working electrode. Ag/AgCl and Pt wire served as the reference and counter electrode, respectively. GCE were polished with alumina slurry (0.05 and 0.3 mm) on a microcloth and were subsequently rinsed with water and ethanol. Then, the electrodes were further cleaned in ethanol and water with sonication for 5 min to remove any bound particles and finally rinsed with water. The clean electrodes were dried under a gentle nitrogen stream. To prepare the working electrodes, 1 mg of each nanocomposite was dispersed in 1 mL H2O under ultrasonication. Then 10 μL of each suspension was dropped onto the surface of the cleaned GCE and dried at room temperature.4. Results and discussion
4.1. Structure and morphology
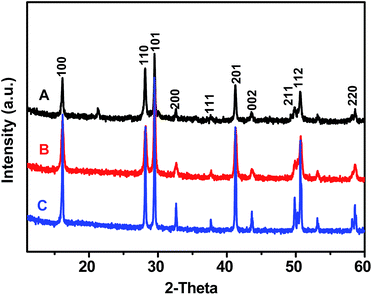
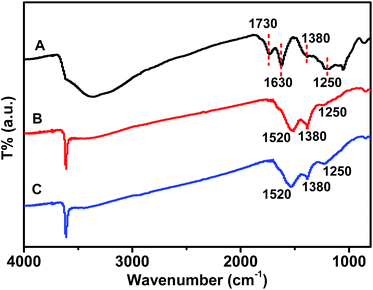
The crystalline properties of Gd(OH)3, GR–Gd(OH)3-1 and GR–Gd(OH)3-2 were examined by XRD as shown in Fig. 1. It is obvious that XRD patterns of all the samples are similar with that of Gd(OH)3, which is known to be a hexagonal phase. This means that the introduction of GR does not change the phase of Gd(OH)3. Instead, it only provides an ideal platform for the formation of Gd(OH)3. It should be noted that the typical peak for the GR is not detected in both GR–Gd(OH)3-1 and GR–Gd(OH)3-2, presumably due to the low content and relatively low diffraction intensity of GR. Similar phenomenon has also been observed in an earlier report.26The existence of GR in the nanocomposites can be demonstrated by FTIR spectra (Fig. 2). The characteristic peaks at 1730, 1630, 1380 and 1250 cm−1 are attributed to the C![[double bond, length as m-dash]](https://www.rsc.org/images/entities/char_e001.gif) O stretching vibrations of the –COOH group, the C
O stretching vibrations of the –COOH group, the C![[double bond, length as m-dash]](https://www.rsc.org/images/entities/char_e001.gif) C stretching mode, the O–H deformation of the C–OH groups and the C–OH stretching peak, respectively.27 Compared to the spectra of GO, the peaks at 1730 cm−1 could not be detected in both GR–Gd(OH)3-1 and GR–Gd(OH)3-2, indicating the successful reduction of GO in the nanocomposites. On the other hand, the peaks from C
C stretching mode, the O–H deformation of the C–OH groups and the C–OH stretching peak, respectively.27 Compared to the spectra of GO, the peaks at 1730 cm−1 could not be detected in both GR–Gd(OH)3-1 and GR–Gd(OH)3-2, indicating the successful reduction of GO in the nanocomposites. On the other hand, the peaks from C![[double bond, length as m-dash]](https://www.rsc.org/images/entities/char_e001.gif) C group shifted from 1630 cm−1 to 1520 cm−1, which is believed to be induced by the mutual interaction between Gd(OH)3 and GR.28–30 That is, Gd(OH)3 nanoparticles are well bounded with GR to form the nanocomposite. The influence of the mutual interaction between Gd(OH)3 and GR on the spectroscopic properties of the nanocomposites can be also detected by UV-vis measurements (Fig. S1†). The spectroscopy of GO in water shows two peaks at about 226 and 300 nm. The former absorption peak can be assigned to π–π* transition of aromatic sp2 domains,31 while the later may be attributed to n–π* transition of the C
C group shifted from 1630 cm−1 to 1520 cm−1, which is believed to be induced by the mutual interaction between Gd(OH)3 and GR.28–30 That is, Gd(OH)3 nanoparticles are well bounded with GR to form the nanocomposite. The influence of the mutual interaction between Gd(OH)3 and GR on the spectroscopic properties of the nanocomposites can be also detected by UV-vis measurements (Fig. S1†). The spectroscopy of GO in water shows two peaks at about 226 and 300 nm. The former absorption peak can be assigned to π–π* transition of aromatic sp2 domains,31 while the later may be attributed to n–π* transition of the C![[double bond, length as m-dash]](https://www.rsc.org/images/entities/char_e001.gif) O band.32 For GR–Gd(OH)3-1 and GR–Gd(OH)3-2, the peaks from π–π* transition have an obvious blue shift to 206 and 209 nm, respectively.
O band.32 For GR–Gd(OH)3-1 and GR–Gd(OH)3-2, the peaks from π–π* transition have an obvious blue shift to 206 and 209 nm, respectively.
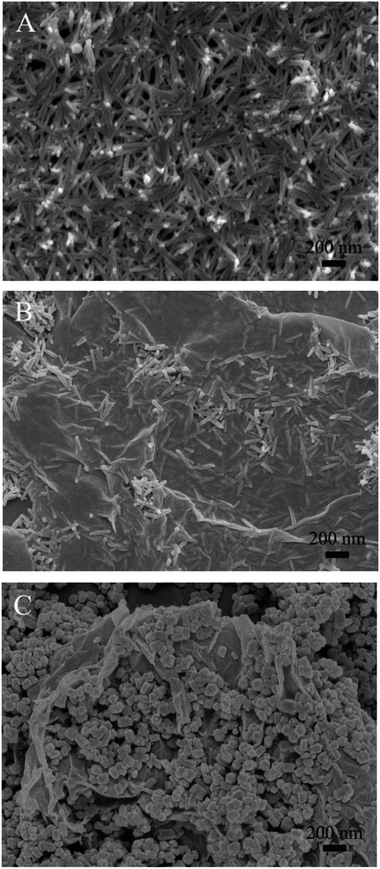
SEM images were taken not only to directly analyze the morphologies of the samples, but also to specifically investigate the influences of the precipitators. Typical images are shown in Fig. 3. It can be observed that both bare Gd(OH)3 (Fig. 3A) and GR–Gd(OH)3-1 (Fig. 3B) are nanorods with big aspect ratios, which suggests that the introduction of GR has no influence on the morphology of Gd(OH)3 nanoparticles. In other words, GR acts as an ideal platform for the formation and growth of Gd(OH)3, with which Gd(OH)3 nanorods interact to hinder the aggregation. Additionally, strong dependences of the morphology of GR–Gd(OH)3 nanocomposites on the precipitator have been found as seen from Fig. 3B and C. When NaOH is used as a precipitator, Gd(OH)3 nanorods with big aspect ratios are dispersed on GR. While with NH3·H2O as a precipitator, the aspect ratios of Gd(OH)3 nanorods decrease and short nanorods formed. The differences between NaOH and NH3·H2O is partially due to the lower hydrolysis rate of NH3·H2O than that of NaOH, which provides basic media for precipitation and is disadvantageous for the formation of Gd(OH)3 nanorods. Another possibility is that NH3·H2O can coordinate with Gd3+ ions to form Gd(NH3)x3+ complexes, which prevents the reaction between Gd3+ and OH− and lowers the growth rate of Gd(OH)3 nanorods. The strong dependence of the nanoparticle morphology on the precipitator has also been observed previously during the preparation of ScOOH/Sc(OH)3 and La(OH)3 nanocrystals.33,34
4.2. Electro-catalytic properties
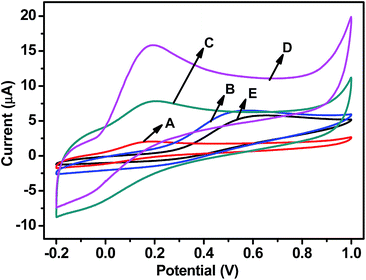
Cyclic voltammetry (CV) was used to investigate the application of GR-based nanocomposites in electrochemical sensors for AA. Fig. 4 shows CV curves for bare and modified GCE at a scan rate of 100 mV s−1 in 0.1 M phosphate buffered saline (PBS, pH = 7.0) at the presence of 0.5 mM AA. It is found that the oxidation currents (ipa) of GCE modified by Gd(OH)3 (GCE/Gd(OH)3), GR–Gd(OH)3-1 (GCE/GR–Gd(OH)3-1) and GR–Gd(OH)3-2 (GCE/GR–Gd(OH)3-2, Fig. 4B–D) are all higher than that of bare GCE (Fig. 4E). However, it is not the case for GCE modified by GR (GCE/GR, Fig. 4A). The low performance of GCE/GR could be ascribed to the poor dispersibility of GR in aqueous solution due to its hydrophobicity. From Fig. 4, it can be also seen that ipa of GCE/GR-Gd(OH)3-1 is higher than that of GCE/Gd(OH)3. This may arise from the following two factors: (i) in GR–Gd(OH)3-1, GR provides a pathway for rapid electron transport due to its high conductivity; (ii) GR–Gd(OH)3-1 possesses a larger surface area than Gd(OH)3 due to the presence of GR. The synergistic effect of the above-mentioned two factors promotes electrochemical reactions and induces an enhancement of ipa. It should also be noticed that compared to GCE/GR–Gd(OH)3-1, the performance of GCE/GR–Gd(OH)3-2 is even better. This suggests GR–Gd(OH)3-2 has the highest electro-catalytic properties. This can be explained by the unique morphology and special surface of GR–Gd(OH)3-2, where short Gd(OH)3 nanorods induce a higher special surface area and improve the electro-catalytic activities. Besides, it is also found that, the oxidation peaks in cases of GR–Gd(OH)3-1 and GR–Gd(OH)3-2 obviously shifted to lower potentials compared to that of Gd(OH)3. This could be ascribed to the morphological changes of the nanocomposites induced by the introduction of GR. On the other hand, the intermolecular forces between the nanocomposite and AA molecules may also play a role.35 Therefore, it is quite predictable and reasonable that oxidation peaks of AA shift when different modified electrodes are used.In order to further understand the electro-catalytic behavior of electrodes with different modifications, electrochemical impedance spectroscopy has been carried out (Fig. S2†). The semicircle portion of the Nyquist plot at high frequencies corresponds to the charge transfer process. The diameter is equal to the charge transfer resistance (Rct), which controls the electron transfer kinetics of the redox probe at the electrode interface. GCE/GR shows the lowest Rct among all the electrodes, which can be ascribed to the high density of edge-plane sites and defects of GR. This feature of GR also leads to a lower Rct of GCE/GR–Gd(OH)3-1 and GCE/GR–Gd(OH)3-2 compared to that of GCE/Gd(OH)3 and bare GCE. It is also noted that Rct of GCE/GR–Gd(OH)3-2 is lower than that of GCE/GR–Gd(OH)3-1, which can be explained by the unique morphology of the GR–Gd(OH)3-2 where Gd(OH)3 nanorods have smaller aspect ratios than those in GR–Gd(OH)3-1. This leads to a higher special surface area of GR–Gd(OH)3-2 which accelerates charge transfer between AA and GCE/GR–Gd(OH)3-2 and lowers the Rct. The result is also consistent with the highest activities of GCE/GR–Gd(OH)3-2 observed from Fig. 4.
Additionally, the effect of AA concentration (cAA) on the CV response of GCE/GR–Gd(OH)3-1 has been investigated under a fixed scan rate of 100 mV s−1. Fig. 5A shows the change of ipa when cAA was increased. A linear relationship between ipa and cAA was found within the concentration range of 0.1–2.5 mM, as shown in Fig. 5B. The resulting calibration plot is a straight line, with a coefficient of 0.998, given by the equation:
| ipa (μA) = 7.34cAA (mM) + 4.61 | (1) |
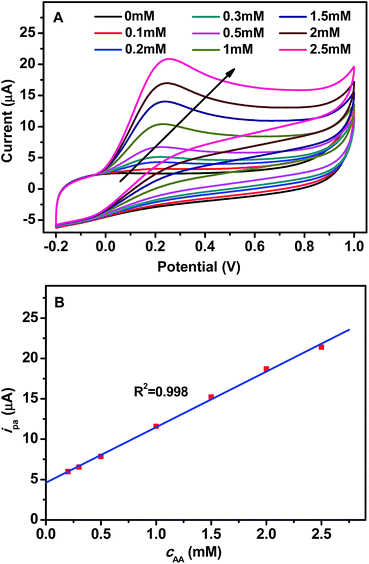 | ||
| Fig. 5 (A) CV of GCE/GR–Gd(OH)3-1 in 0.1 M PBS (pH = 7.0) at varying concentration of AA (0.1–2.5 mM) and (B) relationship between ipa (μA) and cAA (mM). | ||
The lowest limit of detection (LOD) (based on S/N = 3) was found to be 0.06 mM, the detailed calculation can be seen in the ESI.† The sensitivity of the electrode is 103.8 μA mM−1 cm−2. The effect of cAA on the CV response of GCE/GR–Gd(OH)3-2 is shown in Fig. S3,† from which a linear relationship between ipa and cAA can be found within the concentration range of 0.3–2.5 mM. The LOD and the sensitivity of GCE/GR–Gd(OH)3-2 can be calculated to be 0.05 mM and 116.4 μA mM−1 cm−2, respectively. Thus GCE/GR–Gd(OH)3-2 exhibits a lower LOD and a higher sensitivity compared to GCE/GR–Gd(OH)3-1. Furthermore, in order to estimate the reproducibility of the results, three series of experiments were carried out (Fig. S4†) and the relative standard deviation of the current responses of GCE/GR–Gd(OH)3-1 and GCE/GR–Gd(OH)3-2 are 5.7% and 5.1%, respectively, indicating a reproducible fabrication of the GCE/GR–Gd(OH)3-1 and GCE/GR–Gd(OH)3-2 biosensors.
Fig. 6 shows the effect of the scan rates on the electro-catalytic properties of GCE/GR–Gd(OH)3-1 towards AA oxidation. An increase in the scan rate not only leads to a corresponding increase in ipa, but also results in a shift of the anodic peak to more positive potentials (Fig. 6A). In addition, it can be seen that ipa is proportional to the square root of the sweep rate (V1/2) within the investigated range (15–100 mV s−1) (with linear regression coefficient of 0.996) (Fig. 6B), suggesting that the oxidation reaction of AA molecules on GCE/GR–Gd(OH)3-1 is primarily diffusion-controlled. The effect of the scan rate on the electro-catalytic properties of GCE/GR–Gd(OH)3-2 follows similar rules as those observed for GCE/GR–Gd(OH)3-1 (Fig. S5†). Similar results of AA oxidation by an Au/TiO2/Ti electrode have also been reported by Hosseini et al.36 Therefore, it highlights that the structure of GR skeleton provides an ideal morphology for anchoring bioactive molecules, which gives rise to a pathway for rapid mass transfer. Based on all the above results, a proposed oxidation process of AA can be described in Fig. 7. First, AA molecules in solution diffuse to the nearest active sites on GR and are absorbed onto Gd(OH)3 nanorods. Then AA molecules absorbed on the surface of the electrode are oxidized to dehydroascorbic acid:
| C6H8O6(ascorbic acid) − 2e− → C6H6O6(dehydroascorbic acid) + 2H+ |
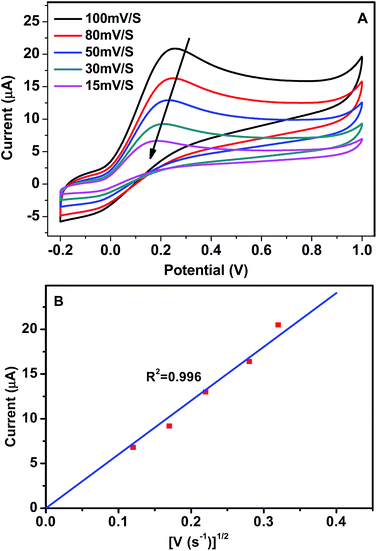 | ||
| Fig. 6 (A) CV of GCE/GR–Gd(OH)3-1 in 2.5 mM AA aqueous solution at varying scan rate (15–100 mV s−1) and (B) the relationship between ipa and V1/2. | ||
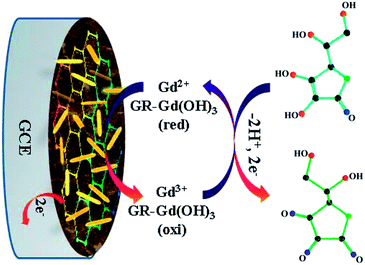 | ||
| Fig. 7 Proposed mechanism for electro-catalytic oxidation of AA on GCE which was pre-modified by GR–Gd(OH)3 hybrid materials. | ||
In order to study the influence of GR on the surface area and porosity of the nanocomposites, the Brunauer–Emmett–Teller (BET) gas adsorption method was performed. BET specific surface area (SBET) and total volume of pores of the samples are listed in Fig. 8 and Table S1.† The nitrogen adsorption–desorption isotherm of Gd(OH)3, GR–Gd(OH)3-1 and GR–Gd(OH)3-2 all exhibits type II, which indicates the presence of mesoporous materials according to the IUPAC classification.37 A narrow pore size distribution with an averaged pore diameter of 30 nm was recorded, as displayed in the inset of Fig. 8A–C. The results suggest the addition of GR did not change the nitrogen adsorption–desorption isotherm. However, SBET and total volume of pores of GR–Gd(OH)3-1 and GR–Gd(OH)3-2 has dramatically increased compared to that of Gd(OH)3. In addition, compared with GR–Gd(OH)3-1, SBET and total volume of pores of GR–Gd(OH)3-2 gradually increase from 18.02 m2 g−1 to 32.38 m2 g−1 and from 0.36 cm3 g−1 to 0.41 cm3 g−1, respectively. Here, we speculate that the enhancement in SBET and total volume of pores induced by the introduction of GR is the most important reason that GR–Gd(OH)3-2 possesses the highest electron-catalytic activity among all samples.
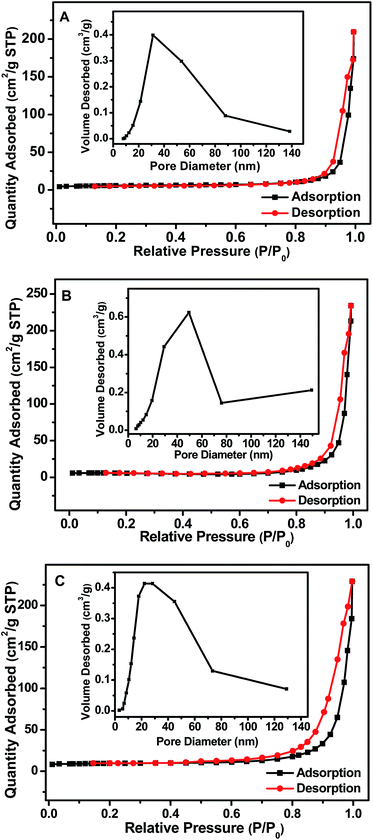 | ||
| Fig. 8 Brunauer–Emmett–Teller specific surface area of Gd(OH)3 (A), GR–Gd(OH)3-1 (B) and GR–Gd(OH)3-2 (C). | ||
5. Conclusions
In summary, by selecting different precipitators, GR–Gd(OH)3 nanocomposites with different morphologies have been successfully prepared by a facile hydrothermal method. When NaOH is used as a precipitator, Gd(OH)3 nanorods with big aspect ratios are dispersed on GR (GR–Gd(OH)3-1). When NH3·H2O is selected, however, short Gd(OH)3 nanorods with decreased aspect ratios formed (GR–Gd(OH)3-2). GR–Gd(OH)3-2 shows superior electrical chemical properties to Gd(OH)3 and GR–Gd(OH)3-1 due to its high surface area. The oxidation current of AA on GCE/GR–Gd(OH)3-1 has a linear relationship with cAA in the range of 0.1–2.5 mM and the oxidation reaction of AA molecules on GCE/GR–Gd(OH)3-1 is a primary diffusion-controlled process. It is expected that our work can convey a new promising platform for the application of GR-based rare earth hybrid materials in biosensing. Furthermore, the facile methods could also be extended to other GR-based, rare earth-containing nanocomposites with different morphologies.Acknowledgements
This work was financially supported by the Hundred Talents Program of Chinese Academy of Sciences (Y20245YBR1) and National Natural Science Foundation of China (no. 21402215).References
- Y. Shao, J. Wang, H. Wu, J. Liu, I. A. Aksay and Y. Lin, Electroanalysis, 2010, 22, 1027–1036 CrossRef CAS.
- X. Huang, Z. Zeng, Z. Fan, J. Liu and H. Zhang, Adv. Mater., 2012, 24, 5979–6004 CrossRef CAS PubMed.
- F. Zhang, J. Tang, Z. Wang and L. Qin, Chem. Phys. Lett., 2013, 590, 121–125 CrossRef CAS PubMed.
- X. Huang, X. Qi, F. Boey and H. Zhang, Chem. Soc. Rev., 2012, 41, 666–686 RSC.
- P. Manivel, M. Dhakshnamoorthy, A. Balamurugan, N. Ponpandian, D. Mangalaraj and C. Viswanathan, RSC Adv., 2013, 3, 14428–14437 RSC.
- X. Pan, Y. Zhao, S. Liu, C. L. Korzeniewski, S. Wang and Z. Fan, ACS Appl. Mater. Interfaces, 2012, 4, 3944–3950 CAS.
- S. V. Dliseeva and J.-C. G. Buenzli, Chem. Soc. Rev., 2010, 39, 189–227 RSC.
- Y. Liu, D. Tu, H. Zhu and X. Chen, Chem. Soc. Rev., 2013, 42, 6924–6958 RSC.
- M. C. Heffern, L. M. Matosziuk and T. J. Meade, Chem. Rev., 2014, 114, 4496–4539 CrossRef CAS PubMed.
- V. Parashar and A. C. Pandey, Anal. Methods, 2010, 2, 1227–1229 RSC.
- G. J. Xing, Q. Y. Guo, Q. J. Liu, Y. L. Li, Y. Wang, Z. L. Wu and G. M. Wu, Ceram. Int., 2014, 40, 6569–6577 CrossRef CAS PubMed.
- S. Liu, Y. Cai, X. Cai, H. Li, F. Zhang, Q. Mu, Y. Liu and Y. Wang, Appl. Catal., A, 2013, 453, 45–53 CrossRef CAS PubMed.
- Z. Yan and C. Yan, J. Mater. Chem., 2008, 18, 5046–5059 RSC.
- R. Si, Y. Zhang, H. Zhou, L. Sun and C. Yan, Chem. Mater., 2006, 19, 18–27 CrossRef.
- Y. Yoon, B. Lee, K. S. Lee, G. H. Im, S. Byeon, J. H. Lee and I. S. Lee, Adv. Funct. Mater., 2009, 19, 3375–3380 CrossRef CAS.
- X. Wang and Y. Li, Angew. Chem., Int. Ed., 2002, 41, 4790–4793 CrossRef CAS PubMed.
- G. Jia, K. Liu, Y. Zheng, Y. Song, M. Yang and H. You, J. Phys. Chem. C, 2009, 113, 6050–6055 CAS.
- X. Wang and Y. Li, Chem.–Eur. J., 2003, 9, 5627–5635 CrossRef CAS PubMed.
- S. B. Khoo and F. Chen, Anal. Chem., 2002, 74, 5734–5741 CrossRef CAS.
- K. Deng, J. Zhou and X. Li, Electrochim. Acta, 2013, 114, 341–346 CrossRef CAS PubMed.
- C. Zhou, S. Li, W. Zhu, H. Pang and H. Ma, Electrochim. Acta, 2013, 113, 454–463 CrossRef CAS PubMed.
- Y. Ma, M. Zhao, B. Cai, W. Wang, Z. Ye and J. Huang, Biosens. Bioelectron., 2014, 59, 384–388 CrossRef CAS PubMed.
- G. Hu, Y. Guo, Q. Xue and S. Shao, Electrochim. Acta, 2010, 55, 2799–2804 CrossRef CAS PubMed.
- H. Li, Y. Wang, D. Ye, J. Luo, B. Su, S. Zhang and J. Kong, Talanta, 2014, 127, 255–261 CrossRef CAS PubMed.
- H. Tetsuka, R. Asahi, A. Nagoya, K. Okamoto, I. Tajima, R. Ohta and A. Okamoto, Adv. Mater., 2012, 24, 5333–5338 CrossRef CAS PubMed.
- H. Zhang, X. Lv, Y. Li, Y. Wang and J. Li, ACS Nano, 2009, 4, 380–386 CrossRef PubMed.
- X. D. Wang, N. L. Zhou, J. Yuan, W. Y. Wang, Y. D. Tang, C. Y. Lu, J. Zhang and J. Shen, J. Mater. Chem., 2012, 22, 1673–1678 RSC.
- J. Guo, S. Zhu, Z. Chen, Y. Li, Z. Yu, Q. Liu, J. Li, C. Feng and D. Zhang, Ultrason. Sonochem., 2011, 18, 1082–1090 CrossRef CAS PubMed.
- W. Wei, T. C. He, X. Teng, S. X. Wu, L. Ma, H. Zhang, J. Ma, Y. H. Yang, H. Y. Chen, Y. Han, H. D. Sun and L. Huang, Small, 2012, 8, 2271–2276 CrossRef CAS PubMed.
- X. Zhang, X. Yang, Y. Ma, Y. Huang and Y. Chen, J. Nanosci. Nanotechnol., 2010, 10, 2984–2987 CrossRef CAS PubMed.
- D. Y. Pan, J. C. Zhang, Z. Li and M. H. Wu, Adv. Mater., 2010, 22, 734–738 CrossRef CAS PubMed.
- J. Peng, W. Gao, B. K. Gupta, Z. Liu, R. Romero-Aburto, L. Ge, L. Song, L. B. Alemany, X. Zhan, G. Gao, S. A. Vithayathil, B. A. Kaipparettu, A. A. Marti, T. Hayashi, J. J. Zhu and P. M. Ajayan, Nano Lett., 2012, 12, 844–849 CrossRef CAS PubMed.
- Y. Zhang, J. Liu, R. Si, Z. Yan and C. Yan, J. Phys. Chem. B, 2005, 109, 18324–18331 CrossRef CAS PubMed.
- G. Li, C. Li, Z. Xu, Z. Cheng and J. Lin, CrystEngComm, 2010, 12, 4208–4216 RSC.
- J. Xie, Q. Wu, D. Zhang and Y. Ding, Cryst. Growth Des., 2009, 9, 3889–3897 CAS.
- M. G. Hosseini, M. Faraji and M. M. Momeni, Thin Solid Films, 2011, 519, 3457–3461 CrossRef CAS PubMed.
- K. S. W. Sing, D. H. Everett, R. A. W. Haul, L. Moscou, R. A. Pierotti, J. Rouquérol and T. Siemieniewska, Pure Appl. Chem., 1985, 57, 603–619 CrossRef CAS.
Footnote |
| † Electronic supplementary information (ESI) available: UV-vis spectra of GO, GR–Gd(OH)3-1 and GR–Gd(OH)3-2, EIS of GR, GCE/Gd(OH)3, GCE/GR–Gd(OH)3-1, GCE/GR–Gd(OH)3-2 and bare GCE in 0.1 M PBS-0.5 mM AA aqueous solution, CV of GCE/GR–Gd(OH)3-2 in 0.1 M PBS (pH = 7) at varying concentration of AA, CV of GCE/GR–Gd(OH)3-1 and GCE/GR–Gd(OH)3-2 in 0.1 M PBS with 0.5 mM AA at 100 mV s−1, CV of GCE/GR–Gd(OH)3-2 in 2.5 mM AA aqueous solution at varying scan rate (15–100 mV s−1). BET surface area (SBET) and total pore volume of Gd(OH)3, GR–Gd(OH)3-1 and GR–Gd(OH)3-2. See DOI: 10.1039/c5ra00064e |
| This journal is © The Royal Society of Chemistry 2015 |

