
Identification and analysis of the currently available high-confidence three-dimensional activity cliffs
Norbert Furtmannab,
Ye Hua,
Michael Gütschowb and
Jürgen Bajorath*a
aDepartment of Life Science Informatics, B-IT, LIMES Program Unit Chemical Biology and Medicinal Chemistry, Rheinische Friedrich-Wilhelms-Universität, Dahlmannstr. 2, D-53113 Bonn, Germany. E-mail: bajorath@bit.uni-bonn.de; Fax: +49-228-2699-341; Tel: +49-228-2699-306
bPharmaceutical Institute, University of Bonn, An der Immenburg 4, D-53121 Bonn, Germany
First published on 7th May 2015
Abstract
Three-dimensional activity cliffs (3D-cliffs) were determined on the basis of the X-ray structures of protein–ligand complexes currently available in the Protein Data Bank (PDB). For a given target, all the bound small molecular ligands were compared in a pairwise manner and ligand pairs with at least 80% 3D similarity of their binding modes and an at least 100-fold difference in potency were identified and classified as 3D-cliffs. Only high-confidence activity data were considered. All the 3D-cliffs were subjected to visual inspection and categorized according to ligand–target interaction differences. In addition, relationships between 3D-cliffs were systematically explored. Compared to a previous survey, in which 216 3D-cliffs were detected, the current study identified a total of 630 3D-cliffs that involved 580 unique ligands with activity against 61 human targets belonging to 25 families. Thus, over the past few years, there has been significant growth in high-confidence activity cliff information at the structural level. Notable increases in the number of 3D-cliffs were observed for a number of different targets, in particular, proteases. The pool of currently available 3D-cliffs provides a rich source of information for structure–activity relationship (SAR) analysis and structure-based design.
Introduction
Pairs or groups of structurally similar compounds with large potency differences are defined as activity cliffs.1–3 The activity cliff concept is popular in medicinal chemistry because cliffs reveal small chemical changes leading to significant potency variation and thus often identify structure–activity relationship (SAR) determinants.2,3 For a systematic analysis of activity cliffs, potency difference and molecular similarity criteria must be defined.2,3 While activity cliffs have mostly been studied on the basis of molecular graph similarity3,4 or structural relationships encoded by matched molecular pairs,5 they can also be interpreted with the aid of 3D structures.6 Moreover, activity cliffs can be derived from 3D structures on the basis of molecular comparisons and 3D similarity assessments. This might be done using computationally modeled compound conformations4 or protein–ligand complexes. From structures of complexes, be they modeled or experimentally determined, 3D-cliffs might be extracted with the aid of interaction fingerprints7 or on the basis of ligand binding mode comparisons.8,9 3D-cliffs derived from X-ray structures are thought to be particularly useful for SAR exploration or structure-based design, as they are directly based on experimental data. For sets of exemplary 3D-cliffs with highly similar binding modes, molecular graph-based similarity calculations were carried out for comparison and it was shown that only less than half of these 3D-cliffs were reproduced using 2D representations and similarity measures.8 Hence, pharmacophore and binding mode resemblance was difficult to reconcile on the basis of whole-molecule 2D similarity calculations, as one might expect. Accordingly, 3D-cliffs add another layer of information to 2D activity cliff analysis. In a first systematic survey of activity cliffs encoded by complex X-ray structures available in the Protein Data Bank,10,11 reported in 2012,9 a total of 216 3D-cliffs were identified that involved 269 crystallographic ligands of 38 different targets.9Given the rapid growth of structural and activity data, we were interested in further extending the analysis to determine whether there has been an increase in 3D-cliff information over time that would further substantiate the structural knowledge base for SAR analysis. In addition, for the initial analysis of 3D-cliffs, all activity measurements available at that time had to be taken into consideration, regardless of their specific confidence levels, and combined to ensure that activity data could be obtained for a sufficient number of crystallographic ligands. By contrast, given the nearly exponential growth in compound activity data over the past few years, we were able to focus our current analysis exclusively on high-confidence activity, which provided an additional motivation. Therefore, we have mapped high-confidence activity data to all currently available X-ray structures of protein–small molecule complexes and identified 3D-cliffs through systematic binding mode comparisons. The analysis yielded an unexpectedly large number of 3D-cliffs that were analyzed in detail and categorized. All 3D-cliffs and associated information are made freely available.
Material and methods
Collection of complex X-ray structures and curation of ligands
To systematically collect structures of protein–ligand complexes, UniProt12 accession IDs (UniProtIDs) were assembled for all human targets for which compounds with high-confidence activity annotations were available in ChEMBL (release 19).13 In total, 152![[thin space (1/6-em)]](https://www.rsc.org/images/entities/char_2009.gif) 342 compounds were reported to be active against 1436 targets with well-defined equilibrium constants (i.e., Ki values) and/or IC50 measurements, representing highest ChEMBL confidence levels.14 As a result, 1436 unique UniProtIDs of human targets were obtained to query in the PDB. Only X-ray structures with a crystallographic resolution of at least 3.0 Å were considered. Furthermore, specific criteria were defined to curate ligands from the initial pool of 11301 complex structures. First of all, complexes were only retained if the corresponding ligands were annotated with explicitly defined Ki and/or IC50 measurements. Ligands without potency measurements or with approximate annotations such as “>”, “<”, or “∼” relations were removed. If multiple Ki or IC50 values of a ligand from different data sources and/or experiments were available that fell within one order of magnitude, the geometric mean was calculated as the final potency annotation for the compound. Otherwise, the ligand and corresponding complex were disregarded. In addition, duplicate complexes, structures containing only ionic ligands, and very small compounds that consisted of less than 10 non-hydrogen atoms were excluded from further consideration. Accordingly, 3083 complex structures that contained ligands with curated high-confidence potency annotations for 340 human targets remained for further analysis. The workflow of data collection and curation is summarized in Fig. 1.
342 compounds were reported to be active against 1436 targets with well-defined equilibrium constants (i.e., Ki values) and/or IC50 measurements, representing highest ChEMBL confidence levels.14 As a result, 1436 unique UniProtIDs of human targets were obtained to query in the PDB. Only X-ray structures with a crystallographic resolution of at least 3.0 Å were considered. Furthermore, specific criteria were defined to curate ligands from the initial pool of 11301 complex structures. First of all, complexes were only retained if the corresponding ligands were annotated with explicitly defined Ki and/or IC50 measurements. Ligands without potency measurements or with approximate annotations such as “>”, “<”, or “∼” relations were removed. If multiple Ki or IC50 values of a ligand from different data sources and/or experiments were available that fell within one order of magnitude, the geometric mean was calculated as the final potency annotation for the compound. Otherwise, the ligand and corresponding complex were disregarded. In addition, duplicate complexes, structures containing only ionic ligands, and very small compounds that consisted of less than 10 non-hydrogen atoms were excluded from further consideration. Accordingly, 3083 complex structures that contained ligands with curated high-confidence potency annotations for 340 human targets remained for further analysis. The workflow of data collection and curation is summarized in Fig. 1.
 | ||
| Fig. 1 Data collection and curation. The flow chart illustrates how X-ray structures of protein–small molecule complexes were systematically extracted from the Protein Data Bank and further curated and how potency measurement-dependent data sets were organized. Abbreviation: 1OoM, one order of magnitude. | ||
Potency-based data set organization
Of all 3083 X-ray structures, 887 and 1980 complexes were annotated only with Ki and IC50 values, respectively. For ligands in the remaining 216 complexes, both Ki and IC50 measurements were available. Accordingly, three potency measurement-dependent data sets were generated, i.e., two sets that contained complexes exclusively annotated with Ki or IC50 values and a set in which Ki and IC50 values were combined. Complexes for which both Ki and IC50 values available were assigned to both sets using the respective measurement as well as to the combined set (i.e., Ki/IC50), but only if their values fell within one order of magnitude. As a consequence, 40 of 216 complexes with both Ki and IC50 values were removed from the Ki/IC50 set, because the respective potency annotations differed by more than one order of magnitude. We note that (assay-independent) Ki and (assay-dependent) IC50 values can in principle not be directly compared (although their comparison might often be sufficiently accurate for cliff assignment, given the large potency differences that are required). The combined Ki/IC50 set was assembled to extend the 3D-cliff population for further analysis, in addition to the separate Ki and IC50 sets. Taken together, there were 1103, 2196, and 3043 complexes available in the Ki, IC50, and Ki/IC50 sets, respectively. These complexes involved 204, 278, and 337 targets, respectively, as listed in Fig. 1.3D similarity
A previously reported 3D similarity function15,16 was applied to quantify the similarity of ligand binding modes using property density functions taking conformational, positional, and atomic property differences into account. This 3D similarity function was used for previous binding mode-based assessments of 3D-cliffs and the first survey of the PDB.8,9 For similarity calculations on binding modes, protein structures of the same target in complex with different ligands were optimally superposed using the structure alignment function of the Molecular Operating Environment (MOE).16 The resulting ligand superpositions were then analyzed and the normalized overlap of property density functions calculated for a pair of crystallographic ligands was used as a measure of 3D similarity.15 Each ligand atom was represented by a spherically symmetric Gaussian density function centered at the position of its nucleus with a width determined by the van der Waals radius of the atom. A global density function was then calculated as the sum of density functions for different properties of all atoms of a ligand. Atomic Gaussian functions were weighted relative to selected atom properties. The atomic property density weight was set to 1 if the respective atom contained the property and to 0 if the property was absent. Four atomic properties were considered: aromatic character, hydrogen bond acceptor potential, hydrogen bond donor potential, and hydrophobic character. The overlap of the property density functions of two binding modes was determined as the sum of the individual property density functions:F(X, Y): overlap of property density functions of conformations X and Y; X, Y: matrices of spatial atom coordinates for the two molecules with dimension 3 × m and 3 × n, respectively; m, n: numbers of atoms in molecules X and Y, respectively; xi: vector of coordinates of atom i in conformation X; wpi: weight of atom i with respect to property p, wpi = 1 if atom i has property p, otherwise wpi = 0; a: scaling factor, set to 2 in our calculations; ri: van der Waals radius of atom i.

Atomic properties were calculated using MOE according to the following definitions: waromatici = 1 if atom i is in a ring satisfying the Hückel rule and is sp2 hybridized, wdonori = 1 if atom i is in pharmacophore class “donor” or in class “base”, wacceptori = 1 if atom i is in pharmacophore class “acceptor” or in class “acid”, whydrophobici = 1 if atom i is in pharmacophore class “hydrophobe”.
A normalization procedure was applied to obtain 3D similarity values between 0 and 1. Therefore, the overlap of the property density functions was divided by the mean self-overlap of the ligand binding modes:

Activity cliff criteria
As 3D-cliff criteria, a 3D similarity threshold for binding mode comparison of at least 0.8 (i.e., 80% 3D similarity) and a potency difference of at least two orders of magnitude (100-fold) were required. Ligand pairs meeting the 80% 3D similarity threshold are referred to in the following as “qualifying pairs”. Potency differences were determined on the basis of Ki and/or IC50 measurements. These criteria were consistently applied in our analysis. All identified 3D-cliffs were subjected to visual inspection to rule out potential superposition artifacts. Following confirmatory inspection, interaction differences between ligands were determined to generate a categorization of 3D-cliffs.Categorization of 3D-cliffs
For superposed complexes representing 3D-cliffs, differences in crystallographic ligand–target interactions were analyzed using MOE and 3D-cliffs were assigned to six categories.(1) H-bond and/or ionic interactions: only differences in hydrogen bond patterns were observed.
(2) Lipophilic/aromatic groups: only differences in interactions involving lipophilic/aromatic substituents were detected including shape complementarity between ligands and the binding site (in hydrophobic pockets or other regions).
(3) Water molecules: only differences in crystallographic water positions and/or water-mediated hydrogen bonds were observed.
(4) Stereochemistry: ligands were stereoisomers leading to differences in shape complementarity.
(5) Multiple effects: differences included several types of interactions described above.
(6) No apparent interaction differences: no interaction differences were obvious (no possible structural rationale was available for the formation of a 3D-cliff).
Network representations
Relationships between 3D-cliffs in different potency measurement-dependent data sets were analyzed using network representations. In activity cliff networks generated for our analysis, nodes represent ligands and are color-coded according to their potency values using a continuous color spectrum. Furthermore, edges indicate 3D-cliffs. In network analysis, 3D-cliffs that were formed in “isolation” (i.e., as individual pairs in the absence of other ligands with similar binding modes) or in a “coordinated” manner17,18 were distinguished. Coordinated activity cliffs are formed by series of structurally similar compounds as multiple and overlapping cliffs that give rise to the formation of activity cliff clusters in network representations.18 Networks were drawn with Cytoscape.19Results and discussion
X-ray structures, ligands, and activity data
On the basis of the data selection and curation criteria summarized in Fig. 1, 1103, 2196 and 3043 qualifying complexes were obtained that involved 204, 278 and 337 targets in the Ki, IC50, and Ki/IC50 value-based sets, respectively. Thus, compared to the Ki set, the number of complexes comprising the IC50 set nearly doubled. In total, more than 3000 unique complex structures with high-confidence activity data were available to search for 3D-cliffs.Fig. 2a reports the crystallographic resolution of X-ray structures in different data sets, revealing similar distributions. More than 75% of the complex structures were available at 2.5 Å or higher resolution and nearly half at 2.0 Å or higher resolution. The potency value distribution of bound ligands is shown in Fig. 2b. Compounds in all three sets displayed a wide potency range. However, the majority of potency values fell into the logarithmic range between 6 and 10 (i.e., ≤ 1 μM and ≥ 0.1 nM) including 842, 1616, and 2262 ligands in the Ki, IC50,and Ki/IC50 sets, respectively.
 | ||
| Fig. 2 Crystallographic resolution and potency distribution. The distribution of (a) crystallographic resolution and (b) potency values is reported in box plots for complexes from the Ki (red), IC50 (blue), and Ki/IC50 (green) value-based data sets, respectively. Each box plot reports the smallest value (bottom line), lower quartile (lower boundary of the box), median value (thick line), upper quartile (upper boundary of the box), and the largest value (top line). For each set, the corresponding number of complex structures is given in parentheses. | ||
Furthermore, the distribution of complex structures over individual targets is reported in Fig. 3. For 82 (∼40%; Ki set), 98 (∼35%; IC50) and 112 (∼33%; Ki/IC50) targets, only one complex structure was available. For the remaining 122, 180, and 225 targets, multiple complexes were available, for which pairwise comparisons of ligand binding modes were carried out to search for 3D-cliffs. Moreover, for three, five, and 10 targets, more than 50 complex structures were available in the Ki, IC50, and Ki/IC50 sets, respectively. Not surprisingly, these proteins represented intensely explored and well-characterized therapeutic targets including, among others, thrombin, coagulation factor Xa, carbonic anhydrase II, beta-secretase 1, heat shock protein 90-alpha, and cyclin-dependent kinase 2.
 | ||
| Fig. 3 Distribution of complex structures over targets. Shown is the percentage of targets with increasing number of complex X-ray structures for the Ki, IC50, and Ki/IC50 sets. | ||
3D-cliffs
For each of 122 (Ki set), 180 (IC50), and 225 (Ki/IC50) targets, for which multiple complexes were available, ligand binding modes were compared in a pairwise manner. A total of 18914, 43371, and 76985 possible ligand pairs were available for the Ki, IC50, and Ki/IC50 sets, respectively. The distribution of their 3D similarity values and potency differences is reported in Fig. 4. As shown in Fig. 4a, the median 3D similarity value was ∼0.5. More than 75% of the ligand pairs yielded similarity values of 0.65 or lower. Hence, in light of this distribution, our pre-defined 0.80 3D similarity cut-off represented a high degree of binding mode similarity, consistent with earlier findings,9 and a stringent criterion for 3D-cliff formation. Accordingly, only 1302, 2473, and 4101 pairs of ligands in the Ki, IC50, and Ki/IC50 sets, respectively, reached the similarity threshold for 3D-cliff formation (Table 1). In addition, all potency comparisons are reported in Fig. 4b. The majority of ligands in pairs differed by less than two orders of magnitude in potency (and thus did not qualify as cliffs).
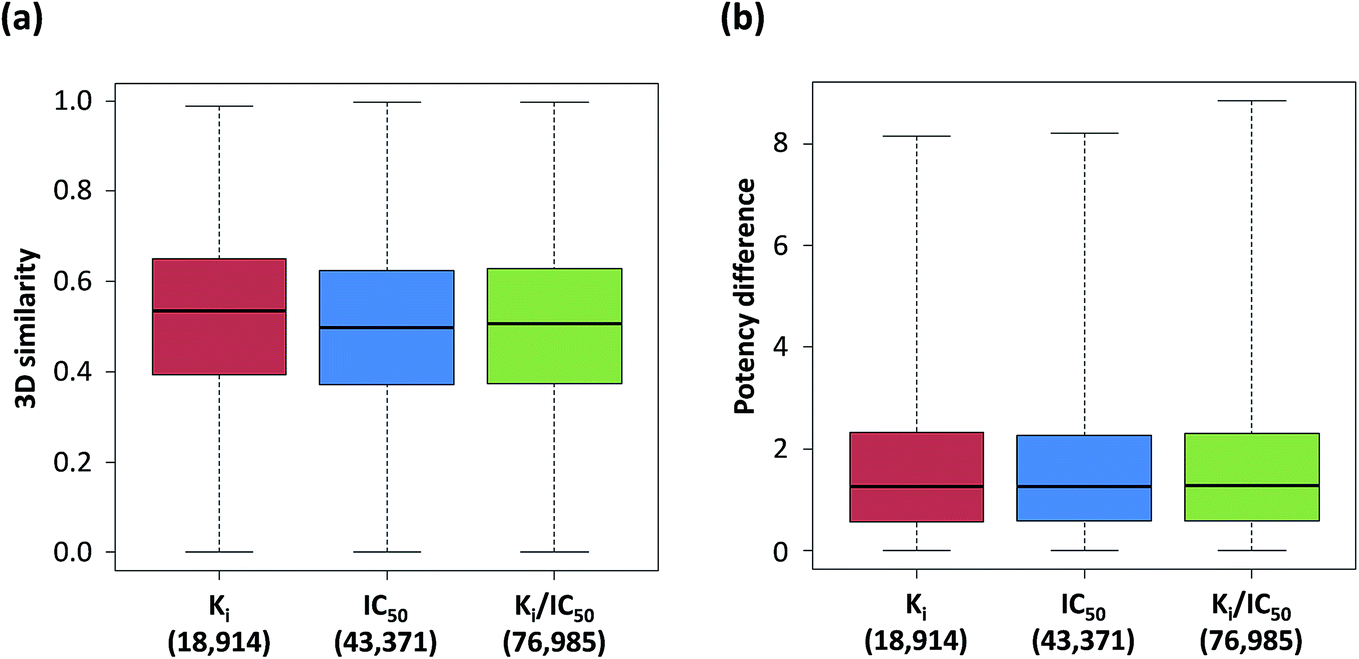 | ||
| Fig. 4 3D similarities and potency differences. The distribution of (a) 3D similarity values and (b) potency differences is reported in box plots (represented as in Fig. 2) for all pairs of ligands from the Ki, IC50, and Ki/IC50 sets active against the same target. For each set, the total number of ligand pairs is given in parentheses. | ||
| Number of (%) | Ki | IC50 | Ki/IC50 |
|---|---|---|---|
| a The number of qualifying ligand pairs that yielded 3D similarity values ≥ 0.80, 3D-cliffs (including coordinated and isolated cliffs), cliff forming ligands, and targets with 3D-cliffs is reported for the Ki, IC50, and Ki/IC50 sets, respectively. | |||
| Qualifying pairs | 1302 | 2473 | 4101 |
| 3D-cliffs | 236 (18.1%) | 292 (11.8%) | 595 (14.5%) |
| Coordinated cliffs | 208 | 242 | 525 |
| Isolated cliffs | 28 | 50 | 70 |
| 3D-cliff forming ligands | 163 | 336 | 559 |
| Targets with 3D-cliffs | 26 | 43 | 58 |
On the basis of our 3D-cliff criteria, a total of 236, 292, and 595 3D-cliffs were identified that involved 163, 336, and 559 ligands of 26, 43, and 58 targets for the Ki, IC50 and Ki/IC50 sets, respectively (Table 1).
Network analysis
The 3D-cliffs were visualized in network representations, as shown in Fig. 5. The networks monitored if crystallographic ligands were involved in the formation of multiple activity cliffs. Different network topologies became apparent for individual data sets. The network for the Ki set consisted of a large central component and small clusters of 3D-cliffs. By contrast, the network for the IC50 set contained several medium size clusters and no single large cliff cluster. However, a common finding was that the majority of 3D-cliffs were formed in a coordinated way. As reported in Table 1, only 28 (Ki), 50 (IC50), and 70 (Ki/IC50) 3D-cliffs were formed as isolated cliffs. These findings based on 3D similarity assessment paralleled observations made for activity cliffs assessed on the basis of 2D representations where the vast majority of cliffs was found to be formed in a coordinated manner.17 | ||
| Fig. 5 3D-cliff networks. Shown are 3D-cliff network representations for the (a) Ki, (b) IC50, and (c) Ki/IC50 value-based data sets, respectively. Nodes represent 3D ligands that are color-coded according to their potency values using a continuous color spectrum from white (lowest potency in the set) to a dark color (highest potency; Ki, red; IC50, blue; Ki/IC50, green). Edges indicate 3D-cliffs. | ||
For 3D-cliffs, it was found that 53% to 63% of the X-ray ligands only formed a single cliff. By contrast, 13 (Ki set), eight (IC50), and 25 (Ki/IC50) ligands were involved in the formation of more than five 3D-cliffs.
Categorization of 3D-cliffs
All 3D-cliffs were assigned to six previously defined categories,9 as reported in Table 2. These categories accounted for specific interaction differences between cliff partners that were apparent in X-ray structures. Hence, categories 1–5 provided possible structural rationales for cliff formation. For category 6, no interaction difference was apparent that might provide plausible reasons for potency differences between bound ligands (thus, in these cases cliff formation must be due to other reasons such as entropic effects). The distribution of 3D-cliffs over categories was comparable but slightly different for the potency measurement-dependent data sets. For 23.7% to 33.6% of the 3D-cliffs (Table 2), ligands displayed well-defined differences in hydrogen bonding and/or ionic interactions with their targets (category 1). In addition, for approximately 40% of the 3D-cliffs, interaction differences between cliff partners involved lipophilic or aromatic groups (category 2), representing the largest category in all three data sets (differences in aromatic/lipophilic interactions often translate into large hydration-associated entropic effects). By contrast, there were only one (Ki), 10 (IC50), and 14 (Ki/IC50) 3D-cliffs in which cliff partners were exclusively distinguished by water-mediated hydrogen bonds (category 3). Also, only two (Ki), two (IC50), and three (Ki/IC50) cliffs were found in which stereoisomers displayed different degrees of shape complementarity with the binding site (category 4). For 13.0% to 22.9% of the 3D-cliffs, ligands were distinguished by multiple types of interactions (category 5). Finally, for nearly 10% of 3D-cliffs, only very subtle or no apparent interaction differences were detected (category 6). Thus, taken together, pairs of ligands with well-defined differences in aromatic/lipophilic interactions or hydrogen bond patterns were prevalent among the 3D-cliffs, hence providing many hypotheses for (computational and/or experimental) follow-up investigations to rationalize or predict such effects. Representative 3D-cliffs belonging to different categories and their structural environments are depicted in Fig. 6.| Cliff category | Number of 3D-cliffs (%) | ||
|---|---|---|---|
| Ki | IC50 | Ki/IC50 | |
| a For each 3D-cliff category (see Methods), the number (percentage) of cliffs is given for the Ki, IC50, and Ki/IC50 sets, respectively. | |||
| 1. H-bond and/or ionic interactions | 56 (23.7%) | 98 (33.6%) | 176 (29.6%) |
| 2. Lipophilic/aromatic groups | 100 (42.4%) | 117 (40.1%) | 236 (39.7%) |
| 3. Water molecules | 1 (0.4%) | 10 (3.4%) | 14 (2.4%) |
| 4. Stereochemistry | 2 (0.8%) | 2 (0.7%) | 3 (0.5%) |
| 5. Multiple effects | 54 (22.9%) | 38 (13.0%) | 101 (17.0%) |
| 6. No apparent interaction differences | 23 (9.7%) | 27 (9.2%) | 65 (10.9%) |
 | ||
| Fig. 6 Representative 3D-cliffs. In (a)–(f), examples of 3D-cliffs are shown that represent category 1–6 (according to Table 2). For each cliff, the ligand with higher potency is colored in cyan and the ligand with lower potency in magenta (PDB identifiers and potency values are reported). Hydrogen bonds are indicated by dashed light blue lines. Major interactions distinguishing cliff partners are encircled (red). | ||
3D-cliffs and their targets
The distribution of 3D-cliffs over targets is reported in Fig. 7. Of all 26 (Ki), 43 (IC50), and 58 (Ki/IC50) targets, for which 3D-cliffs were detected, 12 (Ki), nine (IC50), and 10 (Ki/IC50) targets were only associated with a single cliff. For most of the remaining targets, two to five 3D-cliffs were detected. Two (Ki), seven (IC50), and 12 (Ki/IC50) targets were found to have 10 or more 3D-cliffs, as reported in Table 3. Most of these targets belonged to subfamilies of proteases and protein kinases. A rather unexpected finding was that thrombin inhibitors yielded by far the largest number of 3D-cliffs, with 158 and 166 cliffs for the Ki and Ki/IC50 set, respectively. These cliffs corresponded to 66.9% and 27.9% of the entire 3D-cliff populations (and formed the largest clusters in the corresponding activity cliff networks). Globally, 11.8% to 18.1% of all qualifying ligand pairs formed 3D-cliffs. For thrombin inhibitors, the frequency was significantly higher, with 37.9% (Ki) and 34.9% (Ki/IC50) of qualifying ligand pairs. In addition, although there was a much smaller number of complex structures available for leukotriene A4 hydrolase, comparably high cliff rates were observed for the IC50 (35.2%) and Ki/IC50 (37.8%) sets. By contrast, less than 7% of pairs of coagulation factor Xa inhibitors formed 3D-cliffs, although large numbers of complex structures and qualifying pairs were available. Overall, there was no apparent correlation between the number of available complex structures or qualifying ligand pairs and the number of 3D-cliffs. For the top targets, cliff categories are reported in Table 3. No target was found to be associated with 3D-cliffs belonging to all six categories. However, these targets displayed different cliff category preferences. For thrombin inhibitors, the large number of 3D-cliffs predominantly revealed differences in aromatic–lipophilic interactions (category 2). Heat shock protein 90-alpha and leukotriene A4 hydrolase inhibitors formed comparable numbers of 3D-cliffs, albeit with opposite category distribution. Inhibitors in nearly all leukotriene A4 hydrolase 3D-cliffs were distinguished by hydrogen bonding and/or ionic interactions (category 1), whereas most heat shock protein 90-alpha 3D-cliffs belonged to category 2. Target-based differences in cliff categories might guide the identification of active site regions responsible for large potency differences among ligands, aid in SAR exploration, and provide clues for structure-based design.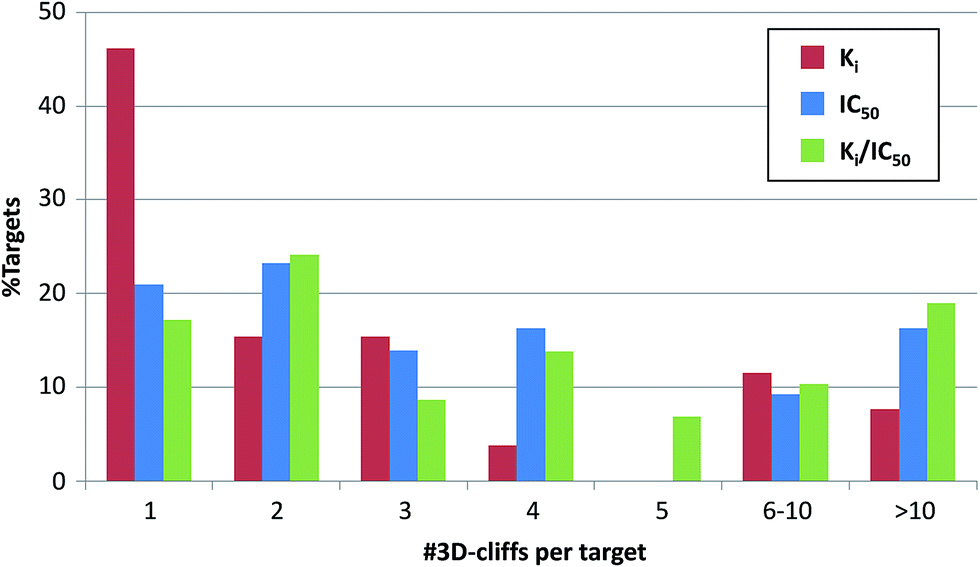 | ||
| Fig. 7 Distribution of 3D-cliffs over targets. Shown is the percentage of targets for which increasing numbers of 3D-cliffs were obtained for the Ki, IC50, and Ki/IC50 sets. | ||
| Ki | ||||
|---|---|---|---|---|
| Target name | Number of | Cliff categories | ||
| Complexes | Qualifying pairs | 3D-cliffs | ||
| a For each data set, target proteins with ≥ 10 3D-cliffs are listed. For each target, the number of available complex structures, qualifying pairs (reaching at least 80% 3D similarity), and 3D-cliffs is reported. In addition, cliff categories are given as a 6-tuple in which each position corresponds to a cliff category 1–6 (e.g., the first digit in a 6-tuple indicates the number of 3D-cliffs belonging to category 1). Target abbreviations: uPA, urokinase-type plasminogen activator; MAPKK1, dual specificity mitogen-activated protein kinase 1. | ||||
| Thrombin | 113 | 417 | 158 | 33, 73, 0, 0, 45, 7 |
| Coagulation factor Xa | 84 | 325 | 21 | 1, 10, 0, 0, 5, 5 |
| IC50 | ||||
|---|---|---|---|---|
| Target name | Number of | Cliff categories | ||
| Complexes | Qualifying pairs | 3D-cliffs | ||
| Beta-secretase 1 | 158 | 593 | 57 | 7, 37, 0, 0, 9, 4 |
| Heat shock protein 90-alpha | 66 | 156 | 39 | 0, 28, 6, 0, 4, 1 |
| Leukotriene A4 hydrolase | 27 | 91 | 32 | 30, 2, 0, 0, 0, 0 |
| Cyclin-dependent kinase 2 | 137 | 159 | 26 | 12, 9, 0, 0, 5, 0 |
| Ser/thr protein kinase Chk2 | 19 | 42 | 12 | 2, 4, 0, 0, 1, 5 |
| MAPKK1 | 13 | 47 | 11 | 10, 0, 0, 0, 1, 0 |
| Mitogen-activated protein kinase 14 | 92 | 124 | 11 | 3, 3, 0, 0, 5, 0 |
| Ki/IC50 | ||||
|---|---|---|---|---|
| Target name | Number of | Cliff categories | ||
| Complexes | Qualifying pairs | 3D-cliffs | ||
| Thrombin | 141 | 476 | 166 | 36, 73, 0, 0, 48, 9 |
| Beta-secretase 1 | 170 | 627 | 57 | 6, 37, 0, 0, 10, 4 |
| Heat shock protein 90-alpha | 81 | 188 | 43 | 1, 32, 6, 0, 3, 1 |
| Cyclin-dependent kinase 2 | 149 | 210 | 41 | 22, 12, 0, 0, 5, 2 |
| Leukotriene A4 hydrolase | 30 | 98 | 37 | 32, 4, 0, 0, 1, 0 |
| Coagulation factor Xa | 98 | 405 | 28 | 2, 10, 0, 0, 8, 8 |
| Carbonic anhydrase II | 113 | 184 | 24 | 7, 1, 4, 0, 0, 12 |
| Mitogen-activated protein kinase 14 | 96 | 139 | 13 | 2, 5, 0, 0, 6, 0 |
| Ser/thr protein kinase Chk2 | 19 | 42 | 12 | 2, 4, 0, 0, 1, 5 |
| uPA | 49 | 78 | 12 | 6, 3, 0, 0, 1, 2 |
| MAPKK1 | 13 | 47 | 11 | 10, 0, 0, 0, 1, 0 |
| Estrogen receptor alpha | 27 | 82 | 10 | 2, 7, 0, 0, 0, 1 |
Current 3D-cliff space
In the initial survey of 3D-cliffs, 216 cliffs were detected on the basis of combined Ki and IC50 measurements.9 The current analysis focusing on three potency measurement-dependent data sets revealed an unexpectedly large increase in 3D-cliff information over the course of only three years. The three sets yielded a total of 630 unique 3D-cliffs involving 580 unique ligands active against 61 targets belonging to 25 different families. Table 4 lists the top-10 targets with the largest increase in the number of 3D-cliffs. The largest increase was observed for thrombin inhibitors, as discussed above. Compared to 2012, the number of qualifying thrombin-inhibitor complex structures increased by 57, leading to the formation of 150 additional 3D-cliffs. These complex structures originated from various academic and pharma environments. Furthermore, 68 new complex structures became available for inhibitors of beta-secretase 1, another popular therapeutic target, leading to an increase in the number of 3D-cliffs from 18 to 68. In total, 313 additional 3D-cliffs were detected for the top-10 targets in Table 4, representing the majority of newly identified 3D-cliffs.| Target name | # Unique complexes | # Unique 3D-cliffs | ||||
|---|---|---|---|---|---|---|
| 2012 | 2015 | Δ(2015–2012) | 2012 | 2015 | Δ(2015–2012) | |
| a For each target, the number of unique protein–ligand complexes and the number of unique 3D-cliffs from our three potency measurement-dependent sets (2015) was compared to the data available for the same target in 2012.9 The top-10 targets with largest gain in the number of 3D-cliffs over the past years are listed. The increase in the number of complexes and 3D-cliffs is reported as “Δ(2015–2012)”. Target abbreviation: uPA, urokinase-type plasminogen activator. | ||||||
| Thrombin | 86 | 143 | 57 | 24 | 174 | 150 |
| Beta-secretase 1 | 106 | 174 | 68 | 18 | 68 | 50 |
| Heat shock protein 90-alpha | 44 | 81 | 37 | 17 | 45 | 28 |
| Coagulation factor Xa | 82 | 98 | 16 | 11 | 30 | 19 |
| Cyclin-dependent kinase 2 | 131 | 150 | 19 | 25 | 42 | 17 |
| Leukotriene A4 hydrolase | 26 | 30 | 4 | 23 | 37 | 14 |
| Carbonic anhydrase II | 79 | 113 | 34 | 12 | 24 | 12 |
| uPA | 41 | 50 | 9 | 4 | 13 | 9 |
| Estrogen receptor alpha | 24 | 27 | 3 | 3 | 10 | 7 |
| Mitogen-activated protein kinase 14 | 70 | 97 | 27 | 7 | 14 | 7 |
Concluding remarks
We have systematically identified three-dimensional activity cliffs on the basis of currently available X-ray structures of protein–ligand complexes and high-confidence compound activity data. 3D-cliffs were separately considered for potency measurement type-dependent data sets, thoroughly analyzed, and categorized. In total, our large-scale investigation has identified 630 unique 3D-cliffs that involved 580 small molecules with activity against 61 human targets. Compared to the situation in 2012 when a first systematic survey of 3D-cliffs was carried out, these findings represented a very substantial increase in 3D-cliff information, which was mostly – but not exclusively – centered on protease targets. All 3D-cliffs we detected on the basis of pre-defined similarity and potency difference criteria were subjected to careful visual inspection and superposition. Calculation artifacts were not detected. Hence, the 3D-cliff set is thought to have a high level of confidence. Structure-based analysis of interaction differences revealed that cliff partners distinguished by well-defined hydrogen bonding/ionic or aromatic/lipophilic interactions were prevalent among current 3D-cliffs. Hence, for the majority of 3D-cliffs, possible structural rationales are available, which also provide hypotheses for follow-up investigations, for example, to quantitatively relate interaction differences to potency changes. Furthermore, network analysis revealed that the majority of 3D-cliffs were formed in a coordinated manner. Hence, groups of ligands formed multiple and overlapping 3D-cliffs. This aspect is relevant for structure-based SAR analysis because interaction differences of multiple ligands can be inspected within their structural environments and related to potency variations. Accordingly, the analysis of coordinated 3D-cliffs is very likely to provide more SAR insights than cliffs considered in isolation. In addition to SAR analysis, 3D-cliffs are also of interest to identify interaction hotspots and binding determinants for structure-based design. Furthermore, they provide excellent test cases for computational methods designed to reconcile and predict differences in interaction energies. 3D-cliffs, in which partner compounds do not display apparent interaction differences at the structural level, are also of high interest for molecular simulation approaches to study ligand binding. To support SAR exploration and structure-based design efforts in the scientific community, the 3D-cliff information reported herein will be made freely available (via a deposition on the open access ZENODO platform under the authors' names; http://www.zenodo.org).20 In an accompanying study, we investigate how 3D-cliff information can be complemented and further extended through systematic identification and mapping of active analogs of cliff compounds.Acknowledgements
N.F. was supported by a fellowship from the Jürgen Manchot Foundation, Düsseldorf, Germany.References
- G. M. Maggiora, J. Chem. Inf. Model., 2006, 46, 1535 CrossRef CAS PubMed.
- D. Stumpfe and J. Bajorath, J. Med. Chem., 2012, 55, 2932–2942 CrossRef CAS PubMed.
- D. Stumpfe, Y. Hu, D. Dimova and J. Bajorath, J. Med. Chem., 2014, 57, 18–28 CrossRef CAS PubMed.
- J. L. Medina-Franco, K. Martínez-Mayorga, A. Bender, R. M. Marín, M. A. Giulianotti, C. Pinilla and R. A. Houghten, J. Chem. Inf. Model., 2009, 49, 477–491 CrossRef CAS PubMed.
- X. Hu, Y. Hu, M. Vogt, D. Stumpfe and J. Bajorath, J. Chem. Inf. Model., 2012, 52, 1138–1145 CrossRef CAS PubMed.
- M. T. Sisay, L. Peltason and J. Bajorath, J. Chem. Inf. Model., 2009, 49, 2179–2189 CrossRef CAS PubMed.
- B. Seebeck, M. Wagener and M. Rarey, ChemMedChem, 2011, 6, 1630–1639 CrossRef CAS PubMed.
- Y. Hu and J. Bajorath, J. Chem. Inf. Model., 2012, 52, 670–677 CrossRef CAS PubMed.
- Y. Hu, N. Furtmann, M. Gütschow and J. Bajorath, J. Chem. Inf. Model., 2012, 52, 1490–1498 CrossRef CAS PubMed.
- H. Berman, K. Henrick, J. Westbrook, Z. Feng, G. Gilliland, T. N. Bhat, H. Weissig, I. N. Shindyalov and P. E. Bourne, Nucleic Acids Res., 2000, 28, 235–242 CrossRef CAS PubMed.
- H. Berman, K. Henrick, H. Nakamura and J. L. Markley, Nucleic Acids Res., 2007, 35, D301–D303 CrossRef CAS PubMed.
- UniProtConsortium, Nucleic Acids Res., 2010, 38, D142–D148 CrossRef PubMed.
- A. Gaulton, L. J. Bellis, A. P. Bento, J. Chambers, M. Davies, A. Hersey, Y. Light, S. McGlinchey, D. Michalovich, B. Al-Lazikani and J. P. Overington, Nucleic Acids Res., 2012, 40, D1100–D1107 CrossRef CAS PubMed.
- Y. Hu and J. Bajorath, J. Chem. Inf. Model., 2014, 54, 3056–3066 CrossRef CAS PubMed.
- L. Peltason and J. Bajorath, Chem. Biol., 2007, 14, 489–497 CrossRef CAS PubMed.
- Molecular Operating Environment (MOE), Chemical Computing Group Inc., Montreal, Quebec, Canada, 2011.
- D. Stumpfe, A. de la Vega de León, D. Dimova and J. Bajorath, F1000Research, 2014, 3, 75 Search PubMed.
- D. Stumpfe, D. Dimova and J. Bajorath, J. Chem. Inf. Model., 2014, 54, 451–561 CrossRef CAS PubMed.
- P. Shannon, A. Markiel, O. Ozier, N. S. Baliga, J. T. Wang, D. Ramage, N. Amin, B. Schwikowski and T. Ideker, Genome Res., 2003, 13, 2498–2504 CrossRef CAS PubMed.
- N. Furtmann, Y. Hu, M. Gütschow and J. Bajorath, Currently available 3D activity cliffs and 2D-analogs of 3D-cliff compounds, ZENODO, 2015, DOI:10.5281/zenodo.17418.
| This journal is © The Royal Society of Chemistry 2015 |