Leveling graphene sheets through electrospinning and their conductivity†
Yao
Wang
*a,
Jianguo
Tang
*a,
Shiqiang
Xie
a,
Jixian
Liu
a,
Zhichao
Xin
a,
Xiaoling
Liu
a and
Laurence A.
Belfiore
*ab
aInstitute of Hybrid Materials, National Base of International Sci. and Eng. Cooperation on Hybrid Materials, the Growing Base for State Key Laboratory, Qingdao University, 308 Ningxia Road, Qingdao 266071, P. R. China. E-mail: jianguotangde@hotmail.com; wangyaoqdu@126.com; Fax: +86 532 85951519; Tel: +86 532 85951519
bDepartment of Chemical and Biological Engineering, Colorado State University, Fort Collins, Colorado 80523, USA. E-mail: belfiore@engr.colostate.edu
First published on 14th April 2015
Abstract
This study provided a strategy to extend and level easily-curved graphene sheets through electrospinning. A suspension of graphene oxide (GO) sheets in polar polymers, such as polyacrylonitrile (PAN) and polyvinyl pyrrolidone (PVP), was first electrospun into a composite network in which the GO sheets were sandwiched and leveled under the drag force of the electrospun nanofibers at the surface and around the edge of the GO sheets. Then, the leveled GO sheets were reduced under the vapor of reducing agents and became graphene sheets. The scanning electron micrographical results confirm the extended and leveled shape of the graphene sheets. With this strategy, the problem of easy curvature of graphene sheets can be thoroughly dissolved. Very importantly, the pressed multilayer samples have a high conductivity of 103 S m−1. This indicates that wide potential applications of graphene materials from natural graphite in photo- and electro-devices will be developed.
1. Introduction
In recent years, graphene has become a very useful material due to its unique features, such as its extraordinary electronic properties,1 mechanical strength,2 and ultrahigh thermal conductivity.3 Two-dimensional crystalline arrays of carbon atoms, arranged in a honeycomb lattice in graphene, generate small-band-gap semi-metals with unusual electronic and optical properties, including extremely high carrier mobility.4,5 Currently, graphene is typically produced from graphite by a “topdown” process – either physical exfoliation6 or liquid phase exfoliation.7 The interlayer space of graphene (d002) is ∼3.4 Å, which is slightly larger than that of the graphite (002) facet (3.348–3.36 Å). This may be due to the turbostratic AB-stacked structure and nanocurvature distortion in graphene.8,9 Furthermore, reduced graphene sheets prepared from graphite oxide (GO) will have a curved morphological structure and form powdery materials via the natural layer-by-layer stacking of basal graphene sheets.9 Based on this powder structure, graphene can be applied for paints, coatings, composites, films, adhesives, lubricants and functional fluids, where graphene nanopowders act as multifunctional additives.10 However, some of the applications of graphene require leveling of its shape in plane, especially for electric- and photo-devices like solar cells or light-emission diodes, where there is the limitation of structure thickness (for example, less than 200 nm) in devices.11 This study provided a strategy to extend and level easily-curved graphene sheets through electrospinning. Our experimental results indicate that several popular polymers can act as ideal hosts for graphene extension.2. Experimental
GO was prepared using a modified Hummers’ method. The GO slurry thus produced was dried in a vacuum oven at 45 °C for 24 h. The chemical reduction of GO was carried out by reducing agents, such as hydrazine hydrate, phenylhydrazine, glucose and so on. As a typical example, a 4%-GO slurry was diluted by 1 L deionized water and sonicated for 40 min. Then the mixture was reduced by a single or mixed reducing agent, as mentioned above. The reaction details are described in the ESI.† The reduced products (black precipitates) are normally powdery agglomerates.An electrospinning method was used in this research. The dried graphene oxide (1 g) was added into N,N-dimethyl formamide (DMF) (50 mL) solvent and the suspension was sonicated for 40 min. Then, polyacrylonitrile (PAN) was added into the suspension according to the set ratio of DMF![[thin space (1/6-em)]](https://www.rsc.org/images/entities/char_2009.gif) :
:![[thin space (1/6-em)]](https://www.rsc.org/images/entities/char_2009.gif) PAN = 22
PAN = 22![[thin space (1/6-em)]](https://www.rsc.org/images/entities/char_2009.gif) :
:![[thin space (1/6-em)]](https://www.rsc.org/images/entities/char_2009.gif) 3 by weight, and the sonication was continued for 8 h to obtain the spinning solution. Electrospinning was conducted under a set voltage (20 kV) and current (0–3 mA). Then, the spun fiber composite was stifled under the vapor of hydrazine monohydrate for 6 h. Similarly, ethylene alcohol was used as the solvent to dissolve GO and PVP (8 wt% in ethylene alcohol). All the dissolving and electrospinning conditions for the GO–PVP suspension were the same as those mentioned above.
3 by weight, and the sonication was continued for 8 h to obtain the spinning solution. Electrospinning was conducted under a set voltage (20 kV) and current (0–3 mA). Then, the spun fiber composite was stifled under the vapor of hydrazine monohydrate for 6 h. Similarly, ethylene alcohol was used as the solvent to dissolve GO and PVP (8 wt% in ethylene alcohol). All the dissolving and electrospinning conditions for the GO–PVP suspension were the same as those mentioned above.
The conductivity measurements were done on a four-probe conductive tester, (TS-8, Probes Tech. Guangzhou, China). The samples were prepared through the hot-pressing method on a pressing machine (TH-6009, Test Machine Co. Ltd, Tianhui, China). After peeling away the reduced graphene–polymer nanofiber composite pieces from the aluminum paper substrate, we multilayered up 5 pieces of this composite and then hot-pressed them to form the samples for conductive measurement.
A scanning electron microscope (JEOL JSM-6390LV), a Fourier transform infrared spectroscope (Nicolet, USA MAGNA-IR 550), and an X-ray diffraction (XRD) spectrometer (Bruker German D-8 Advance diffractometer) were used for the measurements. The elemental analyses of GO and graphene were performed on a PE2400 (Perkin Elmer, USA). Also, Raman spectroscopy was applied for the measurement of the graphene or GO crystalline structures.
3. Results and discussion
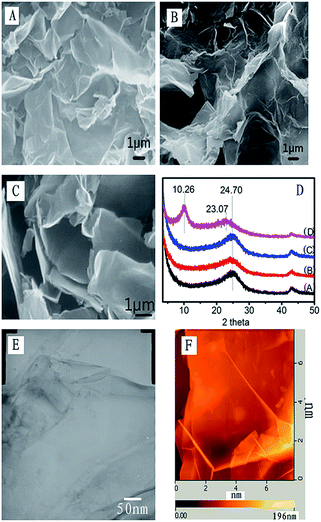
Fig. 1A shows the SEM image of the sample reduced by hydrazine hydrate, which was spin-coated onto a transparent tape substrate, but the samples for Fig. 1B and C were reduced by phenylhydrazine, and were spin-coated onto a monocrystalline silicon substrate and a transparent tape substrate respectively. One can find that the morphology in Fig. 1A shows a continuous and well-distributed spread. However, the morphologies in Fig. 1B and C are uncontinuous and the GO sheets were seriously curved. The XRD patterns of the graphene samples show a broad peak at 2θ = 24.70 for samples A, B and C, in which A was reduced by hydrazine hydrate (1 mL hydrazine hydrate for 1 g graphene in 1000 mL water), and B and C were reduced by phenylhydrazine at different concentrations (B: 5 mL phenylhydrazine for 1 g GO and C: 10 mL phenylhydrazine for 1 g GO in 1000 mL water). The corresponding interlayer space (d002) is 3.432 Å, which is similar to the literature.12 However, sample D, which was reduced by glucose (2 mL glucose for 1 g GO in 1000 mL water) had a large interlayer space d002 > 7.000 Å for the (002) peak at 2θ = 10.26° because of the lower degree of reduction of GO. In this case, intercalated H2O molecules and various oxide groups are present.12,13 Therefore, the interlayer spacing of the graphene sheets confirms that hydrazine hydrate and phenylhydrazine are better reducing agents to obtain the graphene coatings.Fig. 1E and F are TEM and AFM images of graphene sheets reduced by hydrazine hydrate, in which we can find that (1) both of them show the curved structure of graphene sheets, and (2) the size of graphene sheets prepared from natural graphite is bigger than 6 µm (but normally less than 10 µm). The paper published in Nature Nanotechnology14 shows the size of graphene sheets is about 1 µm. Indeed, the actual size of graphene is much dependent on the place where the original graphite starting materials were mined out. In Fig. 1E, the image shows the graphene sheet is very thin with slight wrinkles.
FT-IR spectra indicate that there are characteristic absorbance bands of O–H at 3402 and 1612 cm−1, which correspond to the hydroxyl groups in GO and small intercalated H2O molecules between the GO sheets (Fig. 2A). After reduction using phenylhydrazine and glucose as reducing agents, these characteristic bands largely decrease (Fig. 2B and C), which means the graphene oxide is partly reduced. Moreover, these characteristic bands almost disappear (Fig. 2D) when the graphene oxide sample was reduced by hydrazine hydrate. However, the spectrum shows a C![[double bond, length as m-dash]](https://www.rsc.org/images/entities/char_e001.gif) C stretching band at 1652 cm−1 in Fig. 2D. Obviously, this band was overlapped by a broad 1162 cm−1 band in Fig. 2B and C, although C
C stretching band at 1652 cm−1 in Fig. 2D. Obviously, this band was overlapped by a broad 1162 cm−1 band in Fig. 2B and C, although C![[double bond, length as m-dash]](https://www.rsc.org/images/entities/char_e001.gif) C covalent bonds do exist in these samples. This means that the carbon atoms linking the hydroxyl oxide groups in graphene oxide sheets change from sp3 to sp2 hybridized orbitals.
C covalent bonds do exist in these samples. This means that the carbon atoms linking the hydroxyl oxide groups in graphene oxide sheets change from sp3 to sp2 hybridized orbitals.
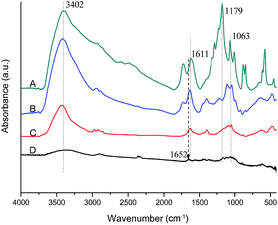 | ||
| Fig. 2 FT-IR spectra of (A) GO, (B) GO reduced by glucose, (C) GO reduced by phenylhydrazine and (D) GO reduced by hydrazine hydrate. | ||
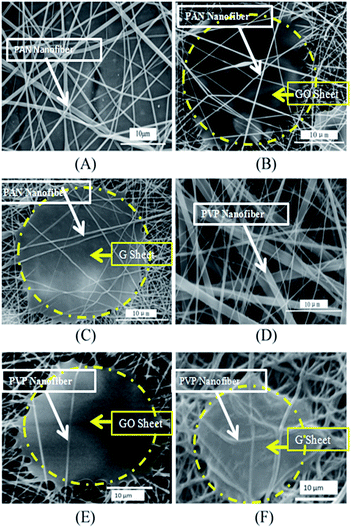
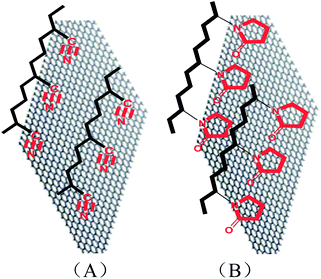
The proposed structure of graphene confirmed in Fig. 1A and 2D is very useful for preparing photo-/electric-devices.15 However, there are two factors that prohibit these applications of graphene: (1) the large ratio of plane size (i.e., ∼5 µm) to thickness (i.e., 0.34 nm) generates the curved nature; and (2) the reduced graphene sheets do not dissolve in any solvents. Fig. 3 shows the SEM photographs of PAN electrospun nanofibers, GO–PAN electrospun nanofiber composites, and graphene–PAN nanofiber composites prepared from the reduction of GO–PAN. The electrospun PAN nanofibers with a diameter of less than 100 nanometers (Fig. 3A) form a smooth nanofiber network, whereas GO sheets sandwiched among the nanofibers show joints around the edge of the GO sheets where nanofibers attach on tightly (Fig. 3B). After the GO–PAN sample was reduced by hydrazine hydrate, the sample showed similar characteristics, in that electrospun nanofibers attached around and onto the graphene sheets in Fig. 3C. This image indicates that graphene extends because of the nanofibers’ drag effect. The concentration of polymer–GO, electrospinning voltage, and solution temperature affect the formation. As a comparison, the PVP polymer is also available for electrospinning (Fig. 3D). When it was used as the polymer matrix, the extended GO sheet can also be obtained (Fig. 3E). After it was reduced under the vapor of hydrazine hydrate, the level graphene sheet was maintained (Fig. 3F). The extension includes two steps: (1) the triple conjugate bonds in the –CN groups and the hydrogen atoms in the HO– groups form –CN:–HO– hydrogen bonds at the GO surface; and (2) after reduction of the GO–PAN electrospun nanofiber composite, the HO– group is lost. Thus, the hydrogen bonds do not exist anymore, and are replaced by π–π interactions between the triple conjugate bonds in the –CN groups and the huge 2D conjugate structure of the graphene sheets (Fig. 4A). Thus, the nanofiber-attached graphene sheet structure is kept well. Similarly, the polar groups (O![[double bond, length as m-dash]](https://www.rsc.org/images/entities/char_e001.gif) C and N) in the pyrrolidone ring in polyvinyl pyrrolidone have strong interactions with graphene oxide and graphene sheets too, through the same interaction principle (Fig. 4B). Therefore, the PVP can play a similar role to PAN.
C and N) in the pyrrolidone ring in polyvinyl pyrrolidone have strong interactions with graphene oxide and graphene sheets too, through the same interaction principle (Fig. 4B). Therefore, the PVP can play a similar role to PAN.
The characterization of samples of GO/graphene–PAN electrospun nanofiber composites and GO/graphene–PVP electrospun nanofiber composites by means of Raman scattering is shown in Fig. 5(1) and (2) respectively. In Fig. 5(1), the comparison with the G-band intensity of the GO–PAN electrospun nanofiber composite indicates that the G-band intensity of the graphene–PAN nanofiber composite decreases, with a ratio (R) of the G-band to the D-band (R = IG/ID) of 0.84, which is lower than that of the GO–PAN nanofiber composite (1.10). Whereas when the nanofiber-forming polymer was changed to PVP, the ratio of R = IG/ID of the graphene–PVP nanofiber composite is 0.95 and that of the GO–PVP nanofiber composite is 1.14. Referring to the publications of L. Zhou,16,17 these data regarding G- and D-bands are related to the crystalline structures of GO and graphene. Therefore, we can find (1) graphene sheets in nanofiber composites have a lower degree of crystalline structure than that of GO in nanofiber composites, with either PAN or PVP as the host polymer; and (2) a difference of polymer host has an influence on the crystalline structures of GO/graphene in the nanofiber composites.
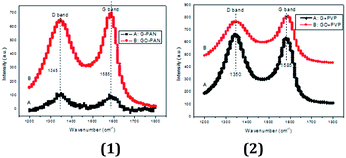 | ||
| Fig. 5 The Raman scattering spectra of (1) GO/graphene–PAN electrospun nanofiber composites and (2) GO/graphene–PVP electrospun nanofiber composites. | ||
Table 1 lists the conductivity data. The samples for conductivity measurement were pressed by a pressing machine at 100 °C. We know that these composite sheets can have a good conductivity of the order 103 S m−1. As a comparison, the conductivities of pure PAN nanofiber and PVP nanofiber are 2.3 × 10⁻¹¹ and 4.3 × 10⁻⁷ S m−1, based on ref. 18. With this method, we can obtain thin conductive films with a thickness of 200–300 nm.
| Sample | Conductivity (S m−1) |
|---|---|
| Graphene–PAN nanofiber composite | 7.5 × 10³ |
| Graphene–PVP nanofiber composite | 2.5 × 10³ |
4. Conclusions
In summary, through the investigation of the morphological structures of graphene reduced by different reducing agents, we confirmed that the curved features of graphene sheets can not be prevented using the GO-coating reduction strategy, even though the sample was better following hydrazine hydrate reduction on a transparent tape. However, this novel strategy to extend single graphene sheets by electrospinning is exceedingly effective. Herein, PAN and PVP were used as examples of polar polymers for nanofiber matrices. Level graphene sheets were successfully developed and they have good conductivity of the order 103 S m−1. Thus, we have dissolved the two key prohibitions in the application of graphene for photo-/electro-devices: the curved shape and the solubility problem of graphene sheets.Acknowledgements
The authors appreciate financial support from: (1) National One-Thousand Foreign Expert Program of China; (2) Natural Scientific Foundation of China, Grant #51273096; (3) Natural Scientific Foundation of China, Grant #51373081; (4) Natural Scientific Foundation of China, Grant #51473082; (5) Shandong Province Project: Tackle Key Problem in Key Technology, #2010GGX10327.References
- A. K. Geim and K. S. Novoselov, Nat. Mater., 2007, 6(3), 183 CrossRef CAS PubMed.
- C. Lee, et al. , Science, 2008, 321(5887), 385 CrossRef CAS PubMed.
- A. A. Balandin, et al. , Nano Lett., 2008, 8(3), 902 CrossRef CAS PubMed.
- P. Mukhopadhyay and R. K. Gupta, Plast. Eng., 2011, 67, 32 Search PubMed.
- J. Williams, et al. , Science, 2007, 317(5838), 638 CrossRef CAS PubMed.
- H. C. Schniepp, et al. , J. Phys. Chem. B, 2006, 110(17), 8535 CrossRef CAS PubMed.
- M. Lotya, et al. , J. Am. Chem. Soc., 2009, 131(10), 3611 CrossRef CAS PubMed.
- S. Stankovich, et al. , Carbon, 2007, 45(7), 1558 CrossRef CAS PubMed.
- H.-K. Jeong, et al. , J. Am. Chem. Soc., 2008, 130(4), 1362 CrossRef CAS PubMed.
- A. Zurutuza and C. Marinelli, Nat. Nanotechnol., 2014, 9(10), 730 CrossRef CAS PubMed.
- D. H. Wang, et al. , Angew. Chem., 2011, 123(24), 5633 CrossRef PubMed.
- H.-M. Ju, et al. , Mater. Lett., 2010, 64(3), 357 CrossRef CAS PubMed.
- H.-K. Jeong, et al. , Chem. Phys. Lett., 2009, 470(4), 255 CrossRef CAS PubMed.
- D. Li, et al. , Nat. Nanotechnol., 2008, 3(2), 101 CrossRef CAS PubMed.
- J. E. Drut and T. A. Lähde, Phys. Rev. B: Condens. Matter Mater. Phys., 2009, 79, 165425 CrossRef.
- Y. Chen, et al. , Energy Environ. Sci., 2014, 7(8), 2689 CAS.
- Y. Chen, et al. , Nanoscale, 2012, 4(21), 6800 RSC.
- J. Brandrup, et al., Polymer handbook, Wiley, New York, 1999 Search PubMed.
Footnote |
| † Electronic supplementary information (ESI) available. See DOI: 10.1039/c5ra01922b |
| This journal is © The Royal Society of Chemistry 2015 |

