Solvent determines the formation and properties of metal–organic frameworks†
Bingxing Zhang,
Jianling Zhang*,
Chengcheng Liu,
Xinxin Sang,
Li Peng,
Xue Ma,
Tianbin Wu,
Buxing Han and
Guanying Yang
Beijing National Laboratory for Molecular Sciences, Key Laboratory of Colloid and Interface and Thermodynamics, Institute of Chemistry, Chinese Academy of Sciences, China. E-mail: zhangjl@iccas.ac.cn; Fax: +86-10-62559373; Tel: +86-10-62562821
First published on 8th April 2015
Abstract
The formation of a water-sensitive metal–organic framework (MOF), Cu3(BTC)2 (BTC = 1,3,5-benzenetricarboxylate), in a water/ethanol solvent system was studied systematically. The X-ray diffraction results prove that the MOF cannot form in pure water or in a water/ethanol mixture with a small amount of ethanol. As the ethanol content exceeds 30 vol%, a crystalline MOF can be obtained. The scanning electron microscope images of the as-synthesized MOFs show the formation of MOF nanoparticles with an average size of 20–300 nm. The MOF particle size decreased with increasing ethanol content in the mixed solvent. The FT-IR spectra further support that the MOF formation occurs in water/ethanol mixtures with ethanol volume ratios higher than 30 vol%. Thermogravimetric analysis showed that the MOF is stable up to 300 °C. Moreover, the FT-IR spectra and thermogravimetric analysis gave consistent information on the solvent amount entrapped in the MOF pores. The porosity of the MOFs was determined using a N2 adsorption–desorption method. When the ethanol volume ratio reached 75%, the largest SBET value of 1067 m2 g−1 and Vt value of 0.52 cm3 g−1 were obtained. The possible mechanism for MOF formation in water/ethanol solvent systems and the dependence of the MOF size on the solvent composition was discussed from the view of hydrogen bond strength between solvent molecules and the ligands in different water/ethanol solvent systems.
1. Introduction
Metal–organic frameworks with controlled morphology and properties have shown application potential in gas adsorption,1–3 separation,4 drug release,5,6 sensing7 and catalysis,8–10 due to their large surface area, relatively mass reactive sites, tunable structure and well-defined porosity. To modulate the structure and properties of MOFs is of great importance because the applications of MOFs are dependent on their structure and properties. Up to now, diverse kinds of methods have been proposed for modulating the size, morphology, and properties of MOFs, such as utilizing different solvents,11–13 templating methods,14–16 acid-based adjustment routes,17 sonochemical processes,18 etc. Among these routes, a solvent adjustment method is undoubtedly the most convenient way to fabricate MOF materials with desirable structures and properties. The conventional solvents for MOF formation are organic liquids, such as N,N-dimethylformamide (DMF), N,N-diethylformamide (DEF) and 1-methyl-2-pyrrolidone (NMP). In addition, binary solvents with water or ethanol (e.g. DMF/ethanol,19 DMF/water20) have been used for MOF synthesis. Generally, a solvothermal process is needed for MOF formation and the reaction temperature is usually controlled to be higher than 100 °C.Water is the most environmentally benign, economic and ideal solvent in the world. Hydrothermal processes have been reported for MOF synthesis with many advantages.21,22 However, it is known that the majority of MOFs are unstable in aqueous medium, suffering from phase changes, a loss in crystallinity, and structural decomposition.23 Therefore, water is absolutely avoided in the preparation of water-sensitive MOFs. Recently, the Bai14 group and Kirschhock15 group have used a mixture of water with ethanol as the solvent for the synthesis of Cu3(BTC)2 (BTC = 1,3,5-benzenetricarboxylate), which is one of the most extensively explored MOFs due to its various uses.24–26 Most interestingly, it gives a clue that the presence of ethanol might prevent the damaging effect of water on Cu3(BTC)2 and thus the structural integrity of Cu3(BTC)2 could be well kept in an aqueous medium. Moreover, this route is more attractive because it can proceed at room temperature and is environmentally benign. Nevertheless, these two papers are focused on the characterization and application of the MOF formed in a water/ethanol mixture with a fixed composition (with equal or approximately equal volumes of water and ethanol). The fine modulation of size, morphology and properties of the MOF by controlling the solvent composition and the underlying mechanism have not been studied.
Herein, we carried out a systematic investigation on Cu3(BTC)2 formation in a series of water/ethanol mixtures with ethanol volume ratios from zero to 100%. It was found that a satisfactory amount of ethanol (>30 vol%) is needed to ensure the formation of a Cu3(BTC)2 MOF in an aqueous medium, i.e. a small amount of ethanol in water does not work for MOF formation. Cu3(BTC)2 nanoparticles with an average size of 20–300 nm were obtained and their size and porosity properties can be easily tuned by changing the composition of the mixed solvent. The mechanism for the ethanol-induced MOF formation in an aqueous medium and the downsizing of the MOF particles were discussed from the view of hydrogen bonding interactions between solvent molecules and the organic ligand. This research is meaningful in view of the following points: first, it developed a facile and environmentally-friendly route for modulating the size and properties of MOF particles. Second, it provides new insight into the solvent effect on MOF formation.
2. Experimental
2.1 Materials
Copper(II) acetate monohydrate (Cu(OAc)2·H2O) (A. R. Grade) were obtained from Alfa Aesar. 1,3,5-Benzenetricarboxylic acid (H3BTC) (purity 95%) were provided by Aldrich. Absolute ethanol and deionized water were provided by the Beijing Analysis Instrument Factory. All these materials were used without further purification.2.2 MOF synthesis
For the MOF synthesis, mixtures of absolute ethanol and deionized water with different ethanol volume ratios of 0, 25%, 33%, 50%, 67%, 75%, and 100% were prepared. H3BTC (2.5 mmol) and Cu(OAc)2·H2O (2.5 mmol) were dissolved in a water/ethanol mixture (60 mL), respectively. The Cu(OAc)2 solution was dropped into the H3BTC solution under rapid stirring. After the mixture was stirred for 6 hours at room temperature, the stirring was stopped. The blue suspension was separated by centrifugation and the precipitate was filtered and washed with water/ethanol several times. The product was obtained after drying at 60 °C under vacuum for 24 hours.2.3 MOF characterization
The morphologies of the as-synthesized MOFs were characterized using a scanning electron microscope (HITACHI S-4800). X-ray diffraction (XRD) was performed using a Rigaku D/max-2500 diffractometer with Cu Kα radiation (λ = 1.5418 Å) at 40 kV and 200 mA. The porosity properties of the MOFs were determined using nitrogen adsorption–desorption isotherms using a Micromeritics ASAP 2020 (M + C) system. The FT-IR spectra were obtained using a Bruker Tensor 27 spectrometer. The thermogravimetric (TG) measurements were carried out using Pyris 1 TGA with a N2 flow of 10 mL min−1.2.4 The solvent effect on H3BTC molecules
UV-vis spectra of the H3BTC solutions (3.3 × 10⁻⁵ mol L−1) in water/ethanol mixtures were determined using a Varian Cary 1E UV-vis spectrophotometer. The spectra were measured at a scanning rate of 1 nm s−1.3. Results and discussion
3.1 XRD characterization
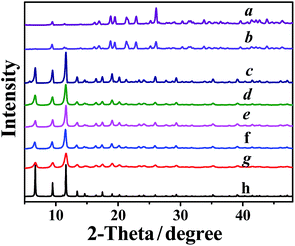
MOF formation in the water/ethanol mixtures with different ethanol volume ratios was investigated. As shown in Fig. 1, the XRD patterns of the samples synthesized in pure water and in the water/ethanol mixture with a small amount of ethanol (curves a and b) are completely different from the simulated XRD pattern of HKUST-1 (curve h), which is one of the most widely studied Cu-MOFs.27–31 The XRD patterns correspond to the collapsed MOF network, exhibiting individual carboxyl groups that are not coordinated to the Cu atom.32 It can be attributed to the existence of a large amount of water, which effectively prevents the coordination between the carboxyl groups and Cu atom.33 As the ethanol content is increased to or higher than 33%, the XRD patterns of the samples (curves c–g) coincide well with the simulated XRD pattern of HKUST-1 (curve h), proving the formation of crystalline Cu3(BTC)2. The XRD results reveal that a certain amount of ethanol can promote the formation of Cu3(BTC)2 in an aqueous medium. It is noted that the X-ray diffractions of the MOFs are broader, indicating that the MOF is composed of small nano-crystallites (curves c–g). Moreover, the diffractions of the MOFs synthesized in the water/ethanol mixture with more ethanol are more broader, indicative of the decreased particle size.3.2 Morphologies
Fig. 2 shows the SEM images of the MOFs synthesized in water/ethanol mixtures with different ethanol volume ratios. The MOF synthesized in the water/ethanol mixture with an ethanol volume ratio of 33% presents large crystals in the size of 200–400 nm (Fig. 2a). When the volume ratio of ethanol reached 50%, the average crystal size of the as-synthesized MOF is sharply reduced to ∼60 nm (Fig. 2b). With a further increase in the proportion of ethanol, the crystal size gradually decreases (Fig. 2c and d). The MOF synthesized in pure ethanol has the smallest particle size of ∼20 nm (Fig. 2e). It indicates that the crystal size of the MOFs can be modulated by the composition of the water/ethanol mixture. The SEM results are consistent with the XRD results.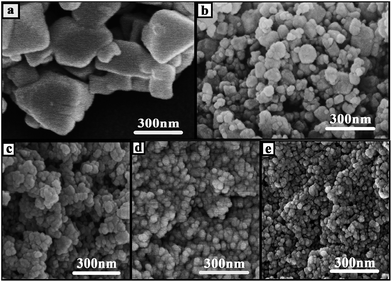 | ||
| Fig. 2 SEM images of the Cu3(BTC)2 synthesized in water/ethanol mixtures with ethanol volume ratios of 33% (a), 50% (b), 67% (c), 75% (d) and 100% (e). | ||
3.3 FT-IR spectra
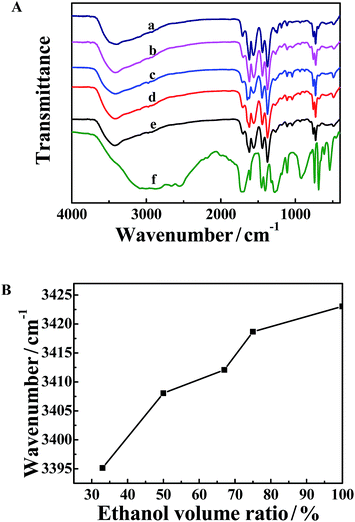
The FT-IR spectra of the five MOFs synthesized in water/ethanol mixtures with different ethanol volume ratios are shown in Fig. 3A. The characteristic asymmetric (1618 cm−1 and 1559 cm−1) and symmetric (1442 cm−1 and 1374 cm−1) vibrations of carboxylate anions in deprotonated H3BTC are clearly observed (curves a–e). The wavenumber gap between the asymmetric and symmetric vibrations of the carboxylate anions is narrowed, compared to that of H3BTC (curve f). It indicates that the carboxylate groups of BTC are coordinated to Cu(II) ions.8,34 A large broad band occurs at about 3400 cm−1, which can be assigned to the stretching vibration of the OH group from solvent (water and ethanol) molecules trapped within the MOF pores.35–37 Obviously, the absorption of the MOF synthesized in water/ethanol mixtures with more ethanol moves to higher wavenumber. Fig. 3B shows the dependence of the wavenumber of the –OH stretching vibration on the ethanol volume ratio, from which a blue shift with increasing ethanol content can be clearly observed. It indicates that less solvent is entrapped in the pores of the MOF synthesized in the mixtures with more ethanol.3.4 Thermogravimetric analysis
Fig. 4 shows the thermogravimetric curves of the Cu3(BTC)2 synthesized in water/ethanol mixtures with different ethanol volume ratios. The first stage of weight loss (about 3%) in the temperature range of 40–100 °C corresponds to the physical desorption of surface adsorbed water and ethanol.38 The second stage of weight loss occurred in the temperature range 100–245 °C, resulting from the desorption of solvent molecules adsorbed in the MOF pores. The weight loss was 16.8%, 15%, 11.3%, 10.5%, and 9.5% for the MOFs synthesized in water/ethanol mixtures with ethanol volume ratios of 33%, 50%, 67%, 75% and 100%, respectively. Evidently, the weight loss of the adsorbed solvent is less for the MOFs synthesized in the mixtures with more ethanol. The TG results are consistent with the FT-IR result that the –OH stretching vibration moves to a higher wavenumber due to a lower amount of solvent entrapped in the MOF pores. As shown in Fig. 4, the third weight loss at over 300 °C corresponds to the structural decomposition of Cu3(BTC)2 to CuO and volatile compounds.39,40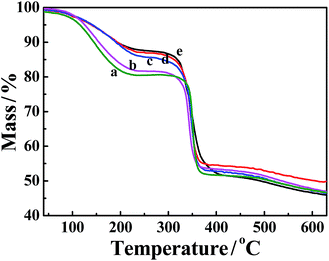 | ||
| Fig. 4 TG curves of the Cu3(BTC)2 synthesized in water/ethanol mixtures with ethanol volume ratios of 33% (a), 50% (b), 67% (c), 75% (d) and 100% (e). | ||
3.5 Porosity properties
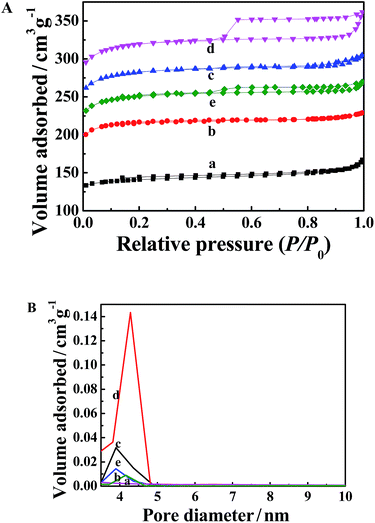
The porosity of the MOFs was determined using a N2 adsorption–desorption method after the samples were degassed at 120 °C overnight. As shown in Fig. 5A, the N2 adsorption–desorption isotherms of the MOFs synthesized in the water/ethanol mixture with low ethanol content show a typical type I mode (curves a–c). As the ethanol volume ratio is increased to or higher than 75%, the N2 adsorption–desorption isotherms exhibit a mode of type IV with a pronounced adsorption–desorption hysteresis loop of type H4, corresponding to mesoporous and microporous materials (curves d and e). The BET (Brunauer, Emmett and Teller) surface area (SBET) and total pore volume (Vt) of the MOFs are listed in Table 1. Both the SBET and Vt values increased with an increase in the ethanol volume ratio, which can be attributed to the decreased particle size. When the ethanol volume ratio reached 75%, the largest SBET value of 1067 m2 g−1 and Vt value of 0.52 cm3 g−1 were obtained. It is noteworthy that the SBET and Vt values of the MOF synthesized in pure ethanol are lower than those of the MOF formed in the mixture with an ethanol volume ratio of 75%. Although the MOF synthesized in pure ethanol has the smallest particle size, the aggregation of the particles (Fig. 2e) may be responsible for the dropped porosity. All the as-synthesized MOFs display SBET and Vt values higher than those of the first reported HKUST-1 (SBET = 692 m2 g−1, Vt = 0.33 cm3 g−1),24 except sample a.| Sample | d/nm | SBET/m2 g−1 | Vt/cm3 g−1 | Dmeso/nm |
|---|---|---|---|---|
| a | 300 | 470 | 0.25 | 7.2 |
| b | 60 | 724 | 0.35 | 4.3 |
| c | 40 | 946 | 0.46 | 4.4 |
| d | 30 | 1067 | 0.52 | 4.4 |
| e | 20 | 837 | 0.40 | 3.9 |
The mesopore size distribution curves, calculated using Barrett–Joyner–Halenda analysis, are shown in Fig. 5B. The mesopore size of the five MOFs roughly decreased with an increase in the ethanol volume ratio, which can be clearly seen from Table 1. The above analysis proves that the porosity properties of the MOFs can be tuned by the easy control of the ethanol volume ratio.
For comparison, the N2 adsorption–desorption isotherms of the samples synthesized in water/ethanol mixtures with ethanol volume ratios of 0 and 25% were determined and the results are shown in Fig. S1.† The SBET values of the two samples are extremely low (8 m2 g−1 and 11 m2 g−1, respectively). This could be due to the destroyed crystal structure of the Cu3(BTC)2 and the loss of porous properties, which is consistent with the XRD results that Cu3(BTC)2 cannot be formed in water/ethanol mixtures with ethanol volume ratios smaller than 33%.
3.6 Intermolecular interactions
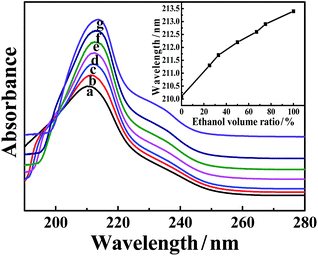
The above results reveal that the solvent properties determine the formation and properties of the as-synthesized MOFs. To gain information on the mechanism, the interactions between the solvent molecules and the organic ligand H3BTC were investigated using UV-vis spectra.41,42 Fig. 6 shows the UV-vis spectra of H3BTC dissolved in water/ethanol mixtures with different ethanol volume ratios. The maximum absorption wavelength of the H3BTC molecule is red-shifted with an increase in the ethanol volume ratio, which can be clearly observed from the inset of Fig. 6. This indicates that the interactions between the solvent molecules and H3BTC molecules are weakened with increasing ethanol content. Two reasons can explain this phenomenon. One reason is that the hydrogen bonding interaction between water and H3BTC is stronger than that between ethanol and H3BTC. Consequently, with increasing ethanol content, the interaction between the solvent molecules and H3BTC molecules is reduced. Another reason is from the solvent itself. It has been recognized that water–alcohol molecular clusters are formed in water/ethanol mixtures due to the strong hydrogen bonding interactions.43–45 It is suggested that the strong interaction between the water and ethanol molecules would weaken the interaction between the water and H3BTC molecules. The reduced interactions between solvent and H3BTC is favorable for the coordination of the organic ligand with metal ions, thus promoting MOF formation in a water/ethanol mixture as the ethanol content reaches a certain value.3.7 Mechanism
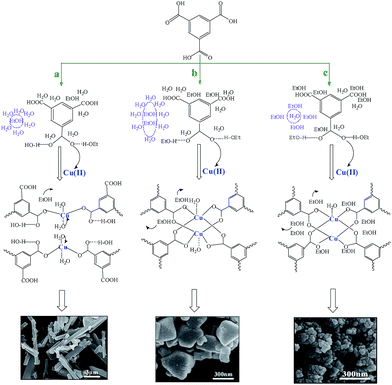
Based on the above results and discussion, a possible mechanism for MOF formation and property modulation in water/ethanol mixtures is proposed in Scheme 1. With a small amount of ethanol in water, water/ethanol clusters like (H2O)mEtOH are formed. The massive water molecules form hydrogen bonding interactions with H3BTC, preventing the approach of the carboxylate groups to Cu(II). At this stage, the amount of ethanol is too low to influence the interactions between the water molecules and ligands. As a result, Cu(II) is unable to coordinate with the organic ligand effectively and the Cu3(BTC)2 MOF cannot form (Scheme 1a). When the ethanol volume ratio reaches 33%, more water molecules may occupy the space around ethanol molecules, resulting in clusters like (H2O)m(EtOH)n. The reduced interactions between the water molecules and H3BTC guarantee that the carboxylate groups of H3BTC coordinate to Cu(II) effectively. Therefore, Cu3(BTC)2 nanoparticles come into being (Scheme 1b). With more ethanol added into the system, most water molecules are surrounded by ethanol molecules, forming clusters in the form of H2O(EtOH)n. The coordination of H3BTC with Cu(II) is thus greatly facilitated. The nucleation rate becomes higher, which is favorable for the formation of smaller MOF nanocrystals (Scheme 1c).Conclusions
In this study, we explored the formation of Cu3(BTC)2 in water/ethanol solvent systems. In the absence of ethanol or with a small amount of ethanol in water, the Cu3(BTC)2 MOF cannot form. However, as the ethanol amount reaches a high enough value (>30 vol%), the Cu3(BTC)2 MOF can be obtained in the mixed solvent at room temperature. The as-synthesized Cu3(BTC)2 crystals have average size in the range of 20–300 nm, which can be adjusted through controlling the composition of the mixed solvent. It was demonstrated that the hydrogen bonding strength between the solvent molecules and ligands determines the formation and properties of the Cu3(BTC)2. This work provides a new insight into the solvent effect on MOF formation, which is especially meaningful for the synthesis of water-sensitive MOF in an aqueous medium. We hope that more wide research on adjusting the self-assembly of MOFs by varying the solvent properties will be triggered in the future.Acknowledgements
We thank the National Natural Science Foundation of China (21173238, 21133009, U1232203, 21373230 and 21321063) and the Chinese Academy of Sciences (KJCX2.YW.H16).Notes and references
- J. J. Goings, S. M. Ohlsen, K. M. Blaisdell and D. P. Schofield, J. Phys. Chem. A, 2014, 118, 7411 CrossRef CAS PubMed.
- S. Q. Ma, D. F. Sun, J. M. Simmons, C. D. Collier, D. Q. Yuan and H. C. Zhou, J. Am. Chem. Soc., 2008, 130, 1012 CrossRef CAS PubMed.
- H. Furukawa, N. Ko, Y. B. Go, N. Aratani, S. B. Choi, E. Choi, A. O. Yazaydin, R. Q. Snurr, M. O’Keeffe and J. Kim, Science, 2010, 329, 424 CrossRef CAS PubMed.
- T. Rodenas, I. Luz, G. Prieto, B. Seoane, H. Miro, A. Corma, F. Kapteijn, F. X. L. I. Xamena and J. Gascon, Nat. Mater., 2015, 14, 48 CrossRef CAS PubMed.
- K. M. L. Taylor-Pashow, J. Della Rocca, Z. G. Xie, S. Tran and W. B. Lin, J. Am. Chem. Soc., 2009, 131, 14261 CrossRef CAS PubMed.
- W. J. Rieter, K. M. Pott, K. M. L. Taylor and W. B. Lin, J. Am. Chem. Soc., 2008, 130, 11584 CrossRef CAS PubMed.
- L. E. Kreno, K. Leong, O. K. Farha, M. Allendorf, R. P. Van Duyne and J. T. Hupp, Chem. Rev., 2012, 112, 1105 CrossRef CAS PubMed.
- L. Peng, J. L. Zhang, Z. M. Xue, B. X. Han, X. X. Sang, C. C. Liu and G. Y. Yang, Nat. Commun., 2014, 5, 5465 CrossRef PubMed.
- A. Corma, H. Garcia and F. X. L. I. Xamena, Chem. Rev., 2010, 110, 4606 CrossRef CAS PubMed.
- J. Lee, O. K. Farha, J. Roberts, K. A. Scheidt, S. T. Nguyen and J. T. Hupp, Chem. Soc. Rev., 2009, 38, 1450 RSC.
- Y. F. Yue, Z. A. Qiao, P. F. Fulvio, A. J. Binder, C. C. Tian, J. H. Chen, K. M. Nelson, X. Zhu and S. Dai, J. Am. Chem. Soc., 2013, 135, 9572 CrossRef CAS PubMed.
- X. R. Hao, X. L. Wang, K. Z. Shao, G. S. Yang, Z. M. Su and G. Yuan, CrystEngComm, 2012, 14, 5596 RSC.
- X. Zhou, P. Liu, W. H. Huang, M. Kang, Y. Y. Wang and Q. Z. Shi, CrystEngComm, 2013, 15, 8125 RSC.
- H. Q. Du, J. F. Bai, C. Y. Zuo, Z. F. Xin and J. B. Hu, CrystEngComm, 2011, 13, 3314 RSC.
- S. R. Bajpe, C. E. A. Kirschhock and A. Aerts, Chem.–Eur. J., 2010, 16, 3926 CrossRef CAS PubMed.
- Z. M. Xue, J. L. Zhang, L. Peng, B. X. Han, T. C. Mu, J. S. Li and G. Y. Yang, ChemPhysChem, 2014, 15, 85 CrossRef CAS PubMed.
- H. L. Guo, Y. Z. Zhu, S. Wang, S. Q. Su, L. Zhou and H. J. Zhang, Chem. Mater., 2012, 24, 444 CrossRef CAS.
- W. J. Son, J. Kim, J. Kim and W. S. Ahn, Chem. Commun., 2008, 6336 RSC.
- J. Y. Ye and C. J. Liu, Chem. Commun., 2011, 47, 2167 RSC.
- X. Q. Cheng, A. F. Zhang, K. K. Hou, M. Liu, Y. X. Wang, C. S. Song, G. L. Zhang and X. W. Guo, Dalton Trans., 2013, 42, 13698 RSC.
- C. Y. Sun, S. X. Liu, D. D. Liang, K. Z. Shao, Y. H. Ren and Z. M. Su, J. Am. Chem. Soc., 2009, 131, 1883 CrossRef CAS PubMed.
- Y. Qi, F. Luo, Y. X. Che and J. M. Zhen, Cryst. Growth Des., 2008, 2, 606 Search PubMed.
- N. ul Qadir, S. A. M. Said and H. M. Bahaidarah, Microporous Mesoporous Mater., 2014, 201, 61 CrossRef PubMed.
- S. S. Y. Chui, S. M. F. Lo, J. P. H. Charmant, A. G. Orpen and I. D. Williams, Science, 1999, 283, 1148 CrossRef CAS.
- S. Xiang, W. Zhou, J. M. Gallegos, Y. Liu and B. Chen, J. Am. Chem. Soc., 2009, 131, 12415 CrossRef CAS PubMed.
- M. H. Pham, G. T. Vuong, F. G. Fontaine and T. O. Do, Cryst. Growth Des., 2012, 12, 1008 CAS.
- L. B. Sun, J. R. Li, J. Park and H. C. Zhou, J. Am. Chem. Soc., 2012, 134, 126 CrossRef CAS PubMed.
- Y. Wu, F. Li, W. Zhu, J. Cui, C. Tao, C. Lin, P. M. Hannam and G. Li, Angew. Chem., Int. Ed., 2011, 50, 12518 CrossRef CAS PubMed.
- C. Carbonell, I. Imaz and D. Maspoch, J. Am. Chem. Soc., 2011, 133, 2144 CrossRef CAS PubMed.
- E. Soubeyrand-Lenoir, C. Vagner, J. W. Yoon, P. Bazin, F. Ragon, Y. K. Hwang, C. Serre, J. S. Chang and P. L. Llewellyn, J. Am. Chem. Soc., 2012, 134, 10174 CrossRef CAS PubMed.
- R. Ameloot, F. Vermoortele, J. Hofkens, F. C. D. Schryver, D. E. De Vos and M. B. J. Roeffaers, Angew. Chem., Int. Ed., 2013, 52, 401 CrossRef CAS PubMed.
- G. Majano, O. Martin, M. Hammes, S. Smeets, C. Baerlocher and J. Perez-Ramirez, Adv. Funct. Mater., 2014, 24, 3855 CrossRef CAS PubMed.
- J. J. Low, A. I. Benin, P. Jakubczak, J. F. Abrahamian, S. A. Faheem and R. R. Willis, J. Am. Chem. Soc., 2009, 131, 15834 CrossRef CAS PubMed.
- Y. J. Zhao, J. L. Zhang, B. X. Han, J. L. Song, J. S. Li and Q. A. Wang, Angew. Chem., Int. Ed., 2011, 50, 636 CrossRef CAS PubMed.
- H. X. Guo, F. Lin, J. H. Chen, F. M. Li and W. Weng, Appl. Organomet. Chem., 2015, 29, 12 CrossRef CAS PubMed.
- K. L. Zhang, F. Zhou, L. M. Yuan, G. W. Diao and S. W. Ng, Inorg. Chim. Acta, 2009, 362, 2510 CrossRef CAS PubMed.
- P. X. Chen, G. P. Yang, L. Hou, Y. Y. Wang and Q. Z. Shi, J. Coord. Chem., 2012, 65, 2893 CrossRef CAS.
- L. Peng, J. L. Zhang, J. S. Li, B. X. Han, Z. M. Xue and G. Y. Yang, Chem. Commun., 2012, 48, 8688 RSC.
- K. L. Zhang, W. Liang, Y. Chang, L. M. Yuan and S. W. Ng, Polyhedron, 2009, 28, 647 CrossRef CAS PubMed.
- H. W. Yang, S. Orefuwa and A. Goudy, Microporous Mesoporous Mater., 2011, 143, 37 CrossRef CAS PubMed.
- I. Bolz and S. Spange, Chem.–Eur. J., 2008, 14, 9338 CrossRef CAS PubMed.
- J. L. Zhang, B. X. Han, Y. J. Zhao, J. S. Li and G. Y. Yang, Chem.–Eur. J., 2011, 17, 4266 CrossRef CAS PubMed.
- S. Dixit, J. Crain, W. C. K. Poon, J. L. Finney and A. K. Soper, Nature, 2002, 416, 829 CrossRef CAS PubMed.
- E. J. W. Wensink, A. C. Hoffmann, P. J. van Maaren and D. van der Spoel, J. Chem. Phys., 2003, 119, 7308 CrossRef CAS PubMed.
- A. Wakisaka and K. Matsuura, J. Mol. Liq., 2006, 129, 25 CrossRef CAS PubMed.
Footnote |
| † Electronic supplementary information (ESI) available. See DOI: 10.1039/c5ra02440d |
| This journal is © The Royal Society of Chemistry 2015 |

