Cadmium selenide quantum dots solar cells featuring nickel sulfide/polyaniline as efficient counter electrode provide 4.15% efficiency
Gentian Yue†
*a,
Furui Tan†a,
Jihuai Wub,
Fumin Lia,
Jianming Linb,
Miaoliang Huangb and
Weifeng Zhanga
aKey Laboratory of Photovoltaic Materials of Henan and School of Physics & Electronics, Henan University, Kaifeng 475004, China. E-mail: yuegentian@henu.edu.cn; Tel: +86 371 23881602
bInstitute of Material Physical Chemistry, Huaqiao University, Quanzhou 362021, China
First published on 21st April 2015
Abstract
Nickel sulfide decorated polyaniline (NiS/PANI) co-deposition onto fluorine-doped tin oxide (FTO) substrate using an in situ electropolymerization route and served as the counter electrode (CE) for polysulfide electrolyte in cadmium selenide (CdSe) quantum dots sensitized solar cells (QDSSCs). The NiS/PANI CE provided great electrocatalytic activity and lower charge-transfer resistance compared to the platinum (Pt), NiS and PANI CEs under the same preparation conditions prepared using cyclic voltammetry (CV), electrochemical impedance spectroscopy (EIS), and Tafel polarization plots characterization. It was because the photoanode was modified with a TiO2 dense layer and thioglycolic acid that the QDSSC exhibited an improved fill factor and short-circuit current density. Under optimum conditions, the QDSSC featuring a NiS/PANI counter electrode provided an enhanced power conversion efficiency of 4.15% under an illumination of 100 mW cm−2.
1. Introduction
Quantum dots sensitized solar cells (QDSSCs) have attracted increasing interest because the quantum dots have presented the possibility of band gap tunability, high extinction coefficient, large intrinsic dipole moments, and potential processes of multiple exciton generation.1–4 Generally, QDs that absorb light in the visible region, such as cadmium sulfide (CdS), cadmium selenide (CdSe), lead selenide (PbSe), and lead sulfide (PbS) QDs, have served as sensitizer in solar cells.5–8 The advantages of the QDs compared to conventional dyes are their quantum-confinement effect, Auger recombination, and the miniband effect.9–12 However, the reported conversion efficiency of QDSSCs is still far below their theoretical value (44%) and that of the DSSCs.13–15 One major challenge in this field is how to assemble QDs into the mesoporous TiO2 matrix to obtain a well-covered monolayer and the energy losses that occur at the interface of the counter electrode and electrolyte, which result in low short-circuit current and open-circuit photovoltage.16,17 To further increase the photovoltaic efficiency of QDSSCs, it appears that it will be necessary to develop new types of efficient counter electrodes (CEs) matched well with the QDs and electrolyte, which would resolve the severe problem of inner energy loss in QDSSCs and improve the fill factor.In general, platinum (Pt) and gold (Au) CEs are not ideal catalytic materials in polysulfide electrolyte, mainly because their surface activity and conductivity are suppressed as a result of adsorption of the sulfur atoms.18,19 Therefore, metal sulfides such as cobalt sulfide (CoS), nickel sulfide (NiS), and copper sulfide (CuS) have become promising candidates as catalysts for polysulfide redox reactions in photoelectrochemical cells. Cu2S20 and carbon based nanomaterials21 have been used as CEs in QDSSCs; the fill factors of the QDSSCs were nearly 50%. Yang and co-workers fabricated CdS/CdSe QDSSCs featuring a cobalt sulfide (CoS) CE that obtained power conversion efficiency (PECs) as high as 3.4%.22 Furthermore, the composite materials consisting of carbon materials, organic conducting polymers or transition metal compounds with great electrocatalytic ability in an iodide/triiodide (I−/I3−) electrolyte served as CEs in DSSCs and achieved an enhanced power conversion efficiency.23–26 It can be inferred that the electrocatalytic property of the composite CEs made from organic conducting polymers and metal sulfides will be improved greatly thinking along this line.
Thus, a novel nickel sulfide decorated polyaniline (NiS/PANI) composite counter electrode was prepared onto a fluorine-doped tin oxide (FTO) substrate using an in situ electropolymerization route. The NiS/PANI CE showed excellent electrocatalytic activity and low charge transfer resistance relative to that of a Pt CE in sulfide/polysulfide (S2−/Sn2−) electrolyte, which was demonstrated by the results of cyclic voltammetry (CV) and electrochemical impedance spectroscopy (EIS). A TiO2 anode surface was modified by immersing it in 0.1 M thioglycolic acid (TGA) as the bridge between the TiO2 surface and the QDs. Next, CdSe QDs were spin-coated on a modification of the TiO2 substrate. A new QDSSC assembled with the NiS/PANI CE and polysulfide electrolyte exhibited a considerably enhanced performance in power conversion efficiency of 4.15% under an irradiation of 100 mW cm−2 (AM 1.5).
2. Experimental
2.1 Preparation of the NiS/PANI CEs
The preparation of the NiS/PANI CE using a two-step cyclic voltammetry approach is outlined as follows. First, the electrodeposition of PANI onto FTO substrate was carried out with an electrochemical analyzer system. All experiments were implemented in a three-electrode cell at room temperature (about 25 °C), including one Pt foil as counter electrode, one Ag/AgCl electrode as reference electrode and FTO substrate with an exposed area of 0.8 × 1 cm2 as the working electrode. The base polymerization solution of PANI consisted of 0.5 M aniline and 1.0 M perchloric acid (HClO4) solution. A constant potential of −1.2 V vs. Ag/AgCl was employed for the electrodeposition of PANI onto the FTO substrate. The obtained PANI CE was put into anhydrous ethanol for 0.5 h and then modified by 4-ATP/ethanol solution for 10 min and in vacuum oven at 80 °C for 12 h. Second, the obtained PANI CE as the working electrode was soaked in 0.05 M nickel(II) chloride hexahydrate (NiCl2·6H2O, 98%) and 1.0 M thiourea (TU, ≥99.0%) solution to carry out the deposition procedure. The FTO coated with NiS/PANI film was put into anhydrous ethanol for 0.5 h and vacuum oven at 80 °C for 12 h. Then, the NiS/PANI counter electrode was obtained. For comparison, the Pt, PANI and NiS electrodes were prepared using a similar three-electrode system under the same parameter setting. The Pt electrode was obtained from 0.01 M H2PtCl6 ethanol solution to carry out the electrodeposition procedure.2.2 Synthesis of CdSe QDs
CdSe QDs were synthesized as follows. A cadmium (Cd) precursor solution (1 mmol of cadmium oxide dissolved in 3 ml of oleic acid together with 3 g tri-n-octylphosphine oxide) was heated to 140 °C for 1 h under nitrogen protection. In another flask, a selenium (Se) source solution was formed by dissolving 1.0 mmol of Se powder in 3 ml tri-n-octylphosphine. The Cd stock solution was heated to 260 °C, and then the Se solution was quickly injected. The reaction proceeded for 3–4 min at 260 °C to produce CdSe QDs with a diameter of 3–4 nm. The CdSe QDs were purified with chlorobenzene/ethanol solvent/antisolvent for at least four times and was finally dissolved in chlorobenzene.2.3 Fabrication of QDSSC
A TiO2 anode was prepared as in our previous studies.27,28 The obtained TiO2 anode with a dense layer was modified by TGA, which was commonly used as the bridge between the TiO2 anode surface and the QDs.29 The CdSe QDs was spin-coated on modification of the TiO2 substrate at 500 rpm for 10 s and at 1500 rpm for 30 s. Four spin-coating processes were carried out on the substrate. Thus, the CdSe-sensitized TiO2 anode with thickness of 2–3 μm was obtained. The QDSSC was fabricated by injecting the S2−/Sn2− electrolyte (methanol and distilled water solution (vol ratio: 7/3) containing 2 M S, 0.5 M Na2S and 0.2 M KCl) in the aperture between the CdSe-sensitized TiO2 electrode and the NiS/PANI CE. The two electrodes were clipped together and wrapped with thermoplastic hot-melt Surlyn.2.4 Characterization
The surface morphology of the sample was observed using a JSM-7001F field emission scanning electron microscope (SEM). The morphology of CdSe nanoparticles was confirmed by transmission electron microscopy (TEM) using a Hitachi H-800 (Hitachi, Ltd., Tokyo, Japan) at an acceleration voltage of 80 kV. CV measurements of the samples were taken in a three-electrode one-compartment cell with the sample electrode as working electrode, a Pt foil as counter electrode and Pt wire as reference electrode dipped in the S2−/Sn2− electrolyte. CV and EIS were conducted by the use of a computer-controlled electrochemical analyzer (CHI 660E, Shanghai Chenhua Device Company, China) (scan conditions: 40–200 mV s−1). The electrolyte used in the QDSSC test was also injected into the dummy cells for the EIS measurements. EIS was carried out under the simulating open-circuit conditions at ambient atmosphere, sealing with thermoplastic hot-melt Surlyn and leaving an exposed area of 0.64 cm2. The frequency of applied sinusoidal AC voltage signal was varied from 0.1 Hz to 105 Hz and the corresponding amplitude was kept at 5 mV in all cases.The photovoltaic test of QDSSC with an exposed area of 0.4 × 0.5 cm2 was carried out by measuring the photocurrent–photovoltage (J–V) characteristic curve under a white light irradiation of 100 mW cm−2 (AM 1.5 G) from the solar simulator (XQ-500 W, Shanghai Photoelectricity Device Company, China) in ambient atmosphere. The fill factor (FF) and the photo-electric conversion efficiency (PCE) of QDSSC were calculated according to the following equations:
 | (1) |
 | (2) |
3. Results and discussions
3.1 Surface morphology and composition of the samples
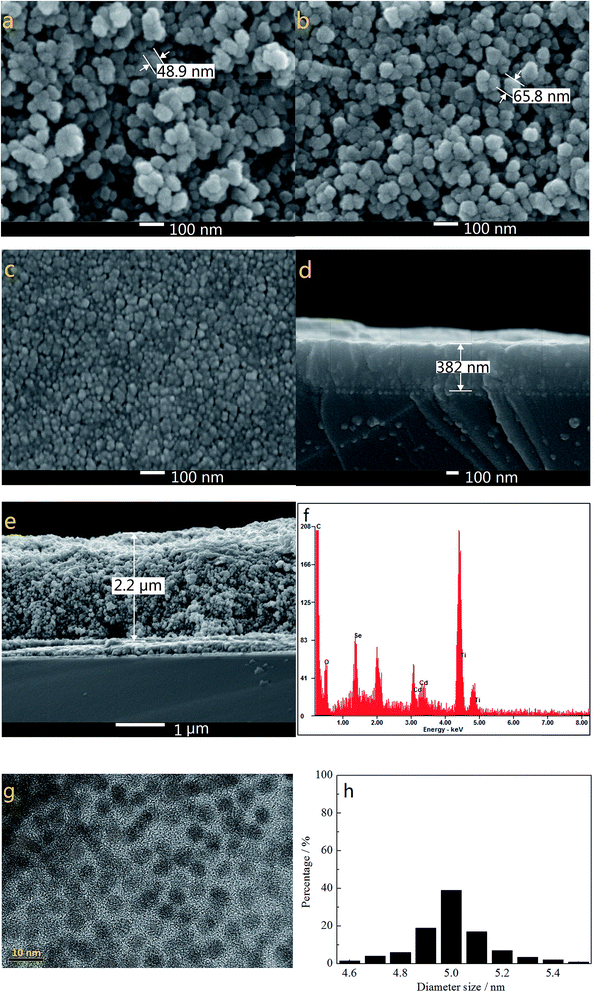
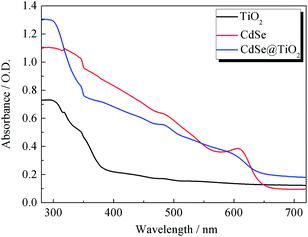
Fig. 1a and b show the SEM images of TiO2 films without and with modification of TGA and CdSe QDs. As the electron-extracting layer, the porous and loose nanostructure of pure TiO2 film (particle size of ∼49 nm in diameter as highlighted in Fig. 1a) with a thickness of about 2.2 μm (Fig. 1e) allows a large amount of S2−/Sn2− electrolyte to permeate into the TiO2 film and make good contact with the counter electrode. The TGA decorated CdSe@TiO2 nanoparticles with a larger size (particle size of ∼65 nm in diameter as shown in Fig. 1b) than that of the pure TiO2 nanoparticles indicate that TGA and CdSe QDs have successfully coated the TiO2 nanoparticles. The TiO2 dense layer with a thickness of about 382 nm and size of about 20 nm (Fig. 1c and d) was prepared using a spin-coating method to reduce the charge recombination and improve the fill factor of the QDSSC. The EDS analysis for the CdSe@TiO2 electrode modification by TGA was carried out to identify the compositions of the samples. Fig. 1f indicates the presence of C, O, Ti, Se, S and Cd elements in the CdSe@TiO2 electrode. Among the elements, the large amount of Ti and O are responsible for the TiO2, and C element comes from the carbon double-sided tape; a little S comes from the TGA modification on the TiO2 surface; Se and Cd elements are provided by the CdSe QDs. The results further demonstrate that the CdSe@TiO2 electrode was successfully prepared by means of the facile route on FTO substrate. Furthermore, Fig. 1g and h display the TEM image of the CdSe QDs and the histogram analysis of particle size distribution. It can be seen that CdSe QDs with spherical structure have uniform shape and size, including predominantly them with diameter size of about 5.0 nm.The UV-vis absorption spectra of TiO2, CdSe and CdSe@TiO2 are displayed in Fig. 2. As expected, TiO2 has no absorption band in the visible range and shows a characteristic spectrum, with its fundamental absorption of Ti–O bond in the ultraviolet light range from 300 to 400 nm. CdSe QDs show their absorption range from 575 to 669 nm and distinct exciton absorption near 610 nm. Thus, the band gap calculated from the absorption edge is about 1.81 eV and the mean size of CdSe crystallites estimated from the excitonic peak is about 5.1 nm, which is well consistent with the histogram analysis of particle size distribution made from the TEM images. The CdSe@TiO2 sample shows a phenomenon of light absorption superposition, in which the former band from 300 to 400 nm is assigned to the characteristic absorption of TiO2, and the latter band with an absorption peak of 609 nm is attributed to the electron transition from the valence bond (HOMO) to the conduction band (LUMO) of CdSe QDs. Consequently, the light response of CdSe QDs will help to increase the concentration of photo-generated excitons so that a larger photocurrent is expected after the excitons are split at the interface of the hybrid bulk-heterojunction.30–32
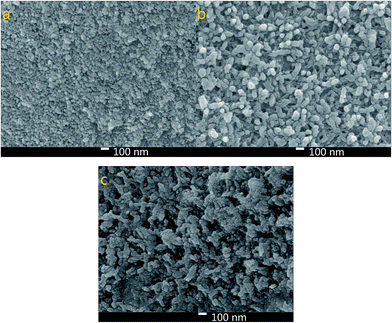
Fig. 3 shows the morphology of the NiS, PANI and NiS/PANI CEs. Fig. 3a exhibits NiS nanoparticles with a size of about 40 nm uniformly arranged on the FTO substrate with a perfectly smooth surface. Fig. 3b displays the PANI film composed of highly uniform and rough nanofibers with a diameter of 53.8 nm prepared using the electrochemical deposition method. To effectively utilize the large active surface area of the PANI nanofibers and greatly improve contact between the electrolyte and the CE, the composite film consisted of PANI loading NiS is synthesized using an electropolymerization approach. Notably, after loading NiS onto the PANI surface, the diameter of NiS/PANI increases to about 100 nm, as shown in Fig. 3c. The NiS/PANI CE with network structure provides highly effective contact between the CE and the S2−/Sn2− electrolyte and thus will possibly improve the penetration of S2−/Sn2− electrolyte into the NiS/PANI film and ultimately produce an enhanced performance for QDSSC.
3.2 Electrochemical properties
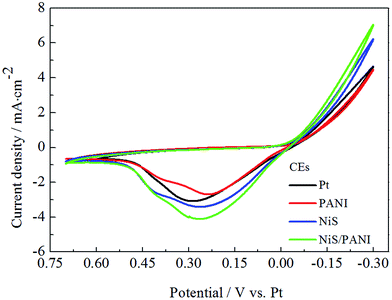
Fig. 4 presents the CVs of the Pt, NiS, PANI and NiS/PANI CEs under the S2−/Sn2− electrolyte system at a scan rate of 50 mV s−1. In the literature, although the exact chemical species and chemical mechanisms involved in a polysulfide electrolyte are very complicated and presently not well understood, it was reported that S2− has an intimate relationship with hole-recovery in a photoelectrochemical system.33 The oxidized QDs are reduced back by S2− ions in the electrolyte, the presence of sulfur simultaneously reacts with S2−, leading to the formation of polysulfide (Sn2−, n = 2–5), and the produced Sn2− ions are then reduced at the CE; the Sn2− plays as an electron acceptor to receive electrons from the counter electrode. Thus, redox reactions both at the photoanode and at the CE can be represented through the following reactions:34,35| Sn + 2e− → Sn2− | (3) |
| Sn2− + 2e− → Sn−12− + S2− | (4) |
Consequently, the peaks in the CV curves quantitatively explain the catalytic reaction at the interface of the CE/electrolyte as follows. To the best of our knowledge, in CV curves, the cathodic peak current density (Ipc) and the cathodic peak potentials (Vpc) are vital for the performance of CE and QDSSC, in which the Ipc is positively correlated with the reaction rate of the catalyst, and Vpc is inversely correlated with the electrocatalytic activity of the CEs. The high Ipc indicates good electrocatalytic ability for CE in S2−/Sn2− electrolyte. It is noticed that the NiS/PANI electrode shows the highest Ipc compared to that of the Pt, NiS and PANI electrodes in Fig. 4, indicating the NiS/PANI electrode effectively acted as a catalyst in the reaction of the S2−/Sn2− redox couples. Moreover, the Ipc of the Pt electrode is lower than that of the NiS electrode. This indicates that the NiS CE has a better electrocatalytic ability than that of the Pt electrode because of their selective and strong adsorbance of sulfur compounds onto the Pt CE surface. The NiS and NiS/PANI CEs have a similar Vpc but it is smaller than that of the Pt electrode, indicating the excellent electrocatalytic ability of the NiS and NiS/PANI CEs in S2−/Sn2− electrolyte. Although the smallest Vpc of PANI has proved comparable to the above mentioned CEs (shown in Table 1), the catalytic activity of PANI still is the worst due to its low Ipc. Another possible reason for the enhanced catalytic activity for NiS/PANI CE includes the nanostructure having a large surface area and this could increase the catalytic activity of the CEs for polysulfide reduction. The high catalytic activity caused by the conversion rate of S2− ions is more from oxidized Sn2− ions and tends to result in high current density.22
| CEs | Rs (Ω cm2) | Rct (Ω cm2) | Zw (Ω cm2) | Ipc (mA cm−2) | Vpc (V) |
|---|---|---|---|---|---|
| Pt | 9.25 ± 0.01 | 10.47 ± 0.01 | 6.12 ± 0.01 | −3.016 ± 0.001 | 0.25 ± 0.01 |
| NiS | 9.31 ± 0.01 | 8.97 ± 0.01 | 2.72 ± 0.01 | −3.409 ± 0.001 | 0.26 ± 0.01 |
| PANI | 9.22 ± 0.01 | 11.86 ± 0.01 | 14.27 ± 0.01 | −2.721 ± 0.001 | 0.27 ± 0.01 |
| NiS/PANI | 9.38 ± 0.01 | 5.13 ± 0.01 | 1.44 ± 0.01 | −4.144 ± 0.001 | 0.23 ± 0.01 |
The typical Nyquist plots of the symmetrical Pt, NiS, PANI and NiS/PANI CEs in S2−/Sn2− electrolyte and the equivalent circuit are presented in Fig. 5, in which the series resistance (Rs) is indicated by the high frequency nonzero intercept of the real axis; the first semicircle at high frequency refers to the charge-transfer resistance (Rct) at the CE|electrolyte interface, and the second semicircle at low frequency represents the Nernst diffusion impedance (Zw) corresponding to the diffusion resistance of the redox couple in electrolyte.35,36 The Rs values of the Pt, NiS and PANI CEs are 9.25 ± 0.01, 9.31 ± 0.01 and 9.22 ± 0.01 Ω cm2, respectively, which are similar to the Rs value of the NiS/PANI electrode (9.38 ± 0.01 Ω cm2). These values reflect a good bonding strength between Pt, NiS, PANI, NiS/PANI films and FTO substrates, which will effectively conduct electrons from counter electrode to electrolyte. The Rct values of Pt, NiS, PANI and NiS/PANI CEs are found to be 10.47 ± 0.01, 8.97 ± 0.01, 11.86 ± 0.01, and 5.13 ± 0.01 Ω cm2, respectively. A lower value of Rct usually corresponds to an improvement in the electrocatalytic activity of CE, resulting in an acceleration of the higher electron transfer process at the electrolyte/CE interface.37 The Zw values of the Pt, NiS, PANI and NiS/PANI CEs are obtained to be 6.12 ± 0.01, 2.72 ± 0.01, 14.27 ± 0.01, and 1.44 ± 0.01 Ω cm2, respectively. A lower Zw value for the CE indicates higher electrolyte diffusion, fast mass transfer of the electrons, and improved performance of the QDSSC. In a word, these data show that the NiS/PANI CE is a good choice for use with the polysulfide electrolyte in QDSSC, and it offers the smallest charge-transfer resistance compared to Pt, NiS, and PANI CEs, along with superior solar cell functionality.
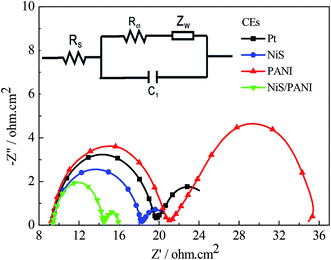 | ||
| Fig. 5 Nyquist plots of the symmetrical CEs for S2−/Sn2− electrolyte and the relevant equivalent circuit model. | ||
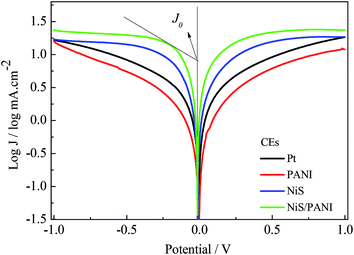
Fig. 6 exhibits the Tafel curves of Pt, NiS, PANI and NiS/PANI CEs. The curves at low potential (|U| < 0.120 V) correspond to the polarization zone and present the logarithmic current density as a function of the potential.38 The exchange current density (J0) is obtained as the intercept of the extrapolated linear region of the curve when the over-potential is zero, which is inversely related to Rct, as illustrated in eqn (5),39 and is therefore considered as a quantitative factor for evaluating the electrocatalytic activity of a CE.
 | (5) |
Thus, according to the slopes for the anodic or cathodic branches of Fig. 6, the J0 follows the order of NiS/PANI > NiS > Pt > PANI CEs, indicating most excellent electrocatalytic activity for the NiS/PANI CE in a S2−/Sn2− redox couple, which as can be logically expected, considerably improved the photovoltaic performance for QDSSC.
3.3 Photovoltaic performance of QDSSCs
Fig. 7 shows the J–V curves of the CdSe-sensitized QDSSCs with various CEs for S2−/Sn2− electrolyte under the irradiation of 100 mW cm−2. The PCEs of the QDSSCs with the Pt, NiS, PANI and NiS/PANI CEs are 2.85%, 3.11%, 2.35% and 4.15%, respectively, and their related photoelectric performance parameters are listed in Table 2. The QDSSCs display good photovoltaic performance for the introduction of the TiO2 dense layer and TGA modification of TiO2, which led to the improved charge recombination and fill factor. The QDSSCs based on the Pt and PANI CEs exhibit poor Jsc of 10.84 and 9.30 mA cm−2 due to the strong adsorption of S2− on their surface, which reduces the surface activity of Pt and PANI.40 The QDSSCs assembled with the NiS and NiS/PANI CEs exhibit the PCEs of 3.11% and 4.15%, respectively, which are higher than those of QDSSCs based on the Pt and PANI CEs. The reason for the improvement in performance for the QDSSCs possibly results from the sulfide counter electrode being well matched with QDs in polysulfide electrolyte. Simultaneously, the polysulfide adsorption on a CdSe surface also plays as an electron acceptor to receive electrons from the counter electrode. Both effects are anticipated to give a better hole-recovery rate and therefore a higher efficiency of the device. Moreover, high electrocatalytic activity and superior conductivity provided by the synergistic catalytic effect of the PANI and NiS also enhance diffusion velocity for the S2−/Sn2− redox couple, as indicated in the aforementioned CV, EIS and Tafel measurements.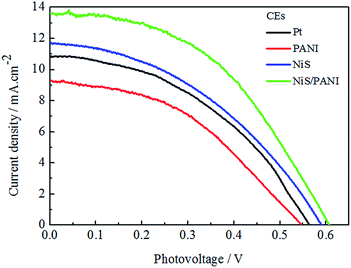 | ||
| Fig. 7 J–V characteristics of the QDSSCs fabricated with different CEs under the standard illumination. | ||
| CEs | Voc (V) | Jsc (mA cm−2) | FF | PCEs (%) | Rs (Ω cm2) | Rct1 (Ω cm2) | Rct2 (Ω cm2) |
|---|---|---|---|---|---|---|---|
| Pt | 0.56 | 10.84 | 0.47 | 2.85 | 26.35 ± 0.01 | 7.61 ± 0.01 | 24.61 ± 0.01 |
| PANI | 0.55 | 9.30 | 0.46 | 2.35 | 26.10 ± 0.01 | 18.44 ± 0.01 | 28.72 ± 0.01 |
| NiS | 0.59 | 11.71 | 0.45 | 3.11 | 26.54 ± 0.01 | 7.28 ± 0.01 | 24.75 ± 0.01 |
| NiS/PANI | 0.61 | 13.62 | 0.50 | 4.15 | 26.70 ± 0.01 | 5.39 ± 0.01 | 14.76 ± 0.01 |
3.4 EIS analysis of QDSSCs
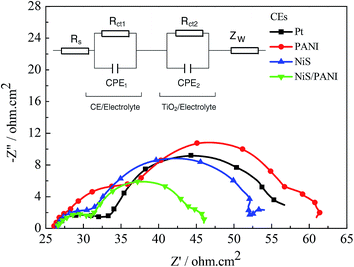
The EIS of the QDSSCs based on the Pt, PANI, NiS, and NiS/PANI CEs measured under irradiation of 100 mW cm−2 and the equivalent circuit consisting of two parallel RC circuits are both shown in Fig. 8. Their corresponding values are given in Table 2, in which the Rs, the series resistance in the QDSSCs, is the nonzero intercept on the real axis of the impedance plot, which denotes the sheet resistance of transparent conductive oxide (TCO) and the contact resistance of FTO/TiO2; Rct1 and Rct2 are the electron transfer resistances at the CE|electrolyte interface and the working electrode (WE)|electrolyte interface, respectively; Zw in the low frequency region is attributed to the Warburg impedance of the redox couple in the electrolyte.41 Fig. 8 and Table 2 indicate similar Rs value of about 26.0 Ω cm2 for the QDSSCs with the Pt, PANI, NiS, and NiS/PANI CEs. The QDSSCs based on the Pt, PANI, NiS, and NiS/PANI CEs display a Rct1 of 7.61 ± 0.01, 18.44 ± 0.01, 7.28 ± 0.01, and 5.39 ± 0.01 Ω cm2, respectively, and correspond to a Rct2 of 24.61 ± 0.01, 28.72 ± 0.01, 24.75 ± 0.01, and 14.76 ± 0.01 Ω cm2. The Rct1 and Rct2 for the device assembled with NiS/PANI CE exhibits the smallest values among the above mentioned QDSSCs due to its best electrocatalytic ability in S2−/Sn2− electrolyte. This indicates that the electrocatalytic ability of NiS/PANI CE in S2−/Sn2− electrolyte is considerably better than the others. Moreover, the smallest Rct2 (14.76 ± 0.01 Ω cm2) value of the cell with NiS/PANI CE, also obtained from Table 2, proves the best photovoltaic performance of the device with NiS/PANI-CE once again, particularly in its FF (0.50) and Jsc. This is consistent with the results of CV, EIS, Tafel and photoelectricity performance. These results reveal minimum loss of internal energy at the interface of the NiS/PANI CE and S2−/Sn2− electrolyte for the QDSSCs.4. Conclusions
A QDSSC based on the NiS/PANI CE achieves a considerably higher power conversion efficiency of 4.15% compared to that of the QDSSC with the Pt electrode (2.85%). The enhanced performance of the QDSSC is responsible for the excellent electrocatalytic ability and the reduced charge-transfer resistance (5.13 ± 0.01 Ω cm2) at the CE/electrolyte interface of the cell. The electrochemical behavior toward polysulfide electrolyte for Pt, PANI, NiS, and NiS/PANI CEs are also measured by CV, EIS and Tafel, which all show that the NiS/PANI CE possesses good catalytic behaviors and charge transport ability, thus resulting in its better photovoltaic performance for the QDSSC. Furthermore, the introduction of the TiO2 dense layer and TGA modification of TiO2 are advantageous in reducing the charge recombination and improving fill factor. Consequently, with its low cost and simplicity, we believe that the sulfide hybrid CEs have great potential for use in QDSSCs.Authors' contributions
Gentian Yue and Furui Tan carried out the experiments, participated in the sequence alignment, and drafted the manuscript. Fumin Li, Jianming Lin and Miaoliang Huang participated in the device preparation. Weifeng Zhang and Jihuai Wu helped to draft the manuscript. All authors read and approved the final manuscript.Acknowledgements
The authors are very grateful to the joint support by the National Natural Science Foundation of China (no. 61306019) and the National Natural Science Foundation of China (no. 21103041). This work is also supported by the Natural Science Foundation of Henan Educational Committee (no. 14A430023), the Scientific Research Found of Henan Provincial Department of Science and Technology (no. 132300413210) and the Natural Science Foundation of Henan University (no. 2013YBZRO47).References
- A. P. Alivisatos, Science, 1996, 271, 933–937 CAS.
- J. B. Sambur, T. Novet and B. A. Parkinson, Science, 2010, 330, 63–66 CrossRef CAS PubMed.
- M. Grätzel, Nature, 2001, 414, 338–344 CrossRef PubMed.
- H. Wang, Y. S. Bai, H. Zhang, Z. H. Zhang, J. H. Li and L. Guo, J. Phys. Chem. C, 2010, 114, 16451–16455 CAS.
- L. Li, X. Yang, J. Gao, H. Tian, J. Zhao, A. Hagfeldt and L. Sun, J. Am. Chem. Soc., 2011, 133, 8458–8460 CrossRef CAS PubMed.
- I. Robel, M. Kuno and P. V. Kamat, J. Am. Chem. Soc., 2007, 129, 4136–4137 CrossRef CAS PubMed.
- F. R. Tan, S. C. Qu, Q. W. Jiang, J. P. Liu, Z. J. Wang, F. M. Li, G. T. Yue, S. J. Li, C. Chen, W. F. Zhang and Z. G. Wang, Adv. Energy Mater., 2014, 4, 1400512 Search PubMed.
- J. J. Choi, Y. F. Lim, M. E. B. Santiago-Berrios, M. Oh, B. R. Hyun, L. F. Sun, A. C. Bartnik, A. Goedhart, G. G. Malliaras, H. D. Abruna, F. W. Wise and T. Hanrath, Nano Lett., 2009, 11, 3749–3755 CrossRef PubMed.
- S. A. Sapp, C. M. Elliott, C. Contado, S. Caramori and C. A. Bignozzi, J. Am. Chem. Soc., 2002, 124, 11215–11222 CrossRef CAS PubMed.
- S. Cazzanti, S. Caramori, R. Argazzi, C. M. Elliott and C. A. Bignozzi, J. Am. Chem. Soc., 2006, 128, 9996–9997 CrossRef CAS PubMed.
- P. Yu, K. Zhu, A. G. Norman, S. Ferrere, A. J. Frank and A. J. Nozik, J. Phys. Chem. B, 2006, 110, 25451–25454 CrossRef CAS PubMed.
- Y. Tian and T. Tatsuma, J. Am. Chem. Soc., 2005, 127, 7632–7637 CrossRef CAS PubMed.
- Y.-J. Shen and Y.-L. Lee, Nanotechnology, 2008, 19, 045602 CrossRef PubMed.
- R. Plass, S. Pelet, J. Krueger, M. Grätzel and U. Bach, J. Phys. Chem. B, 2002, 106, 7578–7580 CrossRef CAS.
- M. K. Nazeeruddin, A. Kay, I. Rodicio, R. H. Baker, E. Muller, P. Liska, N. Vlachopoulos and M. Grätzel, J. Am. Chem. Soc., 1993, 115, 6382–6390 CrossRef CAS.
- Z. Yang, C. Y. Chen, C. W. Liu and H. T. Chang, Adv. Energy Mater., 2011, 1, 259–264 CrossRef CAS PubMed.
- Z. Yang, C. Y. Chen, C. W. Liu and H. T. Chang, Chem. Commun., 2010, 46, 5485–5487 RSC.
- G. Hodes, J. Manassen and D. Cahen, J. Appl. Electrochem., 1977, 7, 181–182 CrossRef CAS.
- G. Hodes, J. Manassen and D. Cahen, J. Electrochem. Soc., 1980, 127, 544–549 CrossRef CAS PubMed.
- S. Giménez, I. Mora-Seró, L. Macor, N. Guijarro, T. Lana-Villarreal, R. Gómez, L. J. Diguna, Q. Shen, T. Toyoda and J. Bisquert, Nanotechnology, 2009, 20, 295204 CrossRef PubMed.
- S.-Q. Fan, B. Fang, J. H. Kim, J.-J. Kim, J.-S. Yu and J. Ko, Appl. Phys. Lett., 2010, 96, 063501 CrossRef PubMed.
- G. Zhu, L. Pan, T. Xu and Z. Sun, ACS Appl. Mater. Interfaces, 2011, 3, 3146–3151 CAS.
- L. J. Sun, Y. Bai and K. N. Sun, RSC Adv., 2014, 4, 42087–42091 RSC.
- G. T. Yue, J. H. Wu, Y. M. Xiao, M. L. Huang, J. M. Lin and J. Y. Lin, J. Mater. Chem. A, 2013, 1, 1495–1501 CAS.
- Z. L. Hu, K. Xia, J. Zhang, Z. Y. Hu and Y. J. Zhu, RSC Adv., 2014, 4, 42917–42923 RSC.
- G. T. Yue, X. P. Ma, Q. W. Jiang, F. R. Tan, J. H. Wu, C. Chen, F. M. Li and Q. H. Li, Electrochim. Acta, 2014, 142, 68–75 CrossRef CAS PubMed.
- J. H. Wu, Y. M. Xiao, G. T. Yue, Q. W. Tang, J. M. Lin, M. L. Huang, Y. F. Huang, L. Q. Fan, Z. Lan, S. Yin and T. Sato, Adv. Mater., 2012, 24, 1884–1888 CrossRef CAS PubMed.
- G. T. Yue, X. A. Zhang, L. Wang, F. R. Tan, J. H. Wu, Q. W. Jiang, J. M. Lin, M. L. Huang and Z. Lan, Electrochim. Acta, 2014, 129, 229–236 CrossRef CAS PubMed.
- T. Nakanishi, B. Ohtani and K. Uosakin, J. Phys. Chem. B, 1998, 102, 1571–1577 CrossRef CAS.
- A. Salant, M. Shalom, Z. Tachan, S. Buhbut, A. Zaban and U. Banin, Nano Lett., 2012, 12, 2095–2100 CrossRef CAS PubMed.
- I. V. Lightcap and P. V. Kamat, J. Am. Chem. Soc., 2012, 134, 7109–7116 CrossRef CAS PubMed.
- H. Yang, W. Fan, A. Vaneski, A. S. Susha, W. Y. Teoh and A. L. Rogach, Adv. Funct. Mater., 2012, 22, 2821–2829 CrossRef CAS PubMed.
- S. Licht, Nature, 1987, 300, 148–151 CrossRef PubMed.
- H. J. Lee, P. Chen, S.-J. Moon, F. Sauvage, K. Sivula, T. Bessho, D. R. Gamelin, P. Comte, S. M. Zakeeruddin, S. I. Seok, M. Grätzel and M. K. Nazeeruddin, Langmuir, 2009, 25, 7602–7608 CrossRef CAS PubMed.
- Y.-L. Lee and C.-H. Chang, J. Power Sources, 2008, 185, 584–588 CrossRef CAS PubMed.
- F. Fabregat-Santiago, J. Bisquert, E. Palomares, L. Otero, D. Kuang and M. Grätzel, J. Phys. Chem. C, 2007, 111, 6550–6560 CAS.
- E. Ramasamy, W. J. Lee, D. Y. Lee and J. S. Song, Electrochem. Commun., 2008, 10, 1087–1089 CrossRef CAS PubMed.
- Q. W. Jiang, G. R. Li and X. P. Gao, Chem. Commun., 2009, 6720–6722 RSC.
- M. Wang, A. M. Anghel, B. Marsan, N.-L. Cever Ha, N. Pootrakulchote, S. M. Zakeeruddin and M. Grätzel, J. Am. Chem. Soc., 2009, 131, 15976–15977 CrossRef CAS PubMed.
- H. J. Kim, D. J. Kim, S. S. Rao, A. D. Savariraj, K. S. Kyoung, M. K. Son, Ch. V. V. M. Gopi and K. Prabakar, Electrochim. Acta, 2014, 127, 427–432 CrossRef CAS PubMed.
- S. Q. Fan, B. Fang, J. H. Kim, B. Jeong, C. Kim, J. S. Yu and J. Ko, Langmuir, 2010, 26, 13644–13649 CrossRef CAS PubMed.
Footnote |
| † These authors contributed equally to this work and should be considered co-first authors. |
| This journal is © The Royal Society of Chemistry 2015 |

