Electrochemical behavior of Zn–graphene composite coatings
M. K. Punith Kumar,
Mahander Pratap Singh and
Chandan Srivastava*
Dept. of Materials Engineering, Indian Institute of Science (IISc), Bangalore-560012, India. E-mail: csrivastava@materials.iisc.ernet.in; Tel: +91-80-22932834
First published on 4th March 2015
Abstract
A Zn–graphene composite coating was electrodeposited on mild steel. The graphene was synthesized by electrochemical exfoliation of graphite. Electron microscopy, energy-dispersive X-ray spectroscopy and X-ray diffraction techniques were used to characterize the coatings. Compared to a pure Zn coating, the Zn–graphene coating exhibited reduced grain size, reduced surface defects, hillock structures over the coating surface and an altered texture. The corrosion behavior of the coatings was examined by Tafel polarization and electrochemical impedance spectroscopic methods. A significant improvement in the corrosion resistance in terms of reduction in corrosion current and corrosion rate and increase in polarization resistance was noted in the case of the Zn coating containing graphene.
1 Introduction
The sacrificial behavior of an electrodeposited Zn coating over a steel substrate is widely used to protect steel from corrosion. The life span of the Zn coating is however limited due to its rapid dissolution under aggressive environments.1 Corrosion of the Zn coating can be controlled by chromating the Zn surface or by using organic molecules as chelating agents which provide a barrier between the Zn surface and the aggressive media.2,3 These processes are however undesirable because of the generation of environmentally hazardous effluents. As an alternative to the above, Zn composite coatings in which the metal matrix is embedded with metal oxides,4 metal carbides,5 metal nitrides,6 halloysite nano tubes7 and carbon nano tubes8 etc. are being developed. These metal matrix composite coatings have revealed enhanced corrosion resistance behavior with improved mechanical properties compared to a pure zinc coating.7,9Graphene has attracted considerable attention lately due to its high electrical and thermal conductivity and excellent mechanical properties which have applications in fuel cells,10 solar cells11 and super capacitors12 etc. Use of graphene as a second phase material to generate highly corrosion resistant Ni–graphene composite coating over mild steel has been demonstrated by Kumar et. al.9 Kumar et al.9 have shown that the presence of graphene alters the morphology and texture of the deposit leading to an enhancement in the corrosion resistance of the Ni–graphene composite coating when compared to pure Ni coating.9 However is should be noted that, formation of nano/micron-defects in Ni plating can lead to the corrosion of underlying substrates like steel or magnesium because of the galvanic coupling in which Ni acts as cathode.13 Therefore for protection of Fe-based substrate like steel, Zn-based coatings are preferred over Ni-based coatings. Zn coating acts as anode and provides sacrificial protection in galvanic corrosion.14–17 Zn coating is therefore a preferred surface treatment to protect ferrous and ferrous based alloy materials from rusting.14–17 Therefore there exists a need to work towards enhancing the reliability and life span of sacrificial Zn coatings. There is no report yet on the investigation of morphology, texture and electrochemical properties of Zn–graphene composite coating. This work investigates the effect of graphene on microstructure, morphology and corrosion behavior of Zn–graphene coating. Zn–graphene composite coating was deposited over mild steel using acidic Zn sulphate bath dispersed with graphene produced by the electrochemical exfoliation method. As-fabricated Zn and Zn–graphene composite coatings were characterized and subjected to electrochemical analysis to evaluate and compare the corrosion behavior of the coatings. It was observed that the incorporation of graphene increased metal matrix growth along lower index crystallographic planes. In the case of Zn–graphene coating, a relatively higher growth along the low index planes was observed when compared to the texture of the Ni–graphene coating.9 Electrochemical analysis revealed that the incorporation of graphene significantly enhanced the corrosion resistance of the Zn–graphene coating when compared to the pure Zn coating.
2 Experimental
Two graphite rods purchased from Alfa Aesar India were used as cathode and anode for the electrochemical exfoliation process. Graphite rods were fixed parallel to each other. Exfoliation process was carried at 5 V using a simple DC source with 0.05 M NaCl as electroactive media.Information about the constituents of the plating bath and the operating conditions used for plating pure Zn and Zn–graphene composite coating is provided in Table 1(A) and (B). For producing Zn–graphene composite coating, 50 mg L−1 of graphene was added into the plating bath used for obtaining pure Zn coating. The plating bath was stirred for 18 h at 600 rpm and then sonicated for 15 min to ensure a uniform dispersion of graphene. Mild steel and Zn plate with 3.5 × 2 cm2 area were used as cathode and anode respectively. Prior to the electrodeposition process, the mild steel surface was polished using 400–3000 grit emery paper and cleaned by dipping in 10% HCl and 10% NaOH followed by water wash. The Zn plate was activated by immersing in 10% HCl for few minutes. Electrodeposition process was carried at room temperature and the plating solution was stirred at 200 rpm speed throughout the deposition process.
| (A) | |
|---|---|
| Bath composition | Concentration |
| ZnSO4 | 180 g L−1 |
| Na2SO4 | 30 g L−1 |
| NaCl | 10 g L−1 |
| CTAB | 0.05 g L−1 |
| Graphene | 50 mg L−1 |
| (B) |
|---|
| Operating parameters |
| Anode: Zn plate (99.99% pure) |
| Cathode: mild steel plate |
| Current density: 0.04 A cm−2 |
| Plating time: 15 min |
| Stirring speed: 200 rpm |
| pH: 3.5, temperature: 25 ± 2 °C |
Surface morphology of Zn and Zn–graphene composite coating was analyzed using JOEL-JEM-1200-EX II scanning electron microscope (SEM) operating at 20 kV. Secondary electron detector was used to obtain SEM micrographs. Elemental analysis of the coated samples was performed by using energy dispersive X-ray spectroscopy (EDS) analysis technique in SEM. X-ray diffraction (XRD) profiles were obtained by using X-pert pro X-ray diffractometer employing a Cu Kα radiation (λ = 0.1540 nm) source. UV-Visible absorption spectroscopic experiments were carried in 700 to 200 nm wavelength range using Perkin Elmer (Lambda 35) UV-Vis Spectrometer. Raman spectrums from the exfoliated samples were obtained using microscope setup (HORIBA JOBIN YVON, Lab RAM HR) consisting of diode-pumped solid-state laser operating at 532 nm with a charge coupled detector. Zeta potential (surface charge) of graphene dispersed in aqueous solution was determined using a Malveron zeta potential analyzer. Electrochemical corrosion analysis was performed using a CHI604E electrochemical work station with conventional three electrode cell. Coated mild steel of 1 cm2 area was working electrode and Ag/AgCl electrode and Pt wire served as reference and counter electrode respectively. 3.5% NaCl solution was used as electroactive media for corrosion studies. Electrochemical impedance data was curve fitted using ZSimp Win 3.21 software. Electrochemical experiments were repeated three times. Values of the electrochemical parameters reported in the present work were obtained from the average of values obtained from the three different experiments. It was observed that the electrochemical parameter values were highly reproducible.
3 Results and discussion
Anodic electrochemical exfoliation method was employed to prepare graphene using aqueous NaCl solution. The exfoliation of graphite was not observed in simple aqueous media, but the exfoliation process was triggered after the addition of NaCl into the aqueous media. An increase in conductivity enhanced the exfoliation. According to Liu et al.13 an applied potential of 7 V is sufficient to cause anodic oxidation along with hydroxylation and carboxylation of graphite and water hydrolysis.18 These reactions produce graphene through edge exfoliation process.18 X-ray diffraction profile obtained from the electrochemically exfoliated sample and the graphite rod is given in Fig. 1(A). UV-Visible absorption spectra obtained from the exfoliated product is provided in Fig. 1(B). The characteristic broad diffraction peak at 25° 2θ value in the XRD profile and the maximum absorption (λmax) at 270 nm wavelength in UV-Visible spectra confirmed the absence of graphene oxide and the presence of only reduced graphene in electrochemically exfoliated sample.19–21 The considerably intense 2D peak for the graphene observed in Raman spectra in Fig. 1(C) confirmed that the exfoliated sample contains few layer graphene.20 This same graphene sample was used to fabricate Zn–graphene composite coating. Defect density of graphene was determined form the ratio of the intensity of the D peak to G peak (ID/IG) in the Raman spectra. Defect density of exfoliated graphene (ID/IG = 1.12) was found to be similar to the defect density of the parent graphite rod (ID/IG = 0.97) that was used for the exfoliation experiment. Exfoliated graphene adopted the defect density of the parent graphite rod.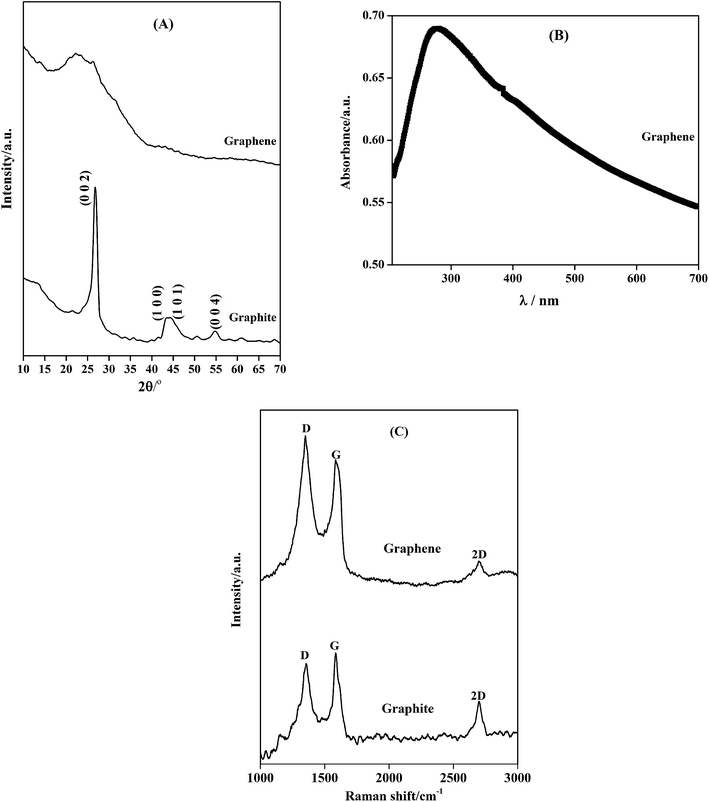 | ||
| Fig. 1 (A) XRD pattern for graphite used for electrochemical exfoliation, graphene, (B) UV-Visible absorption spectra of graphene and (C) Raman spectra of graphene and graphene source. | ||
Pure Zn and Zn–graphene composite coatings were generated at room temperature using the bath composition and operating parameter given in Table 1. The zeta potential value of graphene in the plating bath was found to be +11.8 mV. The dispersed graphene had a positive surface charge due to which it readily moved towards the negatively charged cathode and got incorporated into the growing Zn matrix. EDS spectra obtained from the Zn–graphene coating revealed the presence of ∼4 wt% carbon in the Zn matrix which indicated incorporation of graphene into the growing Zn metal matrix during the electrodeposition process. Representative SEM micrographs of Zn and Zn–graphene composite coating are provided respectively in Fig. 2(A) and (B). It was observed that pure Zn coating contained small pits on the surface of the deposit. Inset in Fig. 2(A) shows one such pit in higher magnification. These pits were however very minimal in case of Zn–graphene composite coating. Zn–graphene coating contained nearly spherical hillock structures as seen in Fig. 2(B). These hillock structures contained very fine Zn fibers as reveled by Fig. 2(B). These hillocks were completely absent in pure Zn coatings. Compositional analysis using SEM-EDS revealed that the hillocks contained greater amount of carbon (∼7.8 wt%) when compared to the amount of carbon present in the region not containing the hillocks (∼2.6 wt%). Based on this observation it is speculated that a presence of excess graphene in form of agglomerates in certain regions provided relatively larger number of heterogenous nucleation sites which produced hillock features containing fine Zn fibers.
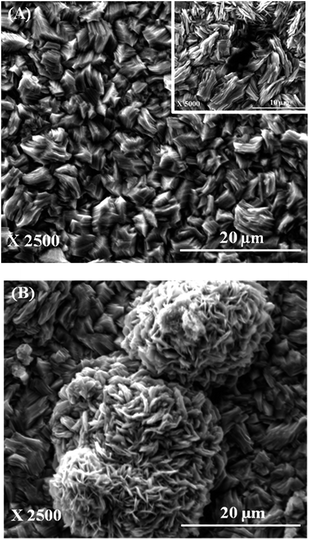 | ||
| Fig. 2 Scanning electron micrographs of (A) Zn coating (inset showing the pit) and (B) Zn–graphene composite coating. | ||
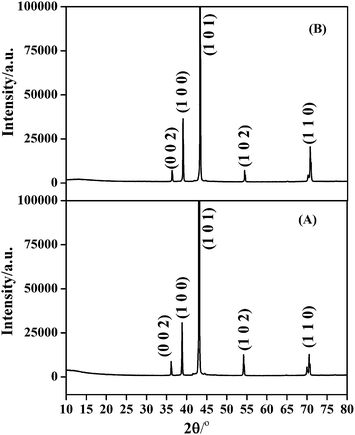
X-ray diffraction profiles obtained from Zn and Zn–graphene coating is provided in Fig. 3. Average crystallite size of the coatings calculated using Scherrer equation22 was found to be 70 nm and 62 nm respectively for Zn and Zn–graphene composite coating. Smaller grain size in case of Zn–graphene composite coating can be due to two factors. They are: (a) graphene provides a greater surface area for heterogenous nucleation and (b) graphene present in the growing metal matrix blocks the active cathode surface area which enhances the deposition potential leading to impeded crystal growth and finer grain size.23 Comparison of the XRD profiles in Fig. 3 reveals a clear difference in texture of the deposits. It has been shown in the literature that an alteration in the cathode surface energy which in this case happens due to the adsorption of graphene during Zn deposition can produce different textures.24 Texture co-efficient calculation25 results provided in Fig. 4 clearly reveal that the incorporation of graphene considerably enhances the crystal growth along 〈100〉, 〈101〉 and 〈110〉 low index crystallographic planes. This result is in accordance with the literature that the embedded second phase materials can affect the preferred orientation of the metal matrix.26,27 Absence of peak corresponding to graphene in the XRD profile of Zn–graphene composite can be due to a very low amount of graphene present or complete exfoliation of graphene stacks in the composite.
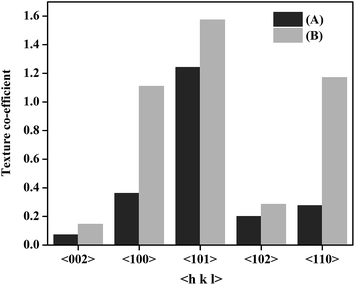 | ||
| Fig. 4 Preferred orientation of Zn crystallites in (A) Zn deposit and (B) Zn–graphene composite coating. | ||
Tafel polarization curves or potentiodynamic polarization behavior of coatings were measured at the potential of ±200 mV against the open circuit potential of the respective coating which was used as working electrode. Polarization curves of Zn and Zn–graphene coatings are provided in Fig. 5. It can be seen from the Fig. 5 that the difference in corrosion potential (Ecorr) is not significant between pure zinc and composite coating, i.e., 0.915 V and 0.920 V respectively for Zn and Zn–graphene coating. But the corrosion current (Icorr) and corrosion rate (CR) values (Icorr: 6.82 μA cm−2 and CR: 8.32 μg h−1) for Zn–graphene composite coating are considerably lower when compared to the Icorr and CR values (Icorr: 19.86 μA cm−2 and CR: 24.23 μg h−1) values for pure Zn coating. It is speculated that this difference is due to the galvanic corrosion induced by the defects present on the coating surface in pure Zn coating as shown in the inset of the Fig. 2(A). Graphene embedded zinc coating exhibited better anticorrosive behavior when compared to pure Zn coating.
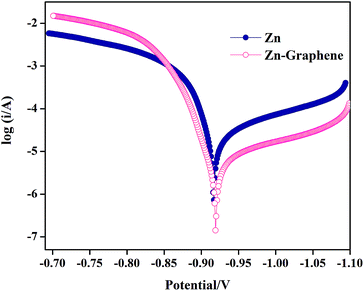 | ||
| Fig. 5 Potentiodynamic polarization curves for Zn and Zn–graphene composite coating recorded in 3.5% NaCl media against Ag/AgCl reference electrode. | ||
Electrochemical impedance spectroscopic measurements were carried out at the open circuit potential value of corresponding working electrode in the frequency range 100 kHz to 10 mHz with sinusoidal signal amplitude of 5 mV. The measured EIS data are presented as Nyquist plot in Fig. 6(A). Typical Nyquist plot shows two capacitive loops for both the deposits which suggested that the corrosion process consisted of two relaxations or two time constants. The EIS data was curve fitted with 2RC couple electrical equivalent circuit given in Fig. 6(B),7,28 and for better results the coating capacitance element was replaced with constant phase element. The high frequency elements are related to the dielectric character Qcoat of the coating that is reinforced by ionic conduction through its pores (Rcoat) and the low frequency contribution is attributed to the double layer capacitance (Cdl) at the coating electrolyte interface at the bottom of the pores coupled with the charge transfer resistance Rct.7,28 The extent of anticorrosive behavior of the coating in aggressive media can be examined by considering both the coating and charge transfer resistance i.e., the polarization resistance (Rp) which is the sum of Rcoat and Rct (i.e., Rp = Rcoat + Rct). Zn coating exhibited 388.05 Ω polarization resistance where as the Zn–graphene coating exhibited Rp value of 1021.28 Ω. On the other hand, the double layer capacitance for pure zinc coating is 626 × 10−4 F cm−2 and it is significantly decreased for composite coating i.e., 10.51 × 10⁻⁴ F cm−2. It shows that the accumulation of charge on the Zn–graphene coated surface is impeded and hence the surface activity towards corrosion was minimized by exhibiting increased polarization resistance. This confirmed that the incorporated graphene in the metal matrix provided enhanced corrosion resistance property towards the aggressive media. Enhancement of corrosion resistance can be attributed to the reduction in pit formation, alteration in microstructure and texture of the Zn deposit due to the incorporation of graphene.
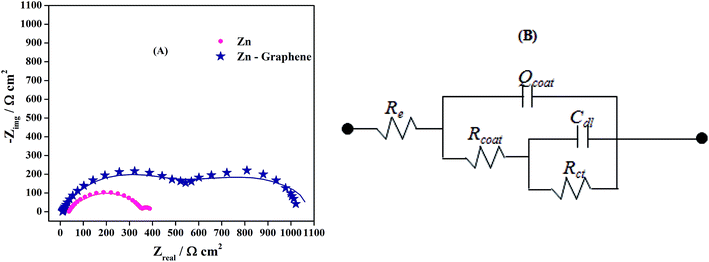 | ||
| Fig. 6 (A) Impedance Nyquist plot for Zn and Zn–graphene composite coating (line – measured data, symbol – simulated data) and (B) electrical equivalent circuit used for simulation of EIS data. | ||
Surface morphology, texture and chemical composition of the metal deposits greatly influence the corrosion behavior of the deposits under aggressive environments. Dissolution of metal atoms from the deposits depends on the crystallographic planes and the binding energy of the atoms. The deposits with a texture favoring low index crystallographic planes with higher atomic density require high energy to breakdown due to high bonding energy.29,30 In the present work, the Zn–graphene composite coating texture contains greater 〈100〉, 〈101〉 and 〈110〉 low index planes when compared to pure Zn coating. Hence, the Zn–graphene composite coating exhibits superior anticorrosive property as compared to pure Zn coating. As reported by Kumar et al.,9 in the case of Ni–graphene coating, incorporation of graphene into the Ni matrix increases the preferred orientation of the deposit along the 〈002〉 plane, makes the deposit compact and relatively finer grained as compare to the pure Ni deposit. These alterations in microstructure and morphology enhances the electrochemical corrosion behavior and hardness of the nickel–graphene coating when compared to pure Ni coating.9 Similarly, in the present work, incorporation of graphene increases the orientation of the Zn deposit along the low index crystallographic plane, decreases the surface pits and alters the microstructure all of which synergistically act to significantly enhance the corrosion resistance of the Zn–graphene coating when compared to the pure Zn coating. This result is in accordance with the reports in the literature that illustrate that the incorporation of a second phase materials to a growing metal matrix alters the deposition kinetics and influences the morphological and electrochemical properties of the deposits.4–9,25–27
4 Conclusions
A highly corrosion resistant Zn–graphene composite coating was electrodeposited on mild steel surface using Zn plating bath dispersed with 50 mg L−1 of graphene. Incorporation of graphene into Zn metal matrix impeded the formation of pits on the coating surface as observed in case of pure Zn deposit surface. Graphene also favored the formation of hillock structure over the composite coating surface. The average crystallite size was 62 nm for Zn–graphene composite coating and 70 nm for pure Zn coating. XRD curve and texture co-efficient values indicated an alteration in the texture of the coating due to the incorporation of graphene. These morphological and microstructural changes resulted in a significant decrease in corrosion rate and increase in polarization resistance for Zn–graphene composite coatings as compared to pure Zn coatings.Acknowledgements
Authors acknowledge research funding from Joint Advanced Technology Program (JATP), Indian Institute of Science, Bangalore, India. C. Srivastava acknowledges the research grant received from DST-Nano Mission grant.References
- B. M. Praveen, T. V. Venkatesha, Y. A. Naik and K. Prashantha, Surf. Coat. Technol., 2007, 201, 5836–5842 CrossRef CAS PubMed.
- V. A. Paramonov and N. G. Filatova, Prot. Met., 2002, 38, 475–478 CrossRef CAS.
- M. S. Shihab and H. H. Al-Doori, J. Mol. Struct., 2014, 1076, 658–663 CrossRef CAS PubMed.
- W. Wang, F.-Y. Hou, H. Wang and He.-T. Guo, Scr. Mater., 2005, 53, 613–618 CrossRef CAS PubMed.
- C. B. Wang, D. L. Wang, W. X. Chen and Y. Y. Wang, Wear, 2002, 253, 563–571 CrossRef CAS.
- C. M. Praveen Kumar and T. V. Venkatesha, Synth. React. Inorg., Met.-Org., Nano-Met. Chem., 2012, 42, 351–359 CrossRef.
- S. Ranganatha and T. V. Venkatesha, RSC Adv., 2014, 4, 31230–31238 RSC.
- B. M. Praveen and T. V. Venkatesha, J. Alloys Compd., 2009, 482, 53–57 CrossRef CAS PubMed.
- C. M. Praveen Kumar, T. V. Venkatesha and R. Shabadi, Mater. Res. Bull., 2013, 48(4), 1477–1483 CrossRef PubMed.
- H.-J. Choi, S.-M. Jung, J.-M. Seo, D. W. Chang, L. Dai and J.-B. Baek, Nano Energy, 2012, 1, 534–551 CrossRef CAS PubMed.
- Z. Zhu, J. Ma, Z. Wang, C. Mu, Z. Fan, L. Du, Y. Bai, L. Fan, H. Yan, D. L. Phillips and S. Yang, J. Am. Chem. Soc., 2014, 136, 3760–3763 CrossRef CAS PubMed.
- Q. Cheng, J. Tang, J. Ma, H. Zhang, N. Shinya and L.-C. Qin, Carbon, 2011, 49, 2917–2925 CrossRef CAS PubMed.
- J. Chen, G. Yu, B. Hu, Z. Liu, L. Ye and Z. Wang, Surf. Coat. Technol., 2006, 201, 686–690 CrossRef CAS PubMed.
- M. Mouanga, L. Ricq, J. Douglade and P. Bercot, J. Appl. Electrochem., 2007, 37, 283–289 CrossRef CAS PubMed.
- M. F. de Carvalho, W. Rubin and I. A. Carlos, J. Appl. Electrochem., 2010, 40, 1625–1632 CrossRef CAS.
- Y. Kowase, N. K. Shrestha and T. Saji, Surf. Coat. Technol., 2006, 200, 5526–5531 CrossRef CAS PubMed.
- S. Ranganatha, T. V. Venkatesha, K. Vathsala and M. K. Punith Kumar, Surf. Coat. Technol., 2012, 208, 64–72 CrossRef CAS PubMed.
- J. Liu, C. K. Poh, D. Zhan, L. Lai, S. H. Lim, L. Wang, X. Liu, N. G. Sahoo, C. Li, Z. Shen and J. Lin, Nano Energy, 2013, 2, 377–386 CrossRef CAS PubMed.
- L. Niu, M. Li, X. Tao, Z. Xie, X. Zhou, A. P. A. Raju, R. J. Young and Z. Zheng, Nanoscale, 2013, 5, 7202–7208 RSC.
- M. Alanyalioglu, J. J. Segura, J. Oro-Sole and N. Casan-Pastor, Carbon, 2012, 50, 142–152 CrossRef CAS PubMed.
- M. Zhou, J. Tang, Q. Cheng, G. Xu, P. Cui and L.-C. Qin, Chem. Phys. Lett., 2013, 572, 61–65 CrossRef CAS PubMed.
- A. L. Patterson, Phys. Rev., 1939, 56, 978–982 CrossRef CAS.
- M. Sajjadnejad, A. Mozafari, H. Omidvarc and M. Javanbakht, Appl. Surf. Sci., 2014, 300, 1–7 CrossRef CAS PubMed.
- A. Gomes and M. I. da Silva Pereira, Electrochim. Acta, 2006, 51, 1342–1350 CrossRef CAS PubMed.
- M. K. Punith Kumar and C. Srivastava, Mater. Charact., 2013, 85, 82–91 CrossRef CAS PubMed.
- A. Vlasa, S. Varavara, A. Pop, C. Bulea and L. M. Muresan, J. Appl. Electrochem., 2010, 40, 1519–1527 CrossRef CAS.
- J. Fustes, A. Gomes and M. I. da Silva Pereira, J. Solid State Electrochem., 2008, 12, 1435–1443 CrossRef CAS.
- M. Mahdavian and M. M. Attar, Electrochim. Acta, 2005, 50, 4645–4648 CrossRef PubMed.
- H. Park and J. A. Szpunar, Corros. Sci., 1998, 40, 525–545 CrossRef CAS.
- M. K. Punith Kumar and C. Srivastava, J. Mater. Eng. Perform., 2014, 23, 3418–3424 CrossRef CAS.
| This journal is © The Royal Society of Chemistry 2015 |

