
Ag–ZnO heterostructure nanoparticles with plasmon-enhanced catalytic degradation for Congo red under visible light†
Xu Liua,
Weibo Lia,
Nan Chena,
Xinxin Xinga,
Chengjun Dongab and
Yude Wang*ab
aSchool of Physical Science and Technology, Yunnan University, 650091 Kunming, People's Republic of China. E-mail: ydwang@ynu.edu.cn; Fax: +86-871-65153832; Fax: +86-871-65031124
bYunnan Province Key Lab of Micro-Nano Materials and Technology, Yunnan University, 650091 Kunming, People's Republic of China
First published on 8th April 2015
Abstract
Ag–ZnO heterostructure nanoparticles were synthesized by a one-step solvothermal route from zinc acetate dihydrate (Zn(CH3COO)2·2H2O), silver nitrate (AgNO3), potassium hydroxide (KOH) and methanol (CH3OH). The structure, morphology, component and optical properties were characterized by X-ray diffraction (XRD), transmission electron microscopy (TEM), X-ray photoelectron spectroscopy (XPS), Raman spectroscopy, UV-vis spectroscopy and photoluminescence spectroscopy, respectively. The results show that highly crystalline wurtzite-type ZnO nanoparticles matrices with an average grain size of 7.4 nm are obtained. Highly crystalline metallic Ag nanoparticles are observed on the ZnO matrix with a good combination. The absorption spectra of the Ag–ZnO heterostructure nanoparticles show the existence of a special two-absorption-region (strong UV-light and weak visible-light at 421 nm). The intensities of photoluminescence in the visible light region have a regular decrease with the increase in the load amount of Ag. The photoactivity of the as-synthesized samples was tested by measuring the degradation of azo dye Congo red (CR) under visible light irradiation. And it is found that both ZnO nanoparticles and Ag–ZnO heterostructured nanoparticles have better photocatalytic efficiency than commercial TiO2 (P-25), and an appropriate loading amount of Ag nanoparticles can significantly enhance the photocatalytic efficiency. The photodegradation mechanism as well as enhancement of the photoactivity in the presence of silver nanoparticles is further investigated. The experimental results indicate the potential of using Ag–ZnO heterostructured nanoparticles for degradation of Congo red dye.
1. Introduction
Water pollution caused by organic dyes in textile dyeing industry wastewater is a current problem worldwide.1 Organic dye removal from wastewater has attracted considerable attention because of dyes' long-term environmental toxicity and short-term public health damage.2 Congo red (CR) is one of the well-known azo dyes and frequently used in the textile and dyeing industries as a coloring agent.3 Owing to the complex aromatic structures which provides CR physicochemical, thermal and optical stability, it is hard to obtain a complete decontamination of CR by traditional physical, chemical and biological methods of wastewater treatment.4,5 But the residual CR could cause serious environment hazards such as eutrophication, and endanger human health due to the toxic, mutagenic and carcinogenic effect.3,4,6 Hence, there is an urgent demand for development of efficient, low-cost processes to remove CR from the wastewater. Compared with other techniques, semiconductor photocatalysis has been thought to be one of the most promising methods for wastewater treatment due to its strong destructive power to mineralize the pollutants into CO2 and H2O.7As a versatile semiconductor material, the wurtzite-type ZnO has attracted increasing attention as promising photocatalyst because it is inexpensive and relatively harmless.8–10 However, some natures of wurtzite-type ZnO cause several inevitable shortcomings for use of photocatalyst. For instance, the wide band gap (3.37 eV at room temperature) results only UV light can be used by ZnO to show its photocatalytic activity. The rapid recombination of photoexcited electron–hole pairs weakens its photocatalytic efficiency.11–13 Also, the low crystallization temperature and fast growth rate of ZnO lead to large crystal size and consequent low specific surface area which makes the catalyst can not expose enough active sites.14–16 To overcome these shortcomings, lots of efforts have been made,17–19 and variety engineering strategies have been uncovered such as band structure engineering, micro/nano engineering, bionic engineering, co-catalyst engineering, surface/interface engineering and so on.20 And it is also found that the photocatalytic efficiency of semiconductor can be significantly improved by surface modification through forming heterostructure with noble metal, such as Ag, Au, Pt and so on.11,21–23 The improvement is attributed to overcoming of the first two shortcomings. Firstly, the formed Schottky barrier at the metal–semiconductor interface promotes the separation of photogenerated electron–hole pairs.12 Secondly, the surface plasmon resonance of noble metal nanoparticles results in an obvious enhanced absorption of sunlight.24,25 The enhanced utilization of visible light can be attributed the surface plasmon resonance induced by gold and silver colloids, and this novel strategy has been used widely in the fields of degrading organic pollutants, transforming organics and generate hydrogen fuel.26–30 As the cheapest noble metal, silver is the most promising one to obtain low-cost and high-efficiency metal–ZnO photocatalyst. Up to now, several Ag–ZnO heterostructures with different morphologies of ZnO matrix have been reported, such as nanospindles,25 nanoporous microds,31 nanorods,32 nanoparticles,21 nanofibers,12 microspheres,33 nanosheets34 and so on. But the sizes of ZnO in these systems all fall in a huge scale from tens to hundreds nanometers, which means there still exist a large space to improve the photocatalytic efficiency by decreasing the size of ZnO because lower size of ZnO leads to higher specific surface area to expose more active sites.
In this paper, Ag–ZnO heterostructure nanoparticles were synthesized using a one-step solvothermal method. The grain size of high crystallinity ZnO nanoparticle matrix is estimated as small as 7.4 nm. The catalytic efficiency was tested by degradation of CR dye under visible light driven. Both of ZnO nanoparticles and Ag–ZnO heterostructure nanoparticles have better degradation efficiency than P25-TiO2. Compared with that of pure ZnO nanoparticles, the presence of Ag improves 20.6% of the photocatalytic efficiency. And the structure, morphology and composition of the as-synthesized samples were characterized by X-ray diffraction (XRD), transmission electron microscopy (TEM), X-ray photoelectron spectroscopy (XPS), and Raman scattering measurements to find out the cause. To have an in-depth understanding of its enhanced mechanism, UV-vis spectroscopy and photoluminescence spectrometer were also carried out.
2. Experimental details
2.1. Preparation of Ag–ZnO heterostructured nanoparticles
All the chemical reagents used in the experiments were obtained from commercial sources as guaranteed-grade reagents and used without further purification.Ag–ZnO heterostructure nanoparticles were prepared by a simple one-step solvothermal method. In a typical synthetic experiment, 0.5817 g zinc acetate dihydrate (Zn(CH3COO)2·2H2O), 0.2700 g potassium hydroxide (KOH) and silver nitrate (AgNO3) with different amounts of Ag were dissolved into 20, 10 and 5 mL methanol to get transparent solutions, respectively. The amount of AgNO3 was calculated according to [Ag+]/[Zn2+] = 0%, 2%, 3%, 4% and 5%, and the corresponding samples were named as ZnO and x%Ag–ZnO (x = 2, 3, 4, 5) respectively. Later, the solution of potassium hydroxide was poured into zinc acetate solution to form a white suspension. After magnetically stirring for 20 min, the silver nitrate solutions were added with magnetically stirring for another 20 min. Then, 30 mL of the final suspension was transferred into a Teflon-lined stainless steel autoclave with a capacity of 50 mL and reacted under solvothermal conditions at 100 °C for 4 h. The autoclave was cooled down to room temperature in standard atmosphere. The resulting product was centrifuged, and the red-brown colored precipitate was thoroughly washed with ethanol and then dried at 60 °C overnight.
2.2. Characterization of as-prepared nanoparticles
X-ray diffraction (XRD, Rigaku D/MAX-3B powder diffractometer) with a copper target and Kα radiation (λ = 1.54056 Å) was used for the phase identification, where the diffracted X-ray intensities were recorded as a function of 2θ. The sample was scanned from 10° to 90° (2θ) in steps of 0.01°. The crystallite domain sizes (D) have been examined from XRD peaks based on the Scherrer's equation: D = 0.9λ/(ΔW![[thin space (1/6-em)]](https://www.rsc.org/images/entities/char_2009.gif) cosθ), where λ is the wavelength of X-ray (λ = 0.15418 nm), θ is the Bragg's diffraction angle, and ΔW is the true half-peak width of the X-ray diffraction lines. The transmission electron micrographs (TEM) were obtained with a Zeiss EM 912Ω instrument at an acceleration voltage of 120 kV, while high-resolution transmission electron microscopy (HRTEM) characterization was done using a Philips CM200-FEG microscope (200 kV, Cs = 1.35 mm). The samples for TEM were prepared by dispersing the particles in water; this dispersion was then dropped on carbon–copper grids. X-ray photoelectron spectroscopy (XPS) was carried out at room temperature in ESCALAB 250 system. During XPS analysis, an Al Kα X-ray beam was adopted as the excitation source and the vacuum pressure of the instrument chamber was 1 × 10⁻⁷ Pa as read on the panel. Measured spectra were decomposed into Gaussian components by a least-square fitting method. Bonding energy was calibrated with reference to C1s peak (285.0 eV). Raman scattering measurements were made at room temperature using a Renishaw inVia Raman microscope. UV-vis measurements were made with a UV-1800 spectrophotometer of Jinghua Instruments with a wavelength range between 300 and 600 nm. Photoluminescence measurements were carried out at room temperature with an imaging spectrometer (iHR320 HORIBA Jobin Yvon Inc., Edison, NJ, USA.). Fourier transformed infrared (FTIR) spectra, in the range of 4000–400 cm−1, were recorded on AVATAR 360 FT-IR spectrophotometer.
cosθ), where λ is the wavelength of X-ray (λ = 0.15418 nm), θ is the Bragg's diffraction angle, and ΔW is the true half-peak width of the X-ray diffraction lines. The transmission electron micrographs (TEM) were obtained with a Zeiss EM 912Ω instrument at an acceleration voltage of 120 kV, while high-resolution transmission electron microscopy (HRTEM) characterization was done using a Philips CM200-FEG microscope (200 kV, Cs = 1.35 mm). The samples for TEM were prepared by dispersing the particles in water; this dispersion was then dropped on carbon–copper grids. X-ray photoelectron spectroscopy (XPS) was carried out at room temperature in ESCALAB 250 system. During XPS analysis, an Al Kα X-ray beam was adopted as the excitation source and the vacuum pressure of the instrument chamber was 1 × 10⁻⁷ Pa as read on the panel. Measured spectra were decomposed into Gaussian components by a least-square fitting method. Bonding energy was calibrated with reference to C1s peak (285.0 eV). Raman scattering measurements were made at room temperature using a Renishaw inVia Raman microscope. UV-vis measurements were made with a UV-1800 spectrophotometer of Jinghua Instruments with a wavelength range between 300 and 600 nm. Photoluminescence measurements were carried out at room temperature with an imaging spectrometer (iHR320 HORIBA Jobin Yvon Inc., Edison, NJ, USA.). Fourier transformed infrared (FTIR) spectra, in the range of 4000–400 cm−1, were recorded on AVATAR 360 FT-IR spectrophotometer.
2.3. Measurement of photocatalytic activity
CR (C32H22N6Na2O6S2, molecular weight: 696.67 g mol−1, from Guangzhou Reagent Corporation, China) was used as a model dye to investigate the catalytic activity of ZnO nanoparticles and Ag–ZnO heterostructure nanoparticles. 20 mg of the as-prepared sample was added into a quartz beaker, and then 50 mL of CR solution with different concentration (15, 25 and 50 mg L−1) was introduced. The above mixture was magnetically stirred for 30 min in dark, and then the beaker was put under visible light. The irradiation was provided by 24 W visible-light lamp, and the light below 400 nm was removed by a glass filter. The distance between the lamp and the solution surface was 6 cm. The dispersion (4 mL) was extracted and centrifuged to separate catalyst and dye solutions at 4000 rev. per min for 30 min at different intervals. The changes of the concentration of the centrifuged solutions were recorded by UV-1800 spectrophotometer. The concentration (C) of the centrifuged solution and the initial concentration (C0) of the CR solution were monitored immediately by measuring the absorbance of the supernatant at 498 nm using UV-1800 spectrophotometer. The degradation rate was calculated as C/C0. The degradation products formed at the end of the degradation reaction process were analyzed by liquid chromatography-mass spectrometry (LC-MS) measurements performed using Agilent G1969A (Agilent Technologies Inc. USA) with electrospray ionization mass spectrometry.3. Results and discussion
3.1. Structure, morphology and component of Ag–ZnO heterostructure nanoparticles
X-ray diffraction patterns of as-prepared samples are shown in Fig. 1. The present peaks in the spectra demonstrate the high crystallinity of the products, which can be identified to originate from (100), (002), (101), (102), (110), (103), (200), (112), (004) and (202) reflections of wurtzite-type ZnO structure (ICDD PDF no. 80-0074), space group F63mc (186). Because of the diffraction widening, the overlapping of neighboring peaks can be observed, such as the overlapping of (200), (112) and (201). And the widened diffractions also indicate the small grain size of the products. The mean grain sizes of ZnO in different samples were calculated by using the Scherrer's equation to (100), (002), (101), (102), (110) and (103) plane diffraction peaks. And the calculated results of ZnO in pure ZnO, 2%Ag–ZnO, 3%Ag–ZnO, 4%Ag–ZnO and 5%Ag–ZnO are 8.7, 9.0, 7.4, 8.3 and 8.8 nm, respectively. Such the grain sizes are much smaller than that of the most reported Ag–ZnO systems.12,21,25,31–34 At the same time, the small grain size also leads to the overlapping of the peaks belonging to silver. So, it is hard to observe any peaks belonging to silver in Fig. 1 until smoothing and magnifying are carried out. The smoothed and magnified pattern of 4%Ag–ZnO is presented in Fig. S1† in which two peaks corresponding to (111) and (200) planes of silver (JCPDS 04-0783) can be found, indicating the presence of silver in as-prepared Ag–ZnO heterostructure nanoparticles.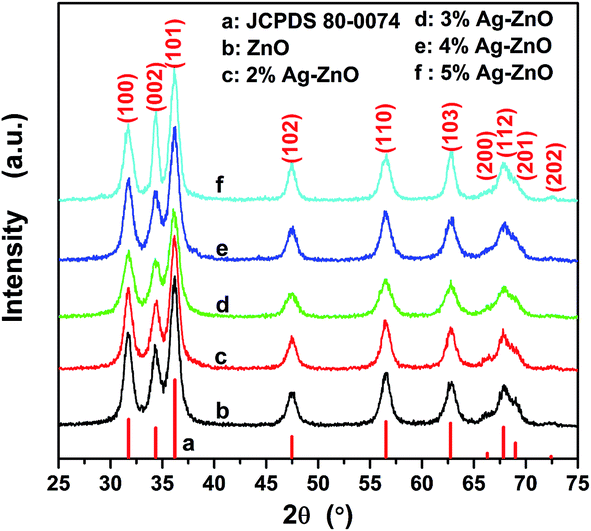 | ||
| Fig. 1 XRD patterns of as-synthesized (a) ZnO nanoparticles and (b)–(f) Ag–ZnO heterostructure nanoparticles with the different Ag contents. | ||
The morphology of the as-prepared 3%Ag–ZnO was further examined with transmission electron microscopy (TEM) as shown in Fig. 2. From Fig. 2(a), one can observe that the particles with small agglomerates have rather uniform near-sphere shape as well as size. The samples with other different Ag contents show the similar morphology and particle size. Moreover, the particles can be easily classified into two different groups by different contrast. It is well known to us that the Ag with higher atomic number shows a higher contrast than ZnO. So, the darker particles (marked by white rings in Fig. 2(a)) might be assigned to silver while the lighter might correspond to ZnO. In order to have more convincible evidence, HRTEM imagines of these two different contrast nanoparticles are shown in Fig. 2(b) and (c), respectively. In Fig. 2(b), one well-defined low-contract particle with a size of 8.2 nm can be observed, and the clear lattice fringes demonstrate the high crystallinity of this particle. The interplanar spacing is estimated to 0.281 nm which corresponds to (100) lattice plane of ZnO. Fig. 2(c) displays a high-contrast particle with a size of 13.0 nm. Though measuring the close-packing fringes, the interplanar spacing is calculated to be 0.235 nm corresponding to (111) lattice plane of Ag. Hence the darker and lighter particles correspond to Ag and ZnO particles, respectively. Furthermore, one can know that the Ag particles uniformly distribute on the random packed ZnO nanoparticle matrix (Fig. 2(a)). And both Ag and ZnO nanoparticles have pretty small grain sizes which should be responsible for the peak widening of XRD patterns and consequent difficulty in finding diffraction peaks of silver in Fig. 1. As we know, a good combination between Ag and ZnO is the key to form Ag–ZnO heterostructure to improve the photocatalytic efficiency.31 In Fig. 2(c), the indistinct grain boundary of the Ag nanoparticle can be observed, which may result from the diffusion contact with ZnO. A magnified TEM imagine of the indistinct boundary marked by black dash line in Fig. 2(c) is displayed in Fig. 2(d). From the magnified TEM imagine (Fig. 2(d)), two different contrast fringes can be found in the boundary of the Ag nanoparticle. The interplanar spacing of 0.280 nm corresponds to the (100) plane of ZnO, while the interplanar spacing of 0.235 nm is assigned to the (111) lattice plane of Ag. It means Ag–ZnO heterostructure has formed in as-synthesized Ag–ZnO nanoparticles. At the same time, the specific surface area of as-prepared 3%Ag–ZnO nanoparticles is estimated to be 108.4 m2 g−1 by BET method, and such a high specific surface area should be attributed to the small grain size which has been confirmed by XRD and TEM.
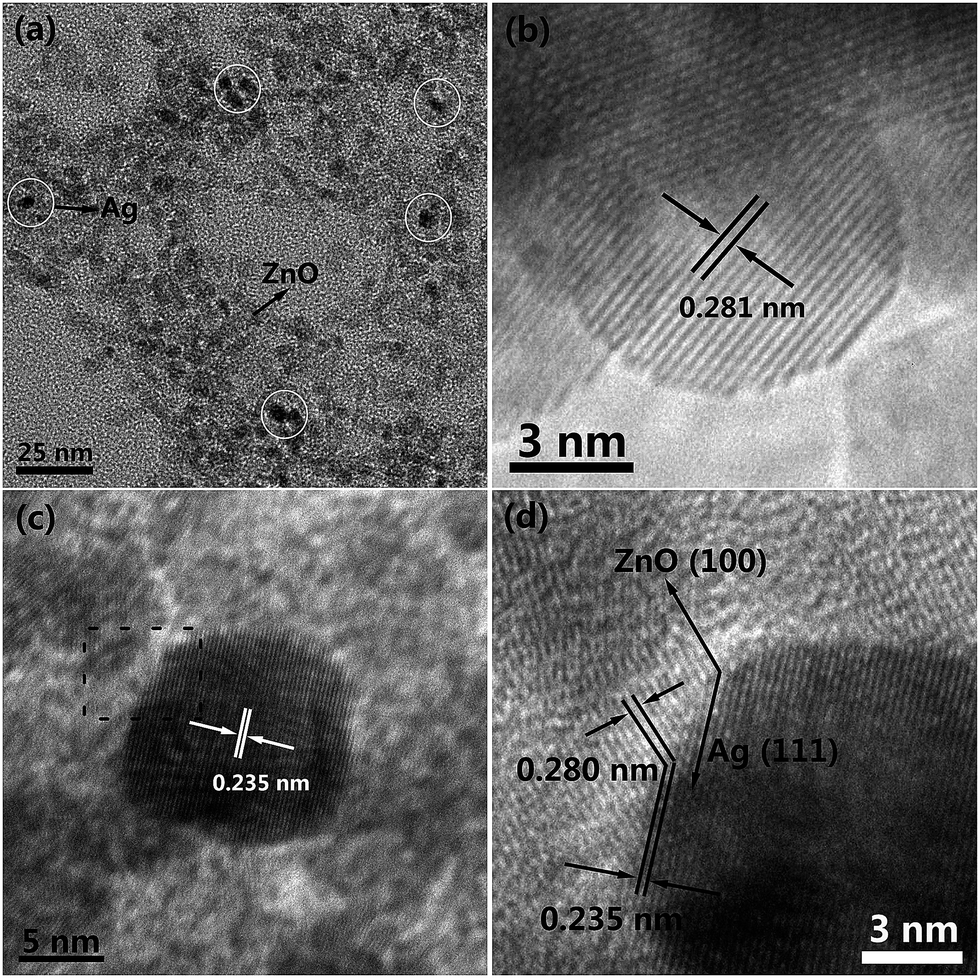 | ||
| Fig. 2 (a) TEM image of as-synthesized 3%Ag–ZnO heterostructure nanoparticles, HRTEM images of single (b) ZnO nanoparticle and (c) Ag nanoparticle, (d) HRTEM image of ZnO–Ag interface. | ||
The XPS analysis was used to investigate the chemical component of the 5%Ag–ZnO sample and shown in Fig. 3. One can find that there are no peaks belonging to other elements except Zn, Ag, O and C in Fig. 3(a), indicating the high purity of as-prepared samples. From Fig. 3(b), Zn2p spectra reveal two peaks of Zn2p3/2 and Zn2p1/2 with a good symmetry, and the splitting of the 2p doublet is 23.0 eV. Both of them illustrate that Zn in the particles is in a single form of Zn2+ which is the nature of ZnO. The high-resolution XPS spectra of Ag3d are show in Fig. 3(c) where the Ag3d5/2 and Ag3d3/2 peaks are observed at a binding energy of 367.6 and 373.6 eV, demonstrating the metallic nature of silver. And both Ag3d5/2 and Ag3d3/2 peaks shift to lower binding energies compared with the standard values for bulk silver (368.2 and 374.2 eV for Ag3d5/2 and Ag3d3/2 peaks, respectively), which should be attributed to the formation of Ag–ZnO heterostructure interface (as shown in Fig. 2(d)).24,25,31 In Fig. 3(d), the O1s spectra are asymmetry and can be fitted to two gauss peaks which are assigned to Olatt (530.15 eV) and Ox−(531.70 eV), respectively. Olatt is associated with oxygen ions in the crystal lattice while Ox− is the absorbed oxygen ions in the oxygen deficient regions such as oxygen vacancy (VO), oxygen interstitial (Oi), and oxygen antisite (OZn).35 This phenomenon indicates that there is not only lattice oxygen but also adsorption oxygen in the sample.
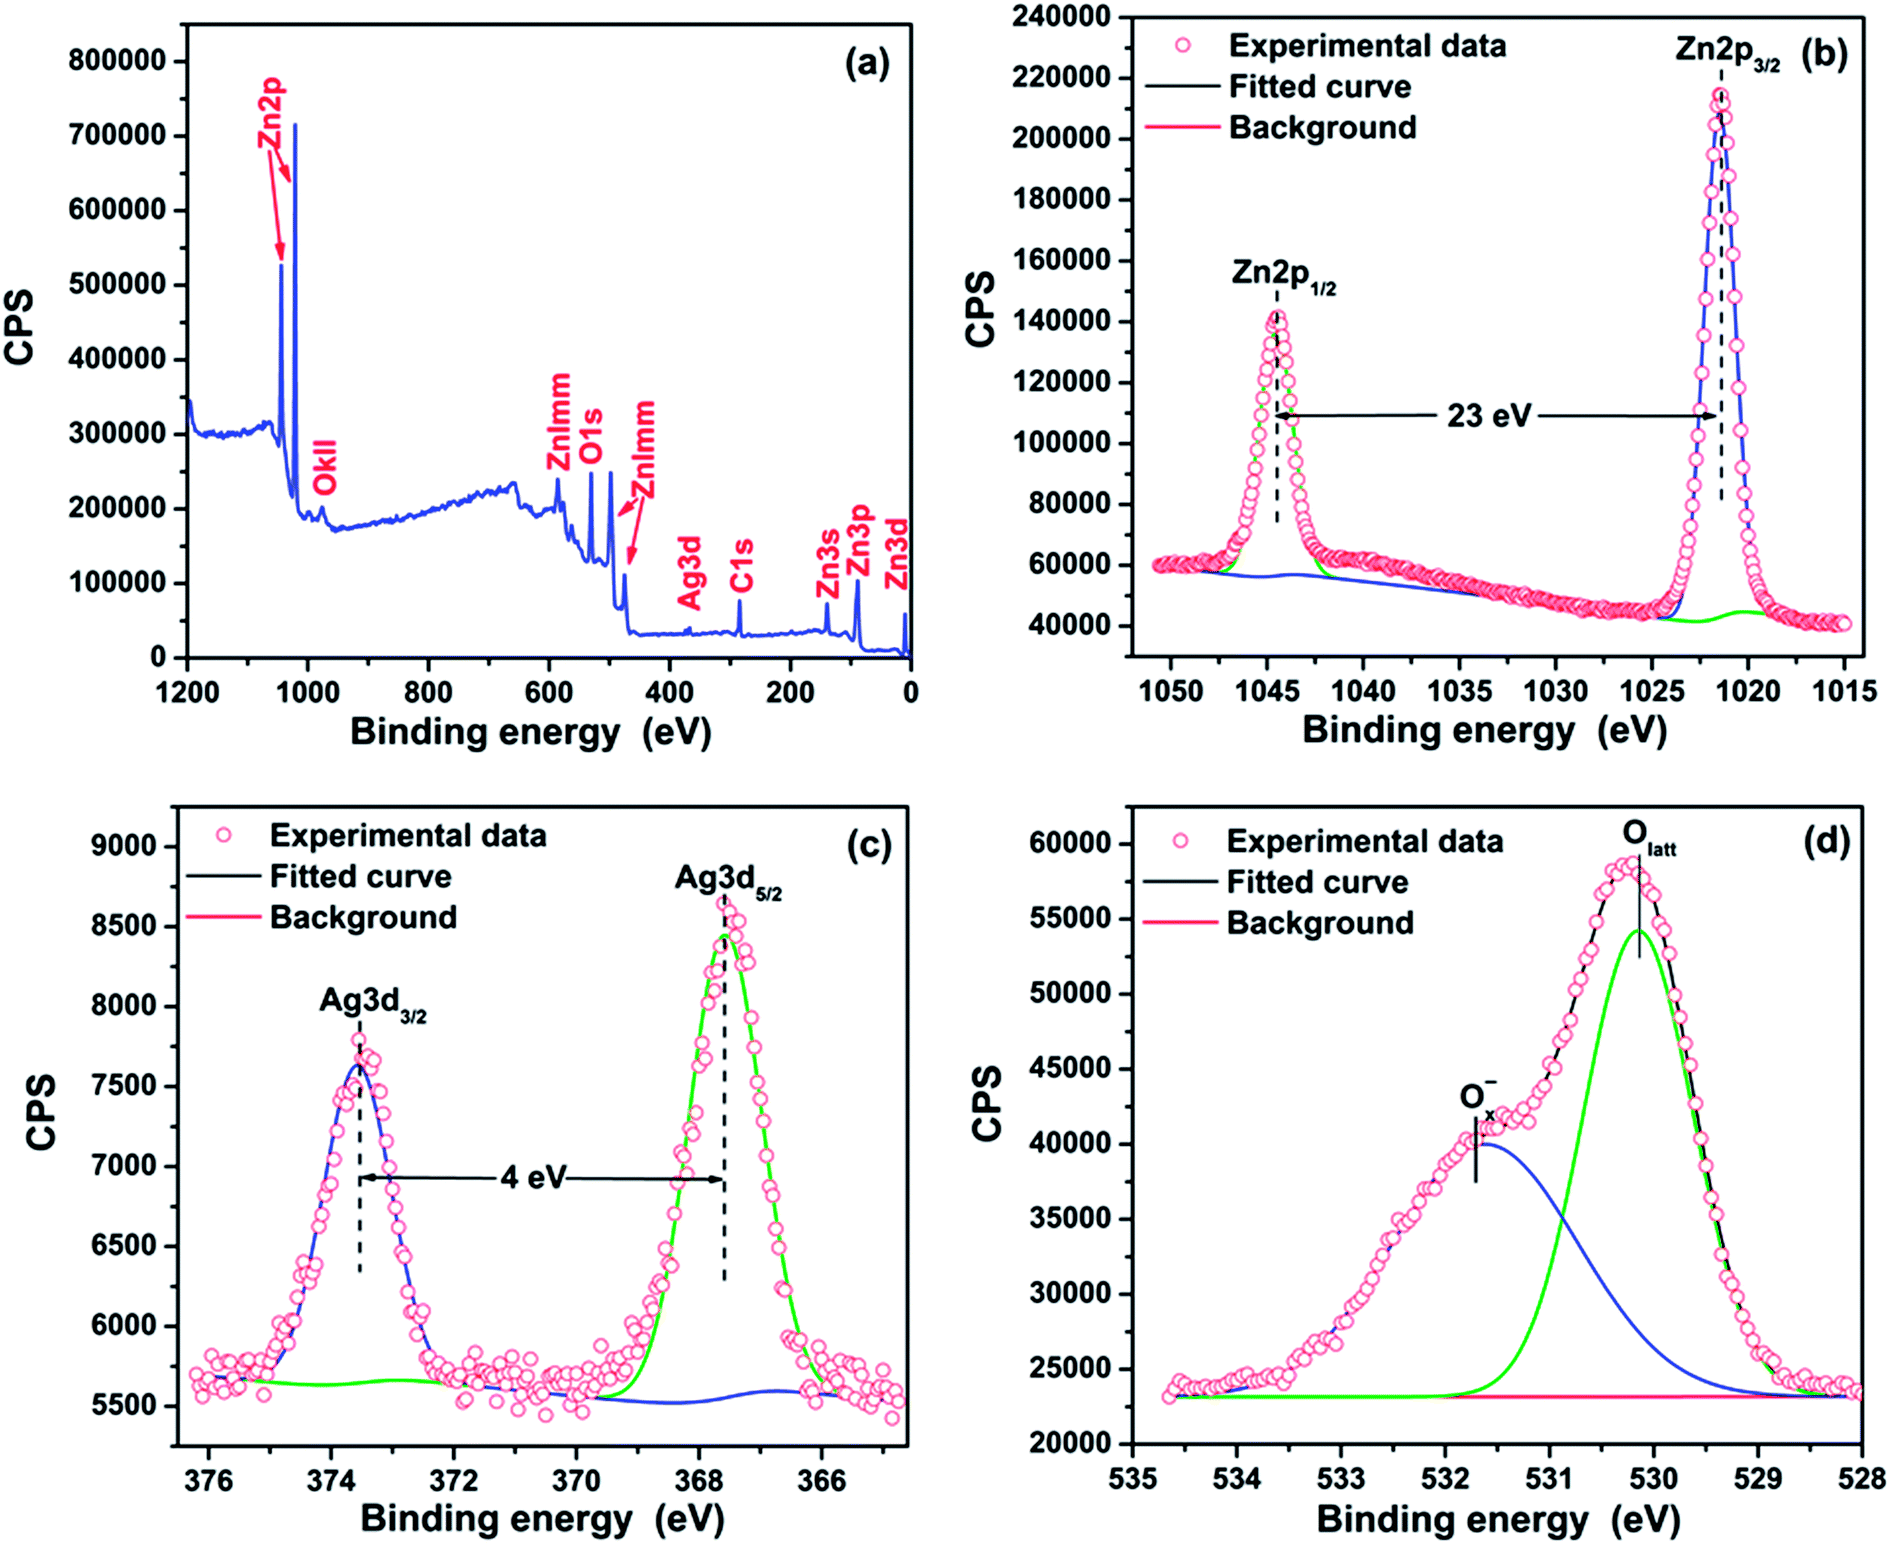 | ||
| Fig. 3 XPS spectra of 5%Ag–ZnO heterostructure nanoparticles: (a) XPS survey spectra and the high-resolution spectra of (b) Zn2p, (c) Ag3d, and (d) O1s. | ||
To have a further study on structure of the ZnO and Ag–ZnO nanoparticles, the Raman spectra and PL spectra were carried out and presented in Fig. 4. In Fig. 4(a), the blue colored spectra display the typical Raman spectra of ZnO. The prominent peaks located at 333, 438 and 582 cm−1 represent the well known A1(TO), Ehigh2 and E1(LO) modes of ZnO, respectively.25 As reported, the 510 cm−1 mode may be related to 582 cm−1 mode which is attributed to lattice defects such as oxygen vacancies, zinc interstitials and their combination.36 Ehigh2 is the characteristic Raman peak for wurtzite-type ZnO and is associated with vibration of the oxygen atom. The strong peak assigned to Ehigh2 indicates the high crystallinity of as-prepared ZnO nanoparticle. Interesting that, most of prominent peaks presented in the spectra of ZnO nanoparticles are great weakened and even disappear in the spectra of Ag–ZnO. Only the strong wide peak centered at 240 cm−1 is observed. The peak centered at 240 cm−1 is resulted from a ν(Ag–O) vibration of atomic oxygen species adsorbed on the defects of metallic Ag, and the high intensity of this peak demonstrates a high concentration of absorbed oxygen on Ag.37 As for the decrease of characteristic peak of ZnO in Ag–ZnO system is also reported by Kuriakose et al.25 But the specific reason is not presented and needs a further investigation. Fig. 4(b) displays the photoluminescence spectra of ZnO and Ag–ZnO nanoparticles with an excited wavelength of 365 nm. All the spectra consist of three components which center at 413, 544 and 660 nm and belong to defect emission. And the intensities of the peaks have regular decrease with the increased load amount of Ag. As we know that the defect emission of ZnO is assigned to the recombination of photogenerated electrons and holes.13 To some degree, the decreasing intensity indicates a decreased recombination of the photogenerated electron–hole pairs. That is the silver–ZnO heterostructure is surly formatted, which has a good agreement with the TEM results.
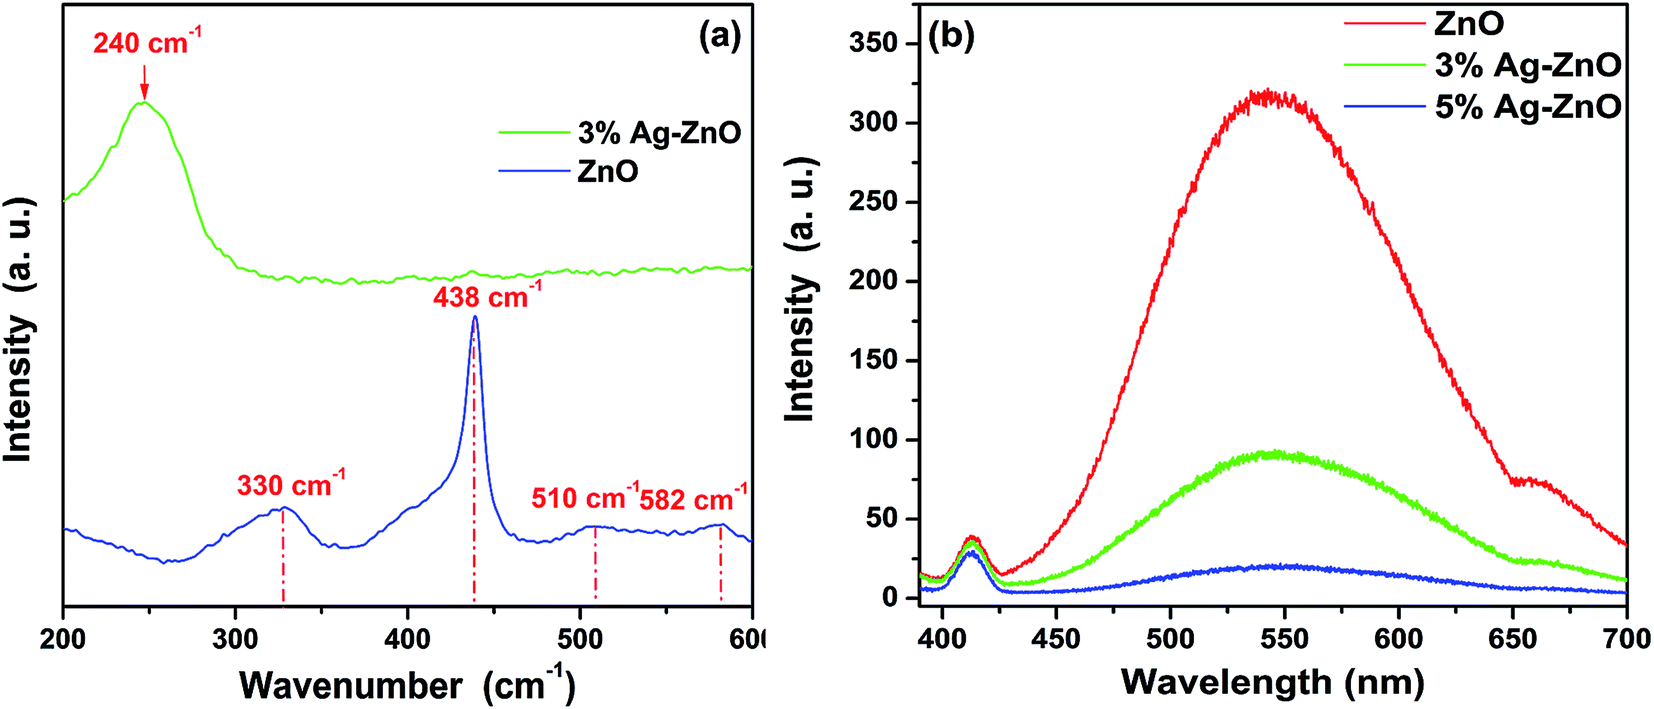 | ||
| Fig. 4 (a) Raman spectra and (b) PL spectra of as-prepared nanoparticles. | ||
3.2. Photocatalytic activity of Ag–ZnO heterostructure nanoparticles
The photocatalytic activities of as-synthesized ZnO nanoparticles and Ag–ZnO heterostructure nanoparticles were carried out under visible light, and CR was chosen as a representative organic pollutant since it has been extensively used as an indicator for photocatalytic activity owning to its absorption peaks in the visible range. To have a better evaluation of the photocatalytic efficiency of as-synthesized samples, the commercial TiO2 (Degussa P-25) was used as a photocatalytic reference. Fig. 5(a) shows the comparison of the photodegradation rate of CR with a concentration of 25 mg L−1 in the presence of ZnO nanoparticles, Ag–ZnO heterostructure nanoparticles and P-25 TiO2. The black curve assigned to the CR solution without any catalyst shows a little fluctuation around 1.0, which means the CR dye is pretty stable in aqueous surrounding with visible light. And one can find that both of ZnO and Ag–ZnO show a faster removal rate than P-25 TiO2. The low catalytic efficiency of P-25 TiO2 should be attributed to the little absorbance of visible light. Apart from these, it also can be observed that the formation of heterostructure between Ag and ZnO significantly increases the photocatalysis efficiency. To be more specific, it takes only 10 min for 3%Ag–ZnO to remove 94% of the CR dye, but the pure ZnO nanoparticles need more than 50 min to reach the same degradation degree. The highest difference of the degradation rate of 3%Ag–ZnO and ZnO reaches as high as 23%. Moreover, it is obviously that the Ag–ZnO heterostructure nanoparticles with 3% load of Ag show the highest photocatalytic activity and its photodegradation efficiency reaches 97.3% under the visible light irradiation for 50 min. Moreover, the photostability of as-prepared Ag–ZnO heterostructure nanoparticles is also investigated. And Fig. S2† shows four photocatalytic degradation cycles of 25 mg L−1 CR solution using 3%Ag–ZnO heterostructure nanoparticles under visible irradiation. The photocatalytic efficiency reduced only 3.7% after four cycles, indicating a favorable photostability of the sample.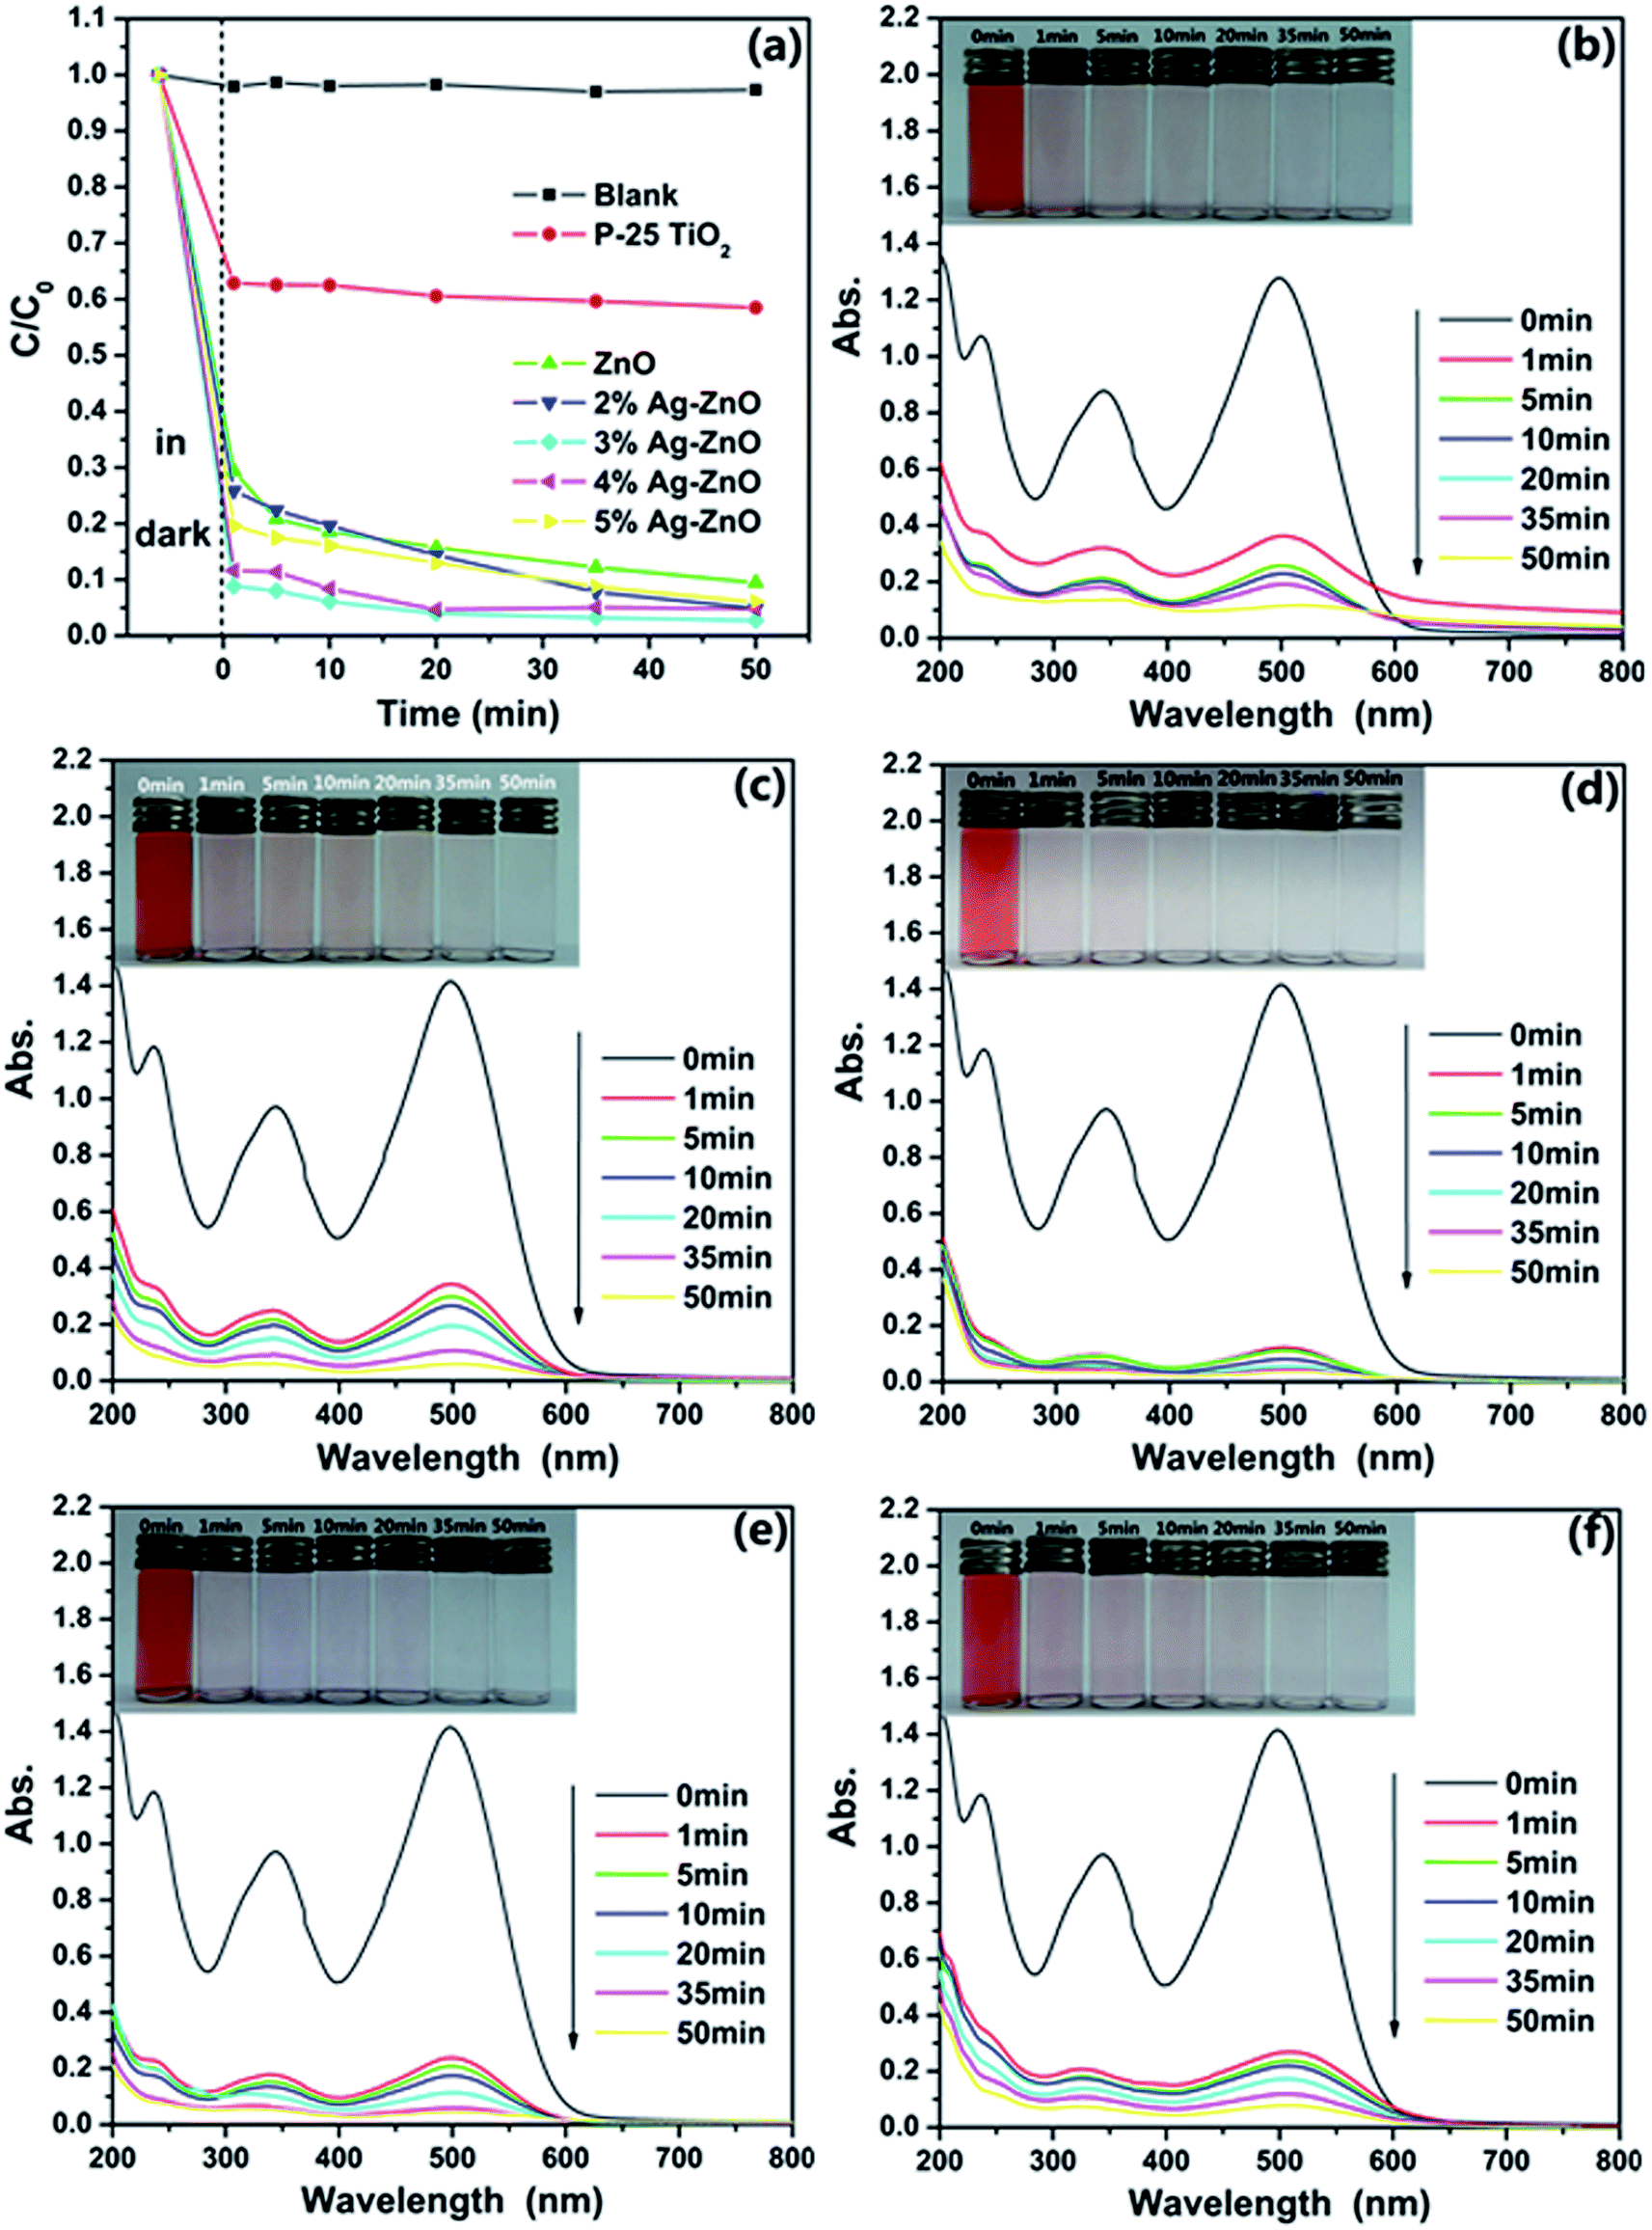 | ||
| Fig. 5 (a) Degradation rates for 25 mg L−1 CR solution at different time intervals for as-prepared samples; UV-vis absorption spectra of CR solutions (25 mg L−1) before and after photodegradation treatment with as-synthesized ZnO nanoparticles (b), 2%Ag–ZnO nanoparticles (c), 3%Ag–ZnO nanoparticles (d), 4%Ag–ZnO nanoparticles (e), and 5%Ag–ZnO nanoparticles (f). Insets are the photographs of CR solutions before and after photodegradation treatment with corresponding samples at different time intervals, respectively. | ||
The continuous UV-vis spectra of the centrifuged solution after catalytic reactions at the different intervals were used to record and contrast with that of initial CR solution, which could deliver an intuitive presentation of the removal performance and mechanism of CR. UV-vis absorbance spectra of the centrifuged solutions as function of operation time are displayed in Fig. 5(b)–(f). As shown in these figures, one can see that CR can be effectively removed by the Ag–ZnO heterostructure nanoparticles. At the same time, it is obvious that the absorption spectra of the original CR solutions are characterized by one main band in the visible region with its maximum absorption at 498 nm assigned to the azo bonds of CR molecule, which results in the dark red colour of aromatic rings pertaining to azo groups. The other two bands located at 236 and 343 nm falling in the UV region are attributed to benzene ring and naphthalene ring structure, respectively. As seen from Fig. 5(b)–(f), the intensities of the peaks at 236, 343 and 498 nm decreased with respect to time, but the peaks at 343 and 498 nm have a faster decrement rate than the peak centered at 236 nm. The peak centered at 236 nm becoming the strongest absorption peak, which suggests that the azo bonds and the naphthyl rings are destroyed to form phenyl derivatives.7 From Fig. 5(d), one can see that the main absorption peaks of the dye in UV-vis region disappear after 50 min. The visible light irradiation of the aqueous CR solution in the presence of Ag–ZnO heterostructure nanoparticles causes the absorption bands of CR decrease with time and finally to disappear, demonstrating the destruction of its chromophoric structure in the CR dye. It means the dye does be decomposed by the photocatalytic reaction. And the further decrease of the peak centered at 236 nm can be treated as evidence of the aromatic fragment degradation in the dye molecule and its intermediates. As it can be observed the disappearance of the visible band is accompanied by total discoloration of the solutions from insets of Fig. 5(b)–(f), which also displays that degradation process of CR. It is clearly observed that the cardinal red color of the solution gradually disappears along with increasing the degradation time. The colors of CR solutions also contrast with the degradation performance shown in Fig. 5(a).
To investigate the influence of CR concentration on photocatalytic efficiency of as-prepared samples, additional degradation experiments based on another two different concentration (15 mg L−1 and 50 mg L−1) CR solutions were carried out. The photocatalytic activities for 15 mg L−1 and 50 mg L−1 CR solutions under visible irradiation in the presence of as-prepared samples are shown in Fig. 6(a) and (b), respectively. For the lower concentration, the dark treatment is enough for 3%Ag–ZnO heterostructure nanoparticles to remove 97.3% of the CR dye. Such the removing of CR dye in dark treatment can be attributed two different mechanisms. The first kind is the absorption of CR on the surface of the catalyst, and it has known that as-prepared samples have a high specific surface area (108.4 m2 g−1). On the other hand, the abundant defects (see XPS section) on the surface of the catalyst lead to the catalytic activity in the dark treatment. And such kind of degradation of organic dyes without any light and additional reagents has been reported on ZnO nanorods and La4Ni3O10.40,41 And it also may result from the synergistic effect of absorption and catalyst. For 50 mg L−1 CR solution, the ZnO nanoparticles with Ag load of 4% have the highest degradation efficiency. It only takes 3 h to remove 94.2% of the CR dye. But for the pure ZnO nanoparticles, it needs 4 h and 5 h to remove 91.2% and 92.0% of the dye respectively, which means it has reached its equilibrium value of degradation nearly at 4 h. But for 4%Ag–ZnO heterostructure nanoparticles, the residual dye in the solution is as low as 2.4% at 5 h. The continuous UV-vis spectra of the centrifuged solution and photographs after catalytic reactions at the different intervals are shown in Fig. S3 and S4 (Fig. S3 and S4† correspond to that of 15 mg L−1 and 50 mg L−1, respectively). In additional, the kinetics of the as-prepared Ag–ZnO heterostructure nanoparticles toward 15 mg L−1, 25 mg L−1 and 50 mg L−1 Congo red solutions with visible irradiation are shown in Fig. S5.† The degradation rate constants as well as the error are also estimated.
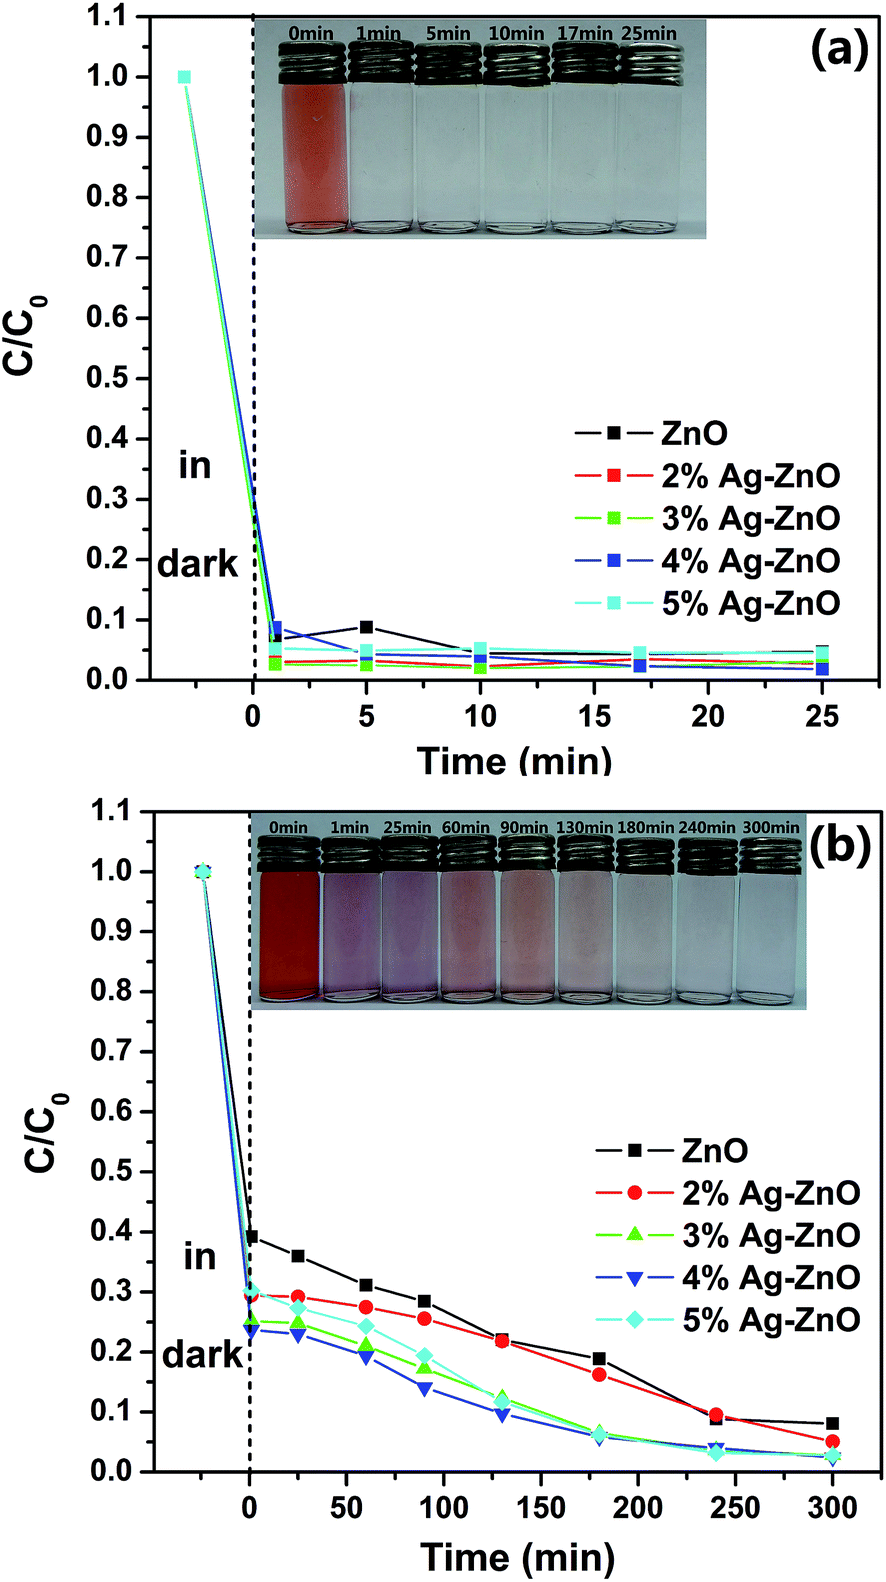 | ||
| Fig. 6 Degradation rates for (a) 15 mg L−1 and (b) 50 mg L−1 CR solution at different time intervals for as-prepared samples. Insets in (a) and (b) correspond to the photographs of CR solution before and after photodegradation treatment with 3%Ag–ZnO nanoparticles and 4%Ag–ZnO nanoparticles, respectively. | ||
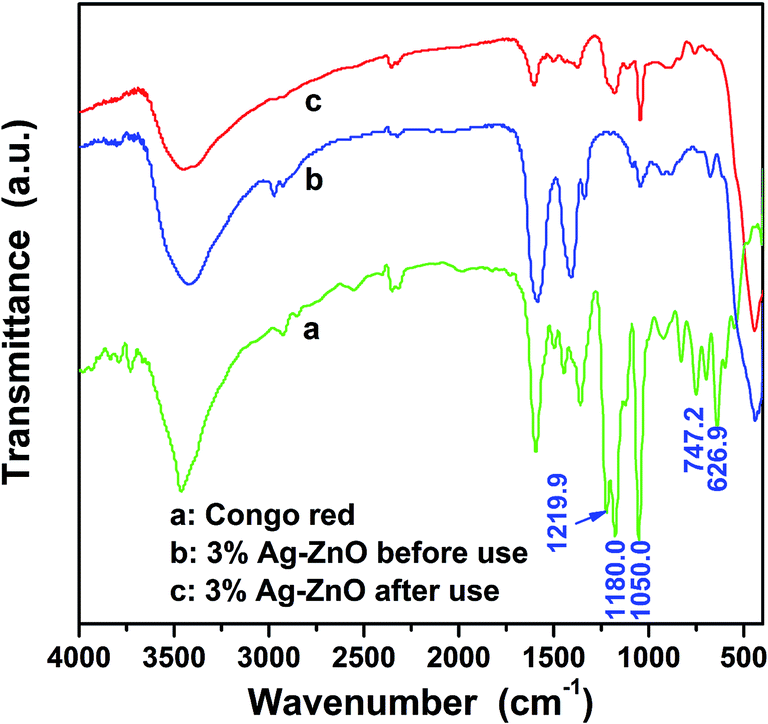
As we have analyzed, a strong absorption is happened in the dark treatment between the CR dye and catalyst. In order to clarify the removal mechanism of CR, further investigations on the regenerated heterostructure nanoparticles and the centrifuged solution after catalytic reactions were carried out. Fig. 7 shows the FTIR spectra of CR, 3%Ag–ZnO heterostructure before and after use in degradation of 50 mg L−1 CR solutions. Through contrast these curves, one can find that some of the characteristic peaks of CR is disappeared in the FTIR spectra of regenerated Ag–ZnO heterostructure, such as the peaks at 1219.9, 747.2 and 626.9 cm−1, which indicates the absorbed CR dyes have been destroyed. And the peak centered at 1180.0 cm−1 and belonging to CR still can be observed in that of the regenerated catalyst, but its intensity has been greatly weakened. It means the degradation of the CR dye is insufficient and there still exist some intermediate products of the degradation. At the same time, the centrifuged solution was analyzed by LC-MS from which one can identify what substance the solution contains through the interpretation of their mass spectra showing their molecule ion peaks with respect to m/z (where m is molecular weight of the intermediates in the mass spectra).2 The analyzed results are shown in Fig. 8 in which (a) and (b) present the molecule ion peaks with respect to m/z and the possible degradation products, respectively. Up to now, some literatures have reported the possible degradation products of CR and have a good match with our analyzed results from LC-MS.38,39 It means a similar degradation mechanism of CR, that is cleavage of C–S bonds, aromatic ring opening, cleavage of –N![[double bond, length as m-dash]](https://www.rsc.org/images/entities/char_e001.gif) N– double bonds, cleavage of various C–N and C–C bands in addition to the decarboxylation. And such possible mechanism can also be traced in the degradation products which have been shown in Fig. 8(b).2,38,39 The investigation about the regenerated Ag–ZnO heterostructure nanoparticles and the centrifuged solution gives a further conclusion that the photocatalytic reaction is surely taking place in the photocatalytic process.
N– double bonds, cleavage of various C–N and C–C bands in addition to the decarboxylation. And such possible mechanism can also be traced in the degradation products which have been shown in Fig. 8(b).2,38,39 The investigation about the regenerated Ag–ZnO heterostructure nanoparticles and the centrifuged solution gives a further conclusion that the photocatalytic reaction is surely taking place in the photocatalytic process.
 | ||
| Fig. 7 FTIR spectra of CR and 3%Ag–ZnO heterostructure nanoparticles before and after using in degradation of 50 mg L−1 CR solution. | ||
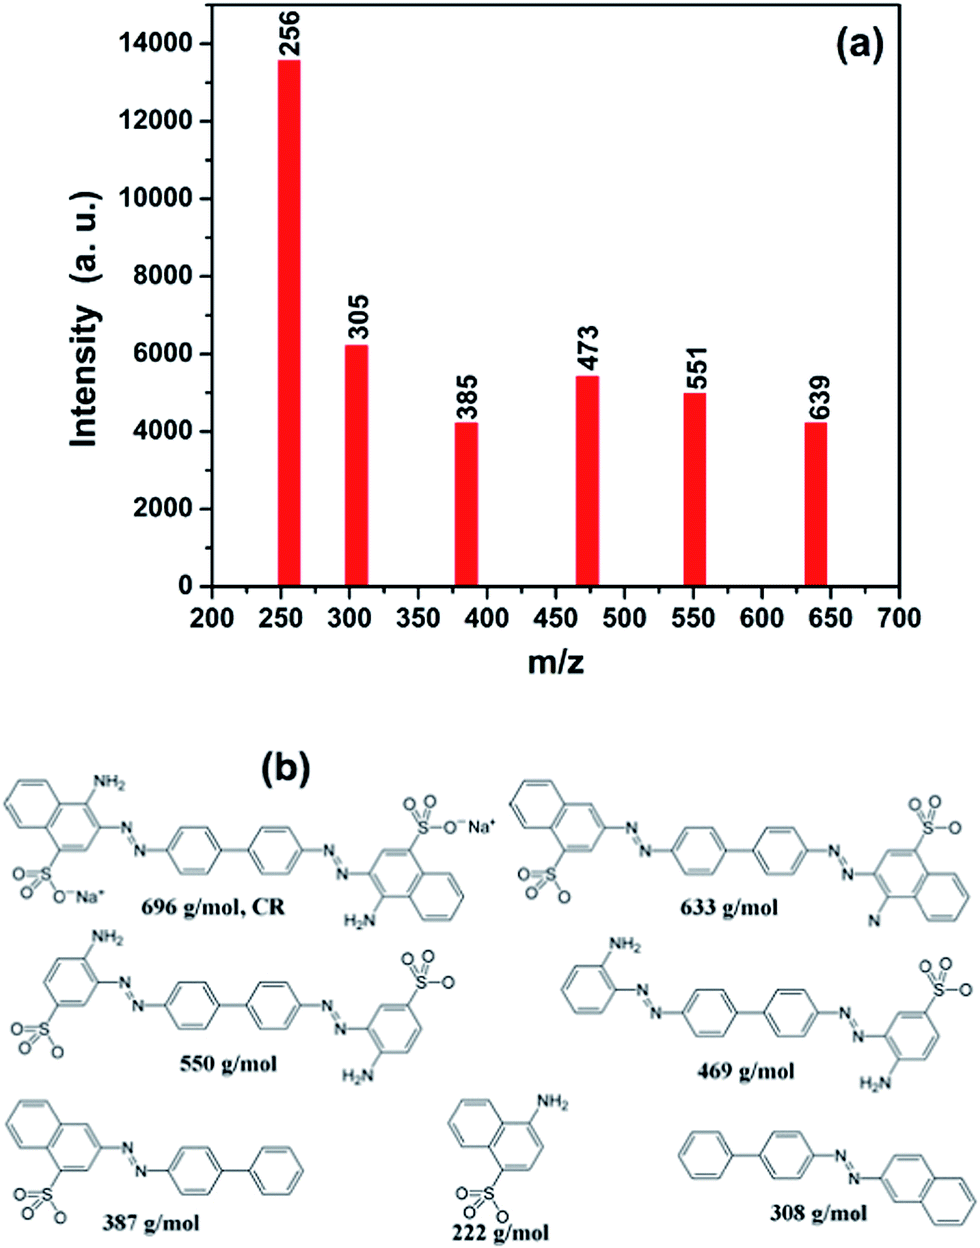 | ||
| Fig. 8 (a) Spectra of CR solution after degradation in presence of 3%Ag–ZnO heterostructure nanoparticles, (b) the CR and possible degradation products of CR in the presence of 3%Ag–ZnO heterostructure nanoparticles. | ||
3.3. Mechanism of the enhanced photocatalytic efficiency in presence of silver
The principle of the photocatalysis of Ag–ZnO heterostructure can be described as Fig. 9.25,26,28,31,32,42,43 When the Ag–ZnO heterostructure nanoparticles were exposed to visible light, the photons will be absorbed by silver nanoparticles through plasmon resonance, which leads to the formation of electrons and Ag+. The formed electrons are injected from silver to the conduction band of ZnO to react with absorbed oxygen to produce superoxide anion radical. And it has reported that the formation of superoxide anion radical determined the overall photocatalytic reaction.43 At the same time, the electrons will transfer from CR molecules to Ag+ to finish a cycle.41 Both superoxide anion radical and Ag+ act the role of breaking down CR dye.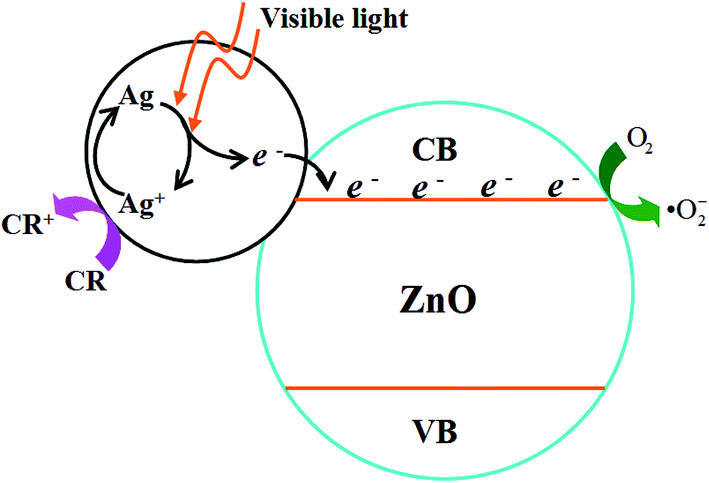 | ||
| Fig. 9 Photocatalytic mechanism of the as-synthesized Ag–ZnO heterostructure nanoparticles. | ||
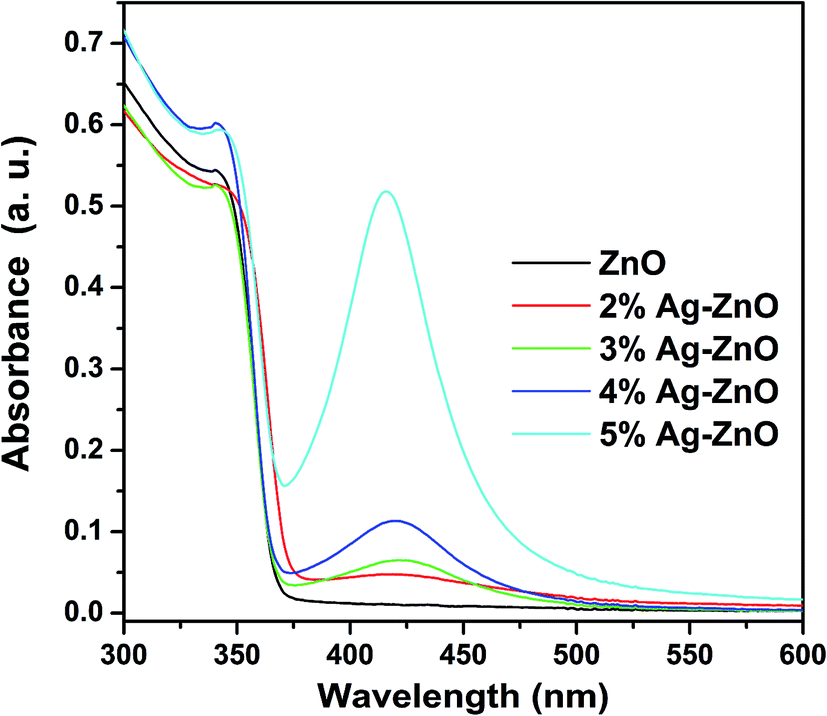
From the description, it is obviously that the enhancement of photocatalytic efficiency under visible light can be attributed to a better use of visible light. To verify these enhanced mechanisms, UV-vis spectra of as-prepared samples were operated and shown in Fig. 10, respectively. Compared with that of pure ZnO nanoparticles, an absorption peak at 421 nm which falls in visible range can be found from the UV-vis spectra of Ag–ZnO heterostructure nanoparticles. And the intensity of this peak is increased with the increased loading of Ag. Such an increase in the visible light absorption is thought to be the result of the surface plasmon resonance of silver nanoparticles and the reason leading to improving visible-light utilization efficiency.
 | ||
| Fig. 10 UV-vis spectra of as-synthesized samples. | ||
4. Conclusions
Ag–ZnO heterostructure nanoparticles with high crystallinity and several nanometers in size for both of ZnO and metallic Ag were successfully synthesized by a one-step solvothermal method. High photodegradation efficiency is observed for as-prepared ZnO nanoparticles and Ag–ZnO heterostructure nanoparticles in the photodegradation experiments of Congo red under visible light driven. It is also found that appropriate composite of silver can significantly improve the photocatalytic efficiency of ZnO. With FTIR spectra and LC-MS analyzing of regenerated Ag–ZnO heterostructure nanoparticles and centrifuged solution respectively, the photocatalytic nature of the removal mechanism is verified and the possible degradation mechanism of CR is assigned to cleavage of C–S bonds, aromatic ring opening, cleavage of –NN– double bonds, cleavage of various C–N and C–C bands in addition to the decarboxylation. Owning to the absorption peak at 421 nm and decreased PL intensity of Ag–ZnO nanoparticles, the enhanced photocatalytic efficiency in presence of silver is attributed to the better use of visible light. The experimental results indicate that as-prepared Ag–ZnO heterostructure nanoparticles could be a promising photocatalyst for degradation of Congo red dye.
Acknowledgements
This work was supported by the National Natural Science Foundation of China (Grant no. 51262029), the Key Project of the Department of Education of Yunnan Province (ZD2013006), Program for Excellent Young Talents, Yunnan University (XT412003), Department of Science and Technology of Yunnan Province via the Key Project for the Science and Technology (Grant no. 2011FA001), and National Training Program of Innovation and Entrepreneurship for Undergraduates (no. 201310673026).Notes and references
- N. Panda, H. Sahoo and S. Mohapatra, J. Hazard. Mater., 2011, 185, 359–365 CrossRef CAS PubMed.
- H. Li, G. Wang, F. Zhang, Y. Wang and I. Djerdj, RSC Adv., 2012, 2, 12413–12423 RSC.
- V. A. Sakkas, M. A. Islam, C. Stalikas and T. A. Albanis, J. Hazard. Mater., 2010, 175, 33–44 CrossRef CAS PubMed.
- I. D. Mall, V. C. Srivastava, N. K. Agarwal and I. M. Mishra, Chemosphere, 2005, 61, 492–501 CrossRef CAS PubMed.
- J. H. Sun, Y. K. Wang, R. X. Sun and S. Y. Dong, Mater. Chem. Phys., 2009, 115, 303–308 CrossRef CAS.
- V. P. Dinesh, P. Biji, A. Ashok, S. K. Dhara, M. Kamaruddin, A. K. Tyagi and B. Raj, RSC Adv., 2014, 4, 58930–58940 RSC.
- S. Liu, Y. Cai, X. Cai, H. Li, F. Zhang, Q. Mu, Y. Liu and Y. Wang, Appl. Catal., A, 2013, 453, 45–53 CrossRef CAS.
- F. Lu, W. Cai and Y. Zhang, Adv. Funct. Mater., 2008, 18, 1047–1056 CrossRef CAS.
- S. Sakthivel, B. Neppolian, M. V. Shankar, B. Aeaibindoo, M. Palanichamy and V. Murugesan, Sol. Energy Mater. Sol. Cells, 2003, 77, 65–82 CrossRef CAS.
- C. Hariharan, Appl. Catal., A, 2006, 304, 55–61 CrossRef CAS.
- H. R. Liu, G. X. Shao, J. F. Zhao, Z. X. Zhang, Y. Zhang, J. Liang, X. G. Liu, H. S. Jia and B. S. Xu, J. Phys. Chem. C, 2012, 116, 16182–16190 CAS.
- D. Liu, H. Wu, R. Zhang and W. Pan, Chem. Mater., 2009, 21, 3479–3484 CrossRef.
- A. B. Djurišić and Y. H. Leung, Small, 2006, 8–9, 944–961 CrossRef PubMed.
- L. E. Greene, B. D. Yuhas, M. Law, D. Zitoun and P. Yang, Inorg. Chem., 2006, 45, 7535–7543 CrossRef CAS PubMed.
- L. E. Greene, M. Law, J. Goldberger, F. Kim, J. C. Johnson, Y. Zhuang, R. J. Saykally and P. Yang, Angew. Chem., Int. Ed., 2003, 42, 3031–3034 CrossRef CAS PubMed.
- S. Xu and Z. L. Wang, Nano Res., 2011, 4, 1013–1098 CrossRef CAS.
- T. G. Xu, L. W. Zhang, H. Y. Cheng and Y. F. Zhu, Appl. Catal., B, 2011, 101, 382–387 CrossRef CAS.
- G. Zhou and J. Deng, Mater. Sci. Semicond. Process., 2007, 10, 90–95 CrossRef CAS.
- H. Qin, W. Li, Y. Xia and T. He, ACS Appl. Mater. Interfaces, 2011, 3, 3152–3156 CAS.
- X. Li, J. Yu, J. Low, Y. Fang, J. Xiao and X. Chen, J. Mater. Chem. A, 2015, 3, 2485–2534 CAS.
- J. Liqiang, W. Dejun, W. Baiqi, L. Shudan, X. Baifu, F. Honggang and S. Jiazhong, J. Mol. Catal. A: Chem., 2006, 244, 193–200 CrossRef.
- N. Udawatte, M. Lee, J. Kim and D. Lee, ACS Appl. Mater. Interfaces, 2011, 3, 4531–4538 CAS.
- J. Low, J. Yu, Q. Li and B. Cheng, Phys. Chem. Chem. Phys., 2014, 16, 1111–1120 RSC.
- R. Georgekutty, M. K. Seery and S. C. Pillai, J. Phys. Chem. C, 2008, 112, 13563–13570 CAS.
- S. Kuriakose, V. Choudhary, B. Satpati and S. Mohapatra, Phys. Chem. Chem. Phys., 2014, 16, 17560–17568 RSC.
- X. Zhou, G. Liu, J. Yu and W. Fan, J. Mater. Chem., 2012, 22, 21337 RSC.
- S. Linic, P. Christopher and D. B. Ingram, Nat. Mater., 2011, 10, 911–921 CrossRef CAS PubMed.
- C. Hu, T. Peng, X. Hu, Y. Nie, X. Zhou, J. Qu and H. He, J. Am. Chem. Soc., 2010, 127, 7632–7637 Search PubMed.
- X. Yan, X. Wang, W. Gu, M. Wu, Y. Yan, B. Hu, G. Che, D. Han, J. Yang, W. Fan and W. Shi, Appl. Catal., B, 2015, 164, 297–304 CrossRef CAS.
- P. Christopher, H. Xin and S. Linic, Nat. Chem., 2011, 3, 467–472 CAS.
- Q. Deng, X. Duan, D. H. L. Ng, H. Tang, Y. Yang, M. Kong, Z. Wu, W. Cai and G. Wang, ACS Appl. Mater. Interfaces, 2012, 4, 6030–6037 CAS.
- Y. H. Zheng, L. R. Zheng, Y. Y. Zhan, X. Y. Lin, Q. Zheng and K. M. Wei, Inorg. Chem., 2007, 46, 6980–6986 CrossRef CAS PubMed.
- J. S. Xie and Q. S. Wu, Mater. Lett., 2010, 64, 389–392 CrossRef CAS.
- Y. Lai, M. Meng and Y. Yu, Appl. Catal., B, 2010, 100, 491–501 CrossRef CAS.
- X. Cai, D. Hu, S. Juan, B. Qian, Y. Wang, J. Wu and Y. Wang, Sens. Actuators, B, 2014, 198, 402–410 CrossRef CAS.
- X. Y. Cai, Y. Cai, S. Y. Liu, H. Li, F. Zhang and Y. Wang, J. Phys. Chem. Solids, 2013, 74, 1196–1203 CrossRef CAS.
- G. J. Millar, J. B. Metson, G. A. Bowmaker and R. P. Cooney, J. Chem. Soc., Faraday Trans., 1995, 91, 4149–4159 RSC.
- S. Erdemoğlu, S. K. Aksu, F. Sayılkan, B. İzgi, M. Asiltürk, H. Sayılkan, F. Frimmel and Ş. Güçer, J. Hazard. Mater., 2008, 155, 469–476 CrossRef PubMed.
- D. F. Li, Y. H. Guo, C. W. Hu, C. J. Jiang and E. B. Wang, J. Mol. Catal. A: Chem., 2004, 207, 183–193 CrossRef CAS.
- X. Cai, B. Han, S. Deng, Y. Wang, C. Dong, Y. Wang and I. Djerdj, CrystEngComm, 2014, 16, 7761 RSC.
- J. M. Wu and W. Wen, Environ. Sci. Technol., 2010, 44, 9123–9127 CrossRef CAS PubMed.
- E. Kowalska, O. O. P. Mahaney, R. Abe and B. Ohtani, Phys. Chem. Chem. Phys., 2010, 12, 2344–2355 RSC.
- H. Goto, Y. Hanada, T. Ohno and M. Matsumura, J. Catal., 2004, 225, 223–229 CrossRef CAS.
Footnote |
| † Electronic supplementary information (ESI) available: Fig. S1. XRD pattern of as-prepared 4%Ag–ZnO heterostructure nanoparticles; Fig. S2. Four photocatalytic degradation cycles of 25 mg L−1 CR solution using 3%Ag–ZnO heterostructure nanoparticles under visible irradiation; Fig. S3. (a) Degradation rates for 15 mg L−1 CR solution at different time intervals for as-prepared samples; UV-vis absorption spectra of CR solutions (15 mg L−1) before and after photodegradation treatment with as-prepared (b) ZnO nanoparticles, (c) 2%Ag–ZnO nanoparticles, (d) 3%Ag–ZnO nanoparticles, (e) 4%Ag–ZnO nanoparticles, (f) 5%Ag–ZnO nanoparticles; insets are the photographs of CR solutions before and after photodegradation treatment with corresponding samples at different time intervals respectively; Fig. S4. (a) Degradation rates for 50 mg L−1 CR solution at different time intervals for as-prepared samples; UV-vis absorption spectra of CR solutions (50 mg L−1) before and after photodegradation treatment with as-prepared (b) ZnO nanoparticles, (c) 2%Ag–ZnO nanoparticles, (d) 3%Ag–ZnO nanoparticles, (e) 4%Ag–ZnO nanoparticles, (f) 5%Ag–ZnO nanoparticles; insets are the photographs of CR solutions before and after photodegradation treatment with corresponding samples at different time intervals respectively; Fig. S5. Kinetics of the as-prepared Ag–ZnO heterostructure nanoparticles toward (a) 15 mg L−1, (b) 25 mg L−1 and (c) 50 mg L−1 Congo red solutions with visible irradiation. And the catalysts used in (a), (b) and (c) are 3%Ag–ZnO, 3%Ag–ZnO and 4%Ag–ZnO heterostructure nanoparticles. See DOI: 10.1039/c5ra03143e |
| This journal is © The Royal Society of Chemistry 2015 |