Preparation of 2D hydroxyl-rich carbon nitride nanosheets for photocatalytic reduction of CO2
Yan Huangab,
Yanjie Wanga,
Yiqing Bia,
Jiarui Jina,
Muhammad Fahad Ehsana,
Min Fu*b and
Tao He*a
aCAS Laboratory of Nanosystem and Hierarchical Fabrication, National Center for Nanoscience and Technology, Beijing 100190, China. E-mail: het@nanoctr.cn; Fax: +86-10-62656765; Tel: +86-10-82545655
bChongqing Key Laboratory of Catalysis and Functional Organic Molecules, College of Environmental and Biological Engineering, Chongqing Technology and Business University, Chongqing 400067, China. E-mail: fumin1022@126.com; Tel: +86-23-62768474
First published on 2nd April 2015
Abstract
Hydroxyl-rich g-C3N4 nanosheets were prepared by ultrasonic exfoliation of bulk g-C3N4 in water. The samples were characterized by X-ray diffraction, scanning electron microscopy, transmission electron microscopy, atomic force microscopy, UV-vis absorption spectroscopy, photoluminescence spectroscopy, time-resolved fluorescence decay spectroscopy, Fourier-transform infrared spectroscopy, X-ray photoelectron spectroscopy and photocurrent response. The results indicated that the bulk g-C3N4 was exfoliated to five or six layers. The specific surface area increased from 8.66 m2 g−1 for the bulk g-C3N4 to 26.48 m2 g−1 for the nanosheets. More importantly, the amount of hydroxyl group on the g-C3N4 surface increased greatly upon ultrasonic treatment in water. Meanwhile, the separation rate of charge carriers was improved greatly and the conduction band potential shifts to a more negative value. All these can explain the enhanced activity of g-C3N4 nanosheets for visible-light photocatalytic reduction of CO2.
Introduction
Global warming caused by huge consumption of fossil fuels has been a hot issue in recent years. Traditional methods to solve this issue involve carbon capture and storage technology.1 Photocatalytic conversion of CO2 into hydrocarbons (e.g., CH4, CH3OH, etc.) is a promising method that can alleviate the energy crisis and solve the “greenhouse effect” simultaneously. But the reduction of CO2 is quite a challenge owing to its inert and stable property (ΔfG298° = −394.36 kJ mol−1).2 Accordingly, the activation of CO2 is the key step in this process. Inoue and co-workers reported the photocatalytic reduction of CO2 and proposed the basic process of the reactions.3 Semiconductor has discontinuous energy band, which can be excited under light irradiation to generate electrons in conduction band (CB) and holes in valence band (VB). The electrons with a potential negative enough can reduce the CO2 into hydrocarbons. So far many semiconductors have been used to photoreduce CO2, such as TiO2, BiVO4, Zn2GeO4, SrTiO3 and the like.4–7 Meanwhile, different nanostructures (such as Fe2V4O13 nanoribbon, BiWO6 nanosheet and W18O49 nanowire) have been employed.8–10Among these materials, 2D nanosheets have gained great attention due to the unique optical and electronic properties associated with their ultra-thin nanostructure. Graphene, which consists of a single layer of carbon atoms bonded in hexagonal lattice, shows higher carrier mobility and larger specific surface area than its parent graphite. These properties make it the most studied material that is widely used in many fields, such as heterogeneous catalysis, solar cells and super capacitor.11–13 The materials with similar 2D nanostructure (such as BN, MoS2 and WS2) have been studied thereafter, which possess a layered structure and can be exfoliated to single or a few layers by ultrasound exfoliation, thermal treatment and ball milling.14–16 For photocatalysis, the nanosheet materials are in favour of improving the photocatalytic efficiency due to the fast transfer and promoted separation of charge carriers.
Similar to the graphite, graphitic-like carbon nitride (g-C3N4) also exhibits layered structure, which consists of π-conjugated planes packed together with sp2 hybridization of C and N via weak van der Waals force between layers. It was firstly used for water splitting by Wang and co-workers in 2009.17 It can also be used for photodegradation of pollutants,18 photoreduction of CO2,19 air purification,20,21 oxidation of NO,22 and selective oxidation of aromatic alcohols23 due to the merit of suitable energy-band structure (2.7 eV), nontoxic, low-cost and easy synthesis. The most popular method to synthesize g-C3N4 is thermal condensation of nitrogen-rich precursors like urea, dicyandiamide and melamine. The as-prepared bulk g-C3N4 exhibits small specific surface area (∼3.3 m2 g−1) and poor photocatalytic activity due to the grain boundary effects that leads to high recombination rate of charge carriers.24 Similar to the preparation of graphene, the 2D g-C3N4 nanosheets can also be prepared by thermal oxidation “etching” and ultrasonic exfoliation. The g-C3N4 nanosheets, nanoribbons and quantum dots have been synthesized by heat etching, acidic cutting and hydrothermal cutting of bulk g-C3N4,25 which exhibit higher activity of hydrogen production than bulk g-C3N4.
Herein, we employed ultrasonic exfoliation of bulk g-C3N4 to synthesize 2D g-C3N4 nanosheets. The weak interplanar interaction between the layers in g-C3N4 makes it be exfoliated easily into nanosheets in polar solvent. Hence, the choice of solvent is important during the ultrasonic exfoliation process. As H2O has strong polarity, it was chosen as the solvent to exfoliate the bulk g-C3N4 because its strong polarity could lead to easy exfoliation of g-C3N4. The hydroxyl-rich g-C3N4 nanosheets were thus obtained, which exhibited enhanced activity for photocatalytic reduction of CO2 into CH4. The enhancement mechanism was also discussed in detail.
Experimental
Sample preparation
Melamine (analytical grade, 99%) was bought from Sinopharm Chemical Reagent Co. Ltd., China. It was used without further purification. The water used in this work was purified by a Milli-Q Plus system (Millipore, France) with 18.2 MΩ cm resistivity at 20 °C. The bulk C3N4 (B-CN) was prepared by thermal condensation of melamine. About 5 g of melamine was put in an alumina combustion boat and heated to 550 °C in muffle furnace with a heating rate of 3 °C min−1. After kept at 550 °C for 2 h in ambient atmosphere, the sample was cooled to room temperature. The obtained yellow agglomerate was ground and collected for further use. The C3N4 nanosheets (G-CN) were synthesized by ultrasonic exfoliation of the bulk C3N4. About 0.1 g of bulk C3N4 was added into 200 mL of H2O, followed by ultrasonic treatment for 12 h. The obtained suspension was centrifuged and dried at 80 °C for overnight.Characterization
The crystallinity of as-prepared samples were characterized by X-ray diffraction (XRD) on a Bruker D8 diffractometer with Cu-Kα radiation (λ = 1.5406 Å). The generator current and voltage were 40 mA and 40 kV, respectively. UV-visible diffuse reflectance spectroscopy (DRS) was performed on a Lambda 750 UV/Vis/NIR spectrophotometer (Perkin-Elmer, USA) using BaSO4 as the reference. X-ray photoelectron spectroscopy (XPS) was carried out with Thermo Scientific ESCALAB250 instrument using a monochromatized Al Kα as the excitation source. The C1s (284.8 eV) was used to calibrate the binding energy (BE). The morphology of the samples was examined with scanning electron microscopy (SEM, Hitachi S4800). Atomic force microscopy (AFM) was performed by Dimension 3100 SPM (Veeco, USA). Detailed microstructure analysis of as-prepared sample was done on a transmission electron microscopy (TEM, FEI Tecnai G2 20) operated at an accelerating voltage of 200 kV. Fourier transform infrared spectra (FTIR) were collected between 450 and 4000 cm−1 on a Perkin-Elmer spectrometer using the KBr pellet. Nitrogen adsorption–desorption isotherm curves were recorded on a Micromeritics TriStarII 3020 surface area and porosity analyzer (USA) at −196 °C. Photoluminescence (PL) spectra were collected on a LS55 spectrophotometer (Perkin-Elmer, USA) with an excitation wavelength of 350 nm at room temperature. Both slits of the excitation and emission were 3.0 nm. Time-resolved fluorescence decay spectra were measured on iHR320 (HORIBA JobinYvon, France) by time-correlated single photo counting. The silica gel was used as the reference. The light source was nanoLED with a wavelength of 344 nm.Photocatalytic reduction of CO2
The photocatalytic activity of the as-prepared materials was evaluated by the photoreduction of CO2 under visible-light irradiation (λ > 420 nm). The photoreduction system was described previously.26,27 The visible light was obtained from a 300 W Xe lamp (PLS-SXE300, Beijing) equipped with a 420 nm cut-off filter. The reaction was carried out in a quartz reactor at a temperature of 15 °C and pressure of 25 kPa. For the photoreduction of CO2, a certain amount of photocatalyst was dispersed in 80 mL of distilled water under sonication. The reaction system was vacuumed, followed by purging the compressed CO2 (≥99.999%) into the system. This process was repeated three times to ensure the system was under anaerobic condition. Before irradiation, the suspension was magnetically stirred in the dark for 30 min to achieve absorption–desorption equilibrium of CO2. The typical reaction time was 8 h. The products were collected every half an hour and analyzed online by gas chromatograph (Agilent 7890A) equipped with flame ionization detector (FID) and thermal conductivity detector (TCD). Helium (He) was used as the carrier gas. The system was purged with nitrogen for at least 30 min after the reaction was completed in order to remove the residual products. Three blank experiments were performed without photocatalyst and/or light irradiation, and using N2 instead of CO2 so as to study whether or not the obtained products were the results of photocatalytic reduction of CO2 under visible-light irradiation.Photoelectrochemical test
The photocurrent response was tested on a Zahner controlled intensity modulated photo spectroscopy system (CIMPS, Germany). A standard three-electrode system was used in the photoelectrochemical test. The system consisted of a platinum wire as the counter electrode, a saturated calomel electrode (SCE) as the reference electrode, and the as-prepared sample as working electrode. The 0.5 M Na2SO4 was used as electrolyte solution. A low power LED was used as the light source and the focused intensity was ∼10 mW cm−2. The photoresponse measurements were tested at 0.5 V with light on and off. The working electrode was prepared by dispersing 5 mg of the as-prepared photocatalyst in 1 mL Milli-Q water under sonication. The resultant suspension (10 μL) was dropped on a FTO glass substrate with 0.5 × 0.7 cm2 area and then annealed at 120 °C for 1 h to improve the adhesion.Results and discussion
Phase and microstructure
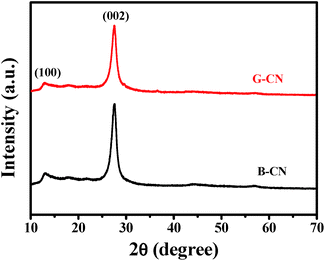
The crystal structure of the as-prepared samples was analyzed by XRD (Fig. 1). The B-CN and G-CN exhibit similar diffraction peaks at 13.0° and 27.5°, which is consistent with the hexagonal phase of graphitic C3N4 (JCPDS 87-1526).17 The broad peak at 13.0° is related to the (100) lattice plane of tri-s-triazine and the corresponding interlayer distance is 0.681 nm. The strong peak at 27.5° is indexed to the (002) crystal plane of stacking layered structure with an interplanar distance of 0.324 nm.28 No remarkable change in the peak position and crystal phase can be observed before and after the ultrasonic treatment, while the only difference is that the G-CN shows weaker peak intensity than B-CN due to the formation of nanosheets.The SEM and TEM images were used to analyze the surface morphology and microstructure of the as-prepared samples. The B-CN is the solid agglomerates with sizes ranging from several hundreds of nm to a few μm (Fig. 2a), which is confirmed by TEM image (Fig. 2b). After the bulk material was treated by ultrasonication, it became thin nanosheets with a few hundreds of nm (Fig. 2c). But the edge of G-CN is partially curly due to the ultrathin structure and the crystal lattice of G-CN can hardly be recognized by HRTEM (Fig. 2d) due to its rapid degradation under irradiation of electron beam owing to the organic nature of g-C3N4.29 The SAED image shows a diffraction ring (inset of Fig. 2d), indicating that the g-C3N4 is polycrystalline in nature. The diffraction ring is indexed to (002) lattice plane with a layer distance of 0.324 nm, which agrees with the XRD results.
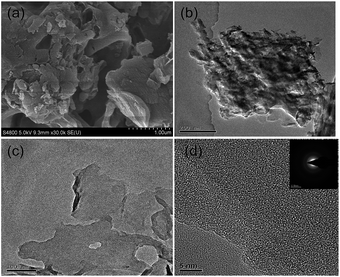 | ||
| Fig. 2 (a) SEM image and (b) TEM image of the B-CN, and (c) TEM image and (d) HRTEM image of the G-CN. Inset of (d) is SAED of the G-CN. | ||
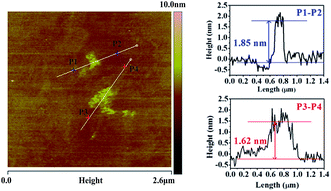
The thickness of G-CN was measured by using AFM image (Fig. 3). The average height between P1 and P2 was 1.85 nm, and was 1.62 nm between P3 to P4. Since the interlayer distance is about 0.324 nm in terms of the HRTEM results, it is estimated that the obtained G-CN nanosheets consist of about five or six C–N layers.30–32
Texture analysis
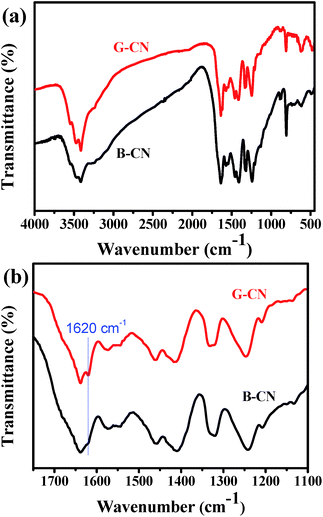
The FTIR spectra of B-CN and G-CN are shown in Fig. 4a. It is found that the G-CN has almost identical characteristic peaks to B-CN, indicating that the chemical structure of g-C3N4 is kept after being exfoliated into nanosheets. The peak at ∼810 cm−1 is assigned to the typical breathing mode of s-triazine ring. The out-of-plane bending mode of N–H at 888 cm−1 also appears in the spectra.33 The peaks appearing between 1200 and 1650 cm−1 are ascribed to the stretching vibration modes of C–N and C![[double bond, length as m-dash]](https://www.rsc.org/images/entities/char_e001.gif) N heterocycles.34 The broad peak at 3000–3700 cm−1 corresponds to the N–H stretching vibration of uncondensed amine groups and adsorbed hydroxyl groups.34 Interestingly, a peak at ∼1620 cm−1 can be observed in the spectra for both B-CN and G-CN (Fig. 4b). This peak is arisen from the deformation vibration mode of –OH. Clearly, the intensity of this peak for G-CN is stronger than that for B-CN. So more –OH groups are present on the surface of G-CN compared to B-CN. The enhanced intensity of the broad peak at 3000–3700 cm−1 may also confirm the increasing amount of –OH groups in the G-CN.
N heterocycles.34 The broad peak at 3000–3700 cm−1 corresponds to the N–H stretching vibration of uncondensed amine groups and adsorbed hydroxyl groups.34 Interestingly, a peak at ∼1620 cm−1 can be observed in the spectra for both B-CN and G-CN (Fig. 4b). This peak is arisen from the deformation vibration mode of –OH. Clearly, the intensity of this peak for G-CN is stronger than that for B-CN. So more –OH groups are present on the surface of G-CN compared to B-CN. The enhanced intensity of the broad peak at 3000–3700 cm−1 may also confirm the increasing amount of –OH groups in the G-CN.
The chemical composition and chemical states of elements were studied by XPS. The C, N and O XPS signals can be observed in the survey spectra for both B-CN and G-CN (Fig. 5a). The O1s signal is due to the adsorbed H2O molecules and hydroxyl groups on the surface of catalysts, which is confirmed by FTIR spectra (Fig. 4). There are two peaks at 284.8 and 288.3 eV in the C1s XPS spectra after deconvolution (Fig. 5b). The former is ascribed to sp2 C–C, while the latter is the sp2-hybridized carbon in N-containing aromatic ring (N–C![[double bond, length as m-dash]](https://www.rsc.org/images/entities/char_e001.gif) N).35 It is noted that four peaks can be observed in the N1s spectra after deconvolution (Fig. 5c). The major peak with a binding energy of 398.6 eV is assigned to the sp2-hybridized nitrogen in the triazine rings (C–N
N).35 It is noted that four peaks can be observed in the N1s spectra after deconvolution (Fig. 5c). The major peak with a binding energy of 398.6 eV is assigned to the sp2-hybridized nitrogen in the triazine rings (C–N![[double bond, length as m-dash]](https://www.rsc.org/images/entities/char_e001.gif) C). The peaks at 399.2 and 401.0 eV are attributed to the bridging N atoms (e.g. C–N(–C)–C or C–N(–H)–C) and terminal –NH2 at the edge of graphitic carbon nitride, respectively. The weak peak at 404.7 eV may be related to the charging effects.36 The O1s signal can be deconvoluted into two Gaussian peaks (Fig. 5d). The peak at 531.8 and 532.9 eV in B-CN can be ascribed to chemically adsorbed hydroxyl group (–OH) and adsorbed H2O, respectively. After ultrasonic treatment in H2O, the O1s signal from –OH and H2O shifts to 532.1 and 533.2 eV, respectively. The peak area ratio of –OH to H2O is used to estimate the change in relative quantity of –OH groups on the surface. The ratio is 1.74 and 6.76 before and after ultrasonic treatment, respectively. Thus, there are more hydroxyl groups on the surface of G-CN, leading to the 0.3 eV of shift toward high binding energy after ultrasonic treatment. Such conclusion is consistent with that from FTIR results.
C). The peaks at 399.2 and 401.0 eV are attributed to the bridging N atoms (e.g. C–N(–C)–C or C–N(–H)–C) and terminal –NH2 at the edge of graphitic carbon nitride, respectively. The weak peak at 404.7 eV may be related to the charging effects.36 The O1s signal can be deconvoluted into two Gaussian peaks (Fig. 5d). The peak at 531.8 and 532.9 eV in B-CN can be ascribed to chemically adsorbed hydroxyl group (–OH) and adsorbed H2O, respectively. After ultrasonic treatment in H2O, the O1s signal from –OH and H2O shifts to 532.1 and 533.2 eV, respectively. The peak area ratio of –OH to H2O is used to estimate the change in relative quantity of –OH groups on the surface. The ratio is 1.74 and 6.76 before and after ultrasonic treatment, respectively. Thus, there are more hydroxyl groups on the surface of G-CN, leading to the 0.3 eV of shift toward high binding energy after ultrasonic treatment. Such conclusion is consistent with that from FTIR results.
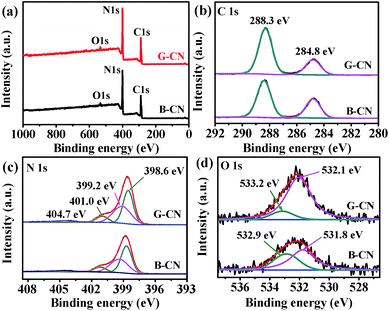 | ||
| Fig. 5 (a) XPS survey spectra of B-CN and G-CN, high-resolution XPS spectra of (b) C1s, (c) N1s and (d) O1s. | ||
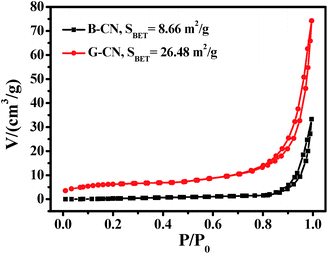
The specific surface area of B-CN and G-CN has been determined by nitrogen adsorption–desorption analysis at the relative pressure range (P/P0) of 0–1 (Fig. 6). The isotherm curves of the photocatalysts can be classified as type IV with a H3 hysteresis loop,37,38 which is caused by the existence of slit-like mesopores due to the aggregation of sheet-like materials. The specific surface area of B-CN and G-CN is calculated to be 8.66 and 26.48 m2 g−1, respectively. The specific surface area for G-CN is ∼3 times of that for B-CN, revealing the effective exfoliation of bulk g-C3N4. This maybe in favour of enhancing photocatalytic activity, as more active sites can be exposed and more CO2 can be adsorbed during the photocatalytic process.
Alignment of energy levels
The optical absorption property and energy band gap of B-CN can be affected by the ultrasonic treatment. As revealed by the UV-vis DRS spectra (Fig. 7a), the absorption edge is ∼448 nm for B-CN and is 441 nm for G-CN. Such blue shift is due to the quantum-size confinement effect.39,40 The corresponding band gap energy can be estimated by the equation (αhν)n = B(hν − Eg), where hν is the photon energy, α is the absorption coefficient, B is a constant relevant to the material itself, n is 2 and 3/2 for a direct and indirect band gap semiconductor, respectively.41 Here n is 2 since G-CN is a direct band gap semiconductor. The plots of (αhν)2 vs. photo energy (hν) are displayed in Fig. 7b. The band gap of B-CN and G-CN can thus be determined to be 2.77 and 2.81 eV, respectively.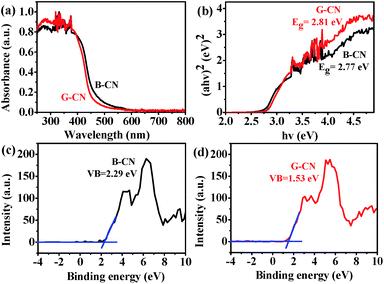 | ||
| Fig. 7 (a) UV-vis DRS spectra of the B-CN and G-CN, (b) corresponding plots of (αhν)2 vs. photo energy (hν) for the band gap, and XPS valence band spectra of (c) B-CN and (d) G-CN. | ||
The band structure of B-CN and G-CN is investigated by XPS valence band (VB) spectra. As shown in Fig. 7c and d, the VB minimum for B-CN and G-CN is determined to be 2.29 and 1.53 eV, respectively. Since the work function of XPS instrument is 4.62 eV, the VB potential for B-CN and G-CN is calculated to be 2.41 V and 1.65 V (vs. SHE, provided 4.5 eV vs. vacuum level is 0 V vs. SHE), respectively.42 The conduction band (CB) maximum of B-CN and G-CN can thus be calculated respectively to be −0.36 and −1.16 V by using the band gap energy mentioned above. Hence, the alignment of energy levels can be drawn as shown in Scheme 1. The notable difference between B-CN and G-CN may be due to the presence of much more surface hydroxyl groups in G-CN that can cause surface disorder. Similar phenomena have been reported in TiO2.43–45 The dipole moment effect of hydroxyl groups modified on the semiconductor surface may also contribute to this. In addition, the influence of quantum confinement may not be ignored as the size moves to nanoscale after exfoliation.20,21
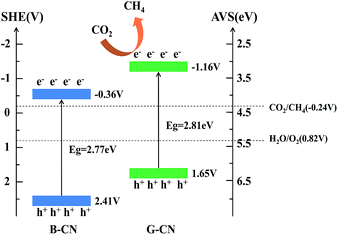 | ||
| Scheme 1 Band structure and transfer of charge carriers in the B-CN and G-CN. The potential of CO2/CH4 is also shown in the diagram. | ||
Photocatalytic performance and mechanism
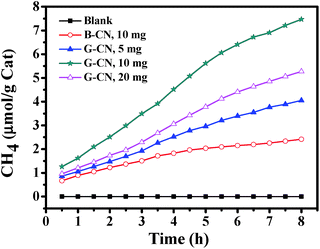
The photocatalytic activity of the as-prepared catalysts has been evaluated by photoreduction of CO2. The major product is CH4, while other possible products (such as CO, CH3OH, HCHO, HCOOH, and CH3CH2OH) cannot be detected. No product is observed in all of the blank experiments (without photocatalyst, without light irradiation, or using N2 instead of CO2). Hence, the obtained CH4 is the product of CO2 photoreduction over the catalyst. Firstly, different amount of G-CN has been used, i.e., 5, 10 and 20 mg (Fig. 8). It is found that the highest yield of CH4 (7.47 μmol g−1 after 8 h of reaction) is produced with 10 mg of G-CN, followed by 20 mg of G-CN (5.28 μmol g−1), and the lowest yield for 5 mg of G-GN (4.05 μmol g−1). Thus, excess and insufficient amount of the catalysts can both result in the low production yield of CH4. When the amount of the catalyst is insufficient, the yield of CH4 is low mainly due to the shortage of the catalyst. In case of the excess amount of the catalyst, the low yield is possibly because of the poor dispersion of large amount of the catalysts that can cause serious aggregation and, thereby, lead to low accessibility to both the light absorption and reactants (CO2 and H2O). The above results with different amount of the catalysts can also confirm the conclusion that the obtained CH4 comes from the photocatalytic conversion of CO2 over the G-CN catalyst, and not from any other resources. The B-CN is also used to photoreduce CO2 with moderate amount (i.e., 10 mg). It is found that the B-CN produces a much lower yield of CH4 (2.42 μmol g−1 after 8 h) than the G-CN (7.47 μmol g−1) with the same amount of the catalyst (Fig. 8), i.e., the latter is about 3 times of the former. Hence, the G-CN shows much higher photocatalytic activity than the B-CN.The stability of the G-CN catalyst has been investigated by repeating the reduction reaction for at least three times (Fig. 9a). It is found that the production yield of CH4 after 8 h is 6.88 μmol g−1 after three runs, which is slightly lower than that for the first run (7.47 μmol g−1). Moreover, no obvious change can be observed in the XRD patterns of the G-CN before and after three runs of the photoreduction (Fig. 9b). Thus, the G-CN exhibits good structural stability and steady photocatalytic activity over the photocatalytic conversion of CO2.
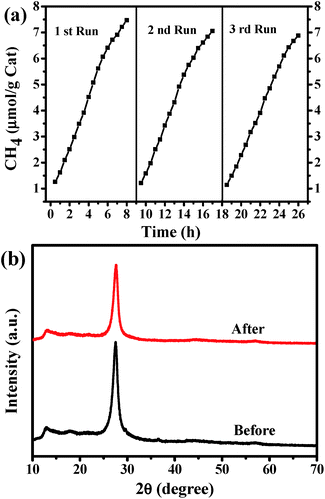 | ||
| Fig. 9 (a) Repeated photocatalytic reduction of CO2 over G-CN under visible-light irradiation (λ > 420 nm), and (b) XRD patterns of the G-CN before and after 3 recycle runs. | ||
The mechanism of photocatalytic reduction of CO2 with B-CN and G-CN can be explained using Scheme 1. Both the B-CN and G-CN possess suitable band gap energy that can be excited by visible light and generate photoexcited electrons and holes. The resultant holes in the VB can oxidize H2O to produce O2 via the reaction of H2O → 1/2O2 + 2H+ + 2e− since the potential (2.41 V for B-CN and 1.65 V for G-CN) is more positive than that of the H2O/O2 (0.82 V vs. SHE). Here the O2 was not detected in this work. The CB potential for both B-CN and G-CN (−0.36 and −1.16 V, respectively) is negative enough for the photogenerated electrons to reduce CO2 absorbed on the catalyst surface to produce CH4 via the half-reaction of CO2 + 8e− + 8H+ → CH4 + 2H2O (E = −0.24 V, vs. SHE).
Enhancement mechanism
The reason that G-CN shows higher photocatalytic activity than B-CN can be elucidated as follows. First, the CB potential of G-CN is more negative than that of B-CN. So the electrons photogenerated in G-CN have higher reducing capability than those in B-CN, indicating that the CO2 can be photocatalytically reduced into CH4 more easily using G-CN catalyst. Moreover, the G-CN has larger specific surface area than B-CN owing to its nanosheet structure. A larger surface area can provide more active sites for the surface reaction, which results in higher photocatalytic activity.In addition, the charge transfer can be facilitated due to the nanosheet nature of G-CN46 and the hydroxyl groups on the surface of G-CN.47,48 The separation of photogenerated charge carriers that plays an important role in the photocatalytic activity49 can thus be improved, leading to efficient suppression of their recombination. As a result, the photocatalytic activity of CO2 reduction can be enhanced. The efficient separation of charge carriers has been studied by measuring the PL spectra, fluorescence lifetime and photocurrent.
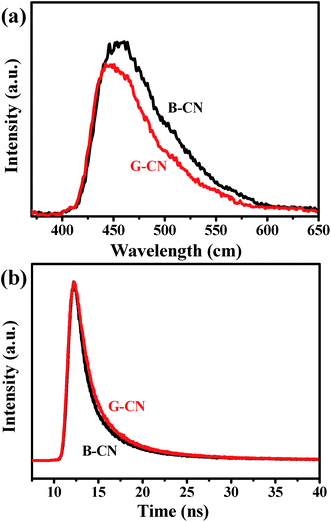
Fig. 10a shows the PL spectra collected with an excitation wavelength of 350 nm. The B-CN exhibits a strong peak centered at 467 nm, while the intensity decreases after the ultrasonic treatment (i.e., for the case of G-CN), indicating a lower recombination rate (i.e., higher separation rate). This can be further verified by the results of time-resolved fluorescence decay curves (Fig. 10b). Both the B-CN and G-CN display an exponential decay. The G-CN shows slower decay kinetics compared to B-CN. The decay curve can be fitted by using the tri-exponential decay kinetics (eqn (1)), where A, B1, B2 and B3 are constants. The results are listed in Table 1. The lifetime is contributed by three different processes, the non-radiative process (τ1), radiative process (τ2) and energy transfer process (τ3).50–52 The radiative process (τ2) is directly related to the recombination of photogenerated electrons and holes. It is found that the G-CN exhibits longer lifetime than B-CN for all the three different processes. Moreover, the relative percentage of τ2 for G-CN (42.84%) also increases compared to B-CN (38.09%). Thus, the separation efficiency of electrons and holes is improved greatly for G-CN.
 | (1) |
| Sample | τ1 (ns) (rel.%) | τ2 (ns) (rel.%) | τ3 (ns) (rel.%) |
|---|---|---|---|
| B-CN | 3.79 (48.63) | 0.78 (38.09) | 22.43 (13.28) |
| G-CN | 4.54 (45.40) | 1.16 (42.84) | 26.68 (11.76) |
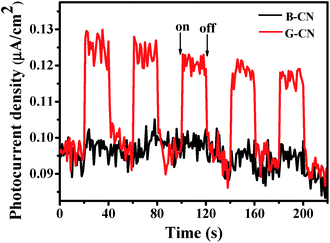
The transient photocurrent response can be used to further confirm the above-proposed charge-carrier separation.53,54 As shown in Fig. 11, both the B-CN and G-CN display relatively good stability after several runs of the measurements, which is consistent with the photocatalytic results (Fig. 9a). The increase in the photocurrent density for both B-CN and G-CN indicates that photogenerated electrons can be transferred to the FTO substrate to produce photocurrent upon light illumination. It is noted that the photocurrent density increases slightly for the B-CN upon irradiation, while it increases greatly for G-CN. This suggests that the G-CN exhibits a much higher photoresponse than B-CN, which is caused by the higher separation efficiency of charge carriers for G-CN.
Conclusions
In summary, we have synthesized the g-C3N4 nanosheets by ultrasonic exfoliation of bulk g-C3N4. Compared to the bulk g-C3N4, the g-C3N4 nanosheets exhibit a larger specific surface area, more surface hydroxyl groups, more negative conduction band potential, longer fluorescence lifetime, and higher photocurrent response. Thus, the g-C3N4 nanosheets show higher photocatalytic activity for the reduction of CO2 into CH4 under visible-light irradiation (λ ≥ 420 nm).Acknowledgements
This work was supported by the Ministry of Science and Technology of China (2015DFG62610).Notes and references
- Q. H. Yang, Z. H. Xu, M. H. Fan, R. Gupta, R. B. Slimane, A. E. Bland and I. Wright, J. Environ. Sci., 2008, 20, 14–27 CrossRef.
- Z. J. Huang, F. B. Li, B. F. Chen, T. Lu, Y. Yuan and G. Q. Yuan, Appl. Catal., B, 2013, 136–137, 269–277 CrossRef CAS PubMed.
- T. Inoue, A. Fujishima, S. Konishi and K. Honda, Nature, 1979, 277, 637–638 CrossRef CAS.
- Z. H. Zhao, J. M. Fan, J. Y. Wang and R. F. Li, Catal. Commun., 2012, 21, 32–37 CrossRef CAS PubMed.
- J. Mao, T. Y. Peng, X. H. Zhang, K. Li and L. Zan, Catal. Commun., 2012, 28, 38–41 CrossRef CAS PubMed.
- Q. Liu, Y. Zhou, J. H. Kou, X. Y. Chen, Z. P. Tian, J. Gao, S. C. Yan and Z. G. Zou, J. Am. Chem. Soc., 2010, 132, 14385–14387 CrossRef CAS PubMed.
- K. Xie, N. Umezawa, N. Zhang, P. Reunchan, Y. J. Zhang and J. H. Ye, Energy Environ. Sci., 2011, 4, 4211–4219 CAS.
- P. Li, Y. Zhou, W. G. Tu, Q. Liu, S. C. Yan and Z. G. Zou, ChemPlusChem, 2013, 78, 274–278 CrossRef CAS.
- Y. Zhou, Z. P. Tian, Z. Y. Zhao, Q. Liu, J. H. Kou, X. Y. Chen, J. Gao, S. C. Yan and Z. G. Zou, ACS Appl. Mater. Interfaces, 2011, 3, 3594–3601 CAS.
- G. C. Xi, S. X. Ouyang, P. Li, J. H. Ye, Q. Ma, N. Su, H. Bai and C. Wang, Angew. Chem., 2012, 124, 2445–2449 CrossRef.
- Y. Hou, F. Zou, A. Dagg and P. Y. Feng, Nano Lett., 2012, 12, 6464–6473 CrossRef CAS PubMed.
- J. X. Geng, L. J. Liu, S. B. Yang, S. C. Youn, D. W. Kim, J. S. Lee, J. L. Choi and H. T. Jung, J. Phys. Chem. C, 2010, 114, 14433–14440 CAS.
- M. D. Stoller, S. J. Park, Y. W. Zhu, J. H. An and R. S. Ruoff, Nano Lett., 2008, 8, 3498–3502 CrossRef CAS PubMed.
- J. H. Warner, M. H. Rümmeli, A. Bachmatiuk and B. Büchner, ACS Nano, 2010, 4, 1299–1304 CrossRef CAS PubMed.
- Y. Wang, C. H. Zhou, W. C. Wang and Y. P. Zhao, Ind. Eng. Chem. Res., 2013, 52, 4379–4382 CrossRef CAS.
- Y. G. Yao, Z. Y. Lin, Z. Li, X. J. Song, K. S. Moon and C. P. Wong, J. Mater. Chem., 2012, 22, 13494–13499 RSC.
- X. C. Wang, K. Maeda, A. Thomas, K. Takanabe, G. Xin, J. M. Carlsson, K. Domen and M. Antonietti, Nat. Mater., 2009, 8, 76–80 CrossRef CAS PubMed.
- M. L. Lu, Z. X. Pei, S. X. Weng, W. H. Feng, Z. B. Fang, Z. Y. Zheng, M. L. Huang and P. Liu, Phys. Chem. Chem. Phys., 2014, 16, 21280–21288 RSC.
- K. Maeda, R. Kuriki, M. W. Zhang, X. C. Wang and O. Ishitani, J. Mater. Chem. A, 2014, 2, 15146–15151 CAS.
- F. Dong, Z. Y. Wang, Y. H. Li, W. K. Ho and S. C. Lee, Environ. Sci. Technol., 2014, 48, 10345–10353 CrossRef CAS PubMed.
- F. Dong, M. Y. Ou, Y. K. Jiang, S. Guo and Z. B. Wu, Ind. Eng. Chem. Res., 2014, 53, 2318–2330 CrossRef CAS.
- Z. Y. Wang, W. Guan, Y. J. Sun, F. Dong, Y. Zhou and W. K. Ho, Nanoscale, 2015, 7, 2471–2479 RSC.
- Y. Chen, J. S. Zhang, M. W. Zhang and X. C. Wang, Chem. Sci., 2013, 4, 3244–3248 RSC.
- H. Xu, J. Yan, X. J. She, L. Xu, J. X. Xia, Y. G. Xu, Y. H. Song, L. Y. Huang and H. M. Li, Nanoscale, 2014, 6, 1406–1415 RSC.
- W. J. Wang, J. C. Yu, Z. R. Shen, D. K. L. Chan and T. Gu, Chem. Commun., 2014, 50, 10148–10150 RSC.
- M. F. Ehsan, M. N. Ashiq, F. Bi, Y. Q. Bi, S. Palanisamy and T. He, RSC Adv., 2014, 4, 48411–48418 RSC.
- M. F. Ehsan and T. He, Appl. Catal., B, 2015, 166–167, 345–352 CrossRef CAS PubMed.
- G. Z. Liao, S. Chen, X. Quan, H. T. Yu and H. M. Zhao, J. Mater. Chem., 2012, 22, 2721–2726 RSC.
- S. B. Yang, Y. J. Gong, J. H. Zhang, L. Zhan, L. L. Ma, Z. Y. Fang, R. Vajtai, X. C. Wang and P. M. Ajayan, Adv. Mater., 2013, 25, 2452–2456 CrossRef CAS PubMed.
- X. D. Zhang, X. Xie, H. Wang, J. J. Zhang, B. C. Pan and Y. Xie, J. Am. Chem. Soc., 2013, 135, 18–21 CrossRef CAS PubMed.
- H. X. Zhao, H. T. Yu, X. Quan, S. Chen, H. M. Zhao and H. Wang, RSC Adv., 2014, 4, 624–628 RSC.
- S. Bai, X. J. Wang, C. Y. Hu, M. L. Xie, J. Jiang and Y. J. Xiong, Chem. Commun., 2014, 50, 6094–6097 RSC.
- F. Dong, Z. Y. Wang, Y. J. Sun, W. K. Ho and H. D. Zhang, J. Colloid Interface Sci., 2013, 401, 70–79 CrossRef CAS PubMed.
- J. D. Hong, X. Y. Xia, Y. S. Wang and R. Xu, J. Mater. Chem., 2012, 22, 15006–15012 RSC.
- B. H. Long, J. L. Lin and X. C. Wang, J. Mater. Chem. A, 2014, 2, 2942–2951 CAS.
- A. Thomas, A. Fischer, F. Goettmann, M. Antonietti, J. O. Müller, R. Schlögl and J. M. Carlsson, J. Mater. Chem., 2008, 18, 4893–4908 RSC.
- K. S. W. Sing, D. H. Everett, R. A. W. Haul, L. Moscou, R. A. Pierotti, J. Rouquérol and T. Siemieniewska, Pure Appl. Chem., 1985, 57, 603–619 CrossRef CAS.
- Q. Li, H. Meng, P. Zhou, Y. Q. Zheng, J. Wang, J. G. Yu and J. R. Gong, ACS Catal., 2013, 3, 882–889 CrossRef CAS.
- M. W. Zhang and X. C. Wang, Energy Environ. Sci., 2014, 7, 1902–1906 CAS.
- M. Aresti, M. Saba, R. Piras, D. Marongiu, G. Mula, F. Quochi, A. Mura, C. Cannas, M. Mureddu, A. Ardu, G. Ennas, V. Calzia, A. Mattoni, A. Musinu and G. Bongiovanni, Adv. Funct. Mater., 2014, 24, 3341–3350 CrossRef CAS.
- H. Q. Sun, G. L. Zhou, S. Z. Liu, H. M. Ang, M. O. Tadé and S. B. Wang, Chem. Eng. J., 2013, 231, 18–25 CrossRef CAS PubMed.
- Z. G. Xiong, L. L. Zhang, J. Z. Ma and X. S. Zhao, Chem. Commun., 2010, 46, 6099–6101 RSC.
- X. B. Chen, L. Liu, P. Y. Yu and S. S. Mao, Science, 2011, 331, 746–750 CrossRef CAS PubMed.
- A. Naldoni, M. Allieta, S. Santangelo, M. Marelli, F. Fabbri, S. Cappelli, C. L. Bianchi, R. Psaro and V. D. Santo, J. Am. Chem. Soc., 2012, 134, 7600–7603 CrossRef CAS PubMed.
- M. M. Khan, S. A. Ansari, D. Pradhan, M. O. Ansari, D. H. Han, J. Lee and M. H. Cho, J. Mater. Chem. A, 2014, 2, 637–644 CAS.
- Q. Liu, D. Wu, Y. Zhou, H. B. Su, R. Wang, C. F. Zhang, S. C. Yan, M. Xiao and Z. G. Zou, ACS Appl. Mater. Interfaces, 2014, 6, 2356–2361 CAS.
- J. G. Yu, H. G. Yu, B. Cheng, M. H. Zhou and X. J. Zhao, J. Mol. Catal. A: Chem., 2006, 253, 112–118 CrossRef CAS PubMed.
- H. Shin, T. H. Byun, S. Lee, S. T. Bae and H. S. Jung, J. Phys. Chem. Solids, 2013, 74, 1136–1142 CrossRef CAS PubMed.
- G. G. Zhang, M. W. Zhang, X. X. Ye, X. Q. Qiu, S. Lin and X. C. Wang, Adv. Mater., 2014, 26, 805–809 CrossRef CAS PubMed.
- P. Niu, L. L. Zhang, G. Liu and H. M. Cheng, Adv. Funct. Mater., 2012, 22, 4763–4770 CrossRef CAS.
- X. Y. Guo, W. Y. Song, C. F. Chen, W. H. Di and W. P. Qin, Phys. Chem. Chem. Phys., 2013, 15, 14681–14688 RSC.
- Y. L. Yu, P. Zhang, L. M. Guo, Z. D. Chen, Q. Wu, Y. H. Ding, W. J. Zheng and Y. A. Cao, J. Phys. Chem. C, 2014, 118, 12727–12733 CAS.
- Q. C. Xu, D. V. Wellia, Y. H. Ng, R. Amal and T. T. Y. Tan, J. Phys. Chem. C, 2011, 115, 7419–7428 CAS.
- N. Daude, C. Gout and C. Jouanin, Phys. Rev. B: Solid State, 1977, 15, 3229–3235 CrossRef CAS.
| This journal is © The Royal Society of Chemistry 2015 |

