Mechanical and thermal properties of microcrystalline cellulose-reinforced soy protein isolate–gelatin eco-friendly films
Chenchen Li†
,
Jing Luo†,
Zhiyong Qin,
Hui Chen*,
Qiang Gao* and
Jianzhang Li*
MOE Key Laboratory of Wooden Material Science and Application, Beijing Key Laboratory of Wood Science and Engineering, College of Materials Science and Technology, Beijing Forestry University, Beijing 100083, China. E-mail: chenhui@bjfu.edu.cn; gao200482@163.com; lijzh@bjfu.edu.cn; Fax: +86-10-62338083; Tel: +86-10-62338083
First published on 19th June 2015
Abstract
Eco-friendly films containing soy protein isolate (SPI), gelatin, and microcrystalline cellulose (MCC) were made by casting. Effects of MCC content on mechanical and thermal properties of MCC-reinforced SPI–gelatin (MSG) films were studied. With the increase of MCC content, thickness and tensile strength (TS) of MSG films increased, and the elongation at break (EB) decreased. MSG films containing 3.5% MCC (MSG3.5) had limit values of the thickness, TS, and EB of 108%, 351%, and 27% of those of films without MCC, respectively, while all MSG films exhibited lower moisture content and total soluble matter compared to SPI–gelatin film. The film with 1.5% MCC (MSG1.5) had the minimum value of moisture content as 16.41%, and film with 2.5% MCC (MSG2.5) had the minimum value of total soluble matter as 24.87%. Scanning electron microscope photomicrographs showed that MCC dispersed well in the SPI–gelatin matrix, and the films had a relatively smooth surface. Blending of 2.5% MCC caused a rough and uneven surface, resulting in a more ductile failure of MSG2.5 films. Attenuated total reflectance-Fourier transform infrared spectroscopy revealed that there was no intermolecular association via chemical bonds between MCC and SPI–gelatin. Thermo-gravimetric analysis showed that the thermal degradation of MSG films initiated at higher and ended at lower temperature than the SPI–gelatin film. Data from differential scanning calorimetry scans indicated that MSG films had a smaller degree of crystallinity, which was also confirmed by test results of a dynamic mechanical analyzer. Blending MCC with SPI–gelatin film has been successful in obtaining better mechanical and thermal properties as well as reduced moisture sensitivity. In addition, the films became more transparent, and transmittance was improved.
1. Introduction
In recent years the demand to develop eco-friendly materials for coating, packaging,1,2 agriculture and medicine has greatly increased.3,4 Due to growing concerns over sustainability and bioeconomy, efforts toward producing eco-friendly polymer composite materials based on biodegradable polymers, e.g. proteins,5 cellulose,6 starch,7 and lignin,8 for various commercial applications have gained significant momentum.Soy protein isolate (SPI) is a kind of abound, inexpensive, biodegradable, and nutritional raw material.9 It is a mixture of proteins with different molecular properties. The two major globulins present in the SPI, 7S and 11S, amounting about 37% and 31% of the total extractable protein, have a good film-forming ability.10 Many researchers have confirmed SPI–based film have a certain mechanical strength and oxygen, water barrier properties in the presence of the plasticizer, which is widely used in the area of food engineering.11,12 However, the film obtained from unmodified SPI is very brittle and colored, and have relatively poor mechanical properties and moisture barrier properties, which is a critical issue for commercial applications.13,14 Gelatin (G) is another eco-friendly material obtained by partial degradation of collagen. It has been added to SPI to form composite films.12,15 All films were weakly colored and more extensible than the unmodified SPI films.16,17 Unfortunately, the low water resistance and the extremely high solubility of SPI–gelatin films hinder the application of this composite films.18
Microcrystalline cellulose (MCC) is a commercially available material prepared by acid hydrolysis of wood fiber, back-neutralization with alkali, and spray-dried.19 The resulting particles are porous, about 10–50 μm in diameter, with a high cellulose content and higher crystallinity. They are composed of aggregate bundles of multi-sized cellulose micro-fibrils that are strongly hydrogen bonded to each other.20–22 Recently, MCC has been successfully applied as a new kind of filler, because the reinforcing phase shows both a high aspect ratio and bending strength in synthetic and natural matrices. For example, MCC has been used as reinforcement in thermoplastic starch/poly(butylene adipate-co-terephthalate) films,23 citric acid modified potato starch films,24 and composite edible films based on hydroxypropyl methylcellulose.25 Despite numerous studies on composite films of MCC, there have been few reports on MCC reinforced SPI films.26
To improve the mechanical properties and moisture barrier properties of SPI films, in this work, the functional merits of MCC and gelatin were employed. MCC-reinforced SPI–gelatin (MSG) composite films were prepared. Effect of MCC content on film properties was investigated. Difference in properties including moisture content, total soluble matter, mechanical property, thermal property, and microstructure between SPI–gelatin film and MSG film were analyzed to explore the MCC-reinforced mechanism.
2. Experimental
2.1 Materials
SPI with protein content of 95% was purchased from Yuwang Ecological Food Industry Co., Ltd. (Shandong province, China). Gelatin with an isoelectric point about pH 7–9 and 4-hydroxyproline content of 127 mg g−1 proteins was purchased from Shandong Yishui XinLi Co., Ltd. (Yishui, Shandong province, China). MCC ((C6H10O5)n) with the granularity of 20 to 100 μm was acquired from Sinopharm Chemical Reagent Co., Ltd. (Shanghai, China). Glycerol (99% purity) was obtained from Beijing Chemical Reagents. Analytical grade of sodium hydroxide pellets was provided by Beijing Chemical Reagents. Deionized water was used for the preparation of all solutions.2.2 Preparation of MCC-reinforced SPI–gelatin films
SPI solution was prepared by mixing SPI (20 g) and glycerol (10 g) together in deionized water (370 g) with constant stirring of 30 min. The pH value of the solution was adjusted to 10 ± 0.1 with NaOH solution (30%, w/w). Then the solutions were heated for 30 min at 85 °C. Gelatin solution (5%, w/w) was hydrated at room temperature for 30 min, then dissolved in 50 °C water bath, adding glycerol (50%, w/w of gelatin) with mechanical stirring for about 20 min until completely dissolved.SPI solution and gelatin solution were mixed together under constant stirring with the ratio of 2![[thin space (1/6-em)]](https://www.rsc.org/images/entities/char_2009.gif) :
:![[thin space (1/6-em)]](https://www.rsc.org/images/entities/char_2009.gif) 1, adding certain amount (0, 0.5, 1.5, 2.5, 3.5% w/w, respectively) of MCC to get MSG film-forming solution. Table 1 shows the content of different samples. MSG film-forming solution was then placed under ultrasonic for about 5 min to remove bubbles. MSG solutions (40 mL) were cast onto Teflon-coated plates, and then dried at 45 °C for 20 h in a vacuum drying oven (Yiheng Scientific Instruments Equipment Co., Ltd. Shanghai, China). All films were standing at room temperature for 48 h after peeled off from plates. Films were named as MSGX, where X corresponds to the percentage content of MCC added.
1, adding certain amount (0, 0.5, 1.5, 2.5, 3.5% w/w, respectively) of MCC to get MSG film-forming solution. Table 1 shows the content of different samples. MSG film-forming solution was then placed under ultrasonic for about 5 min to remove bubbles. MSG solutions (40 mL) were cast onto Teflon-coated plates, and then dried at 45 °C for 20 h in a vacuum drying oven (Yiheng Scientific Instruments Equipment Co., Ltd. Shanghai, China). All films were standing at room temperature for 48 h after peeled off from plates. Films were named as MSGX, where X corresponds to the percentage content of MCC added.
| Sample | SPI (g) | Gelatin (g) | MCC (g) | Gly (g) | Water (g) |
|---|---|---|---|---|---|
| G | 0 | 2.0 | — | 1.0 | 37.0 |
| SPI | 2.0 | 0 | — | 1.0 | 37.0 |
| MSG0 | 2.0 | 1.0 | 0 | 1.0 | 36.0 |
| MSG0.5 | 2.0 | 1.0 | 0.2 | 1.0 | 35.8 |
| MSG1.5 | 2.0 | 1.0 | 0.6 | 1.0 | 35.4 |
| MSG2.5 | 2.0 | 1.0 | 1.0 | 1.0 | 35.0 |
| MSG3.5 | 2.0 | 1.0 | 1.4 | 1.0 | 34.6 |
2.3 Film thickness
The thickness was determined as the average of 8 measurements for each sample with a hand-held micrometer (Shanghai measuring and cutting tool Factory co, Ltd, China).2.4 Moisture content (MC)
MC of the samples were measured according to the ASTM D 1576-90 procedure recommended for protein (wool) fibers.27 Film samples were weighted (W0) into glass dishes, dried in an air-circulating oven at 105 °C for 24 h and weighted again (Wi). Moisture content for each film was determined in quadruplicate by eqn (1).| MC (%) = [(Wi − W0)/W0] × 100 | (1) |
2.5 Total soluble matter (TSM)
Dry and soluble matters were measured on different films. Four weighted samples of each film were directly immersed in beakers (50 mL) containing 30 mL of distilled water. Traces of sodium azide were also added to inhibit microbial growth. The beakers were covered and stored in an environmental chamber at 25 °C for 24 h with occasional stirring. The insoluble matter was then separated and dried in an oven at 105 °C for 24 h (Wf) to determine the solubilized dry matter by eqn (2). Initial dry matter values needed for TSM calculations were those obtained from MC measurements for a film with the same mass (Wi). The measurements for each type of film were obtained in quadruplicate.| TSM (%) = [(Wi − Wf)/Wf] × 100 | (2) |
2.6 Mechanical properties
Films were conditioned at 25 °C and 50% relative humidity (RH) for 48 h before cut into rectangular specimens of 80 mm × 15 mm dimension. Their mechanical properties were characterized using tensile testing machine. Tensile strength (TS), elongation at break (EB) and Young's modulus (E) were determined according to a computer measurement. A control tensile testing machine (WDW3020, China) was used with an initial grip separation of 100 mm and crosshead speed of 0.5 mm s−1. Four replicates were tested for each sample.2.7 Scanning electron microscope (SEM)
Film samples were dried in an oven at 103 ± 2 °C until a constant weight was obtained. The samples were adhered by double-sided adhesive for 2 cm in diameter of a disc and coated with thin gold layers about 200 Å before observation. The surface morphologies of samples were characterized using a scanning electron microscope (FEI, Quanta 200, Netherlands) with 2000× magnification at an accelerating voltage of 15 kV.2.8 Attenuated total reflectance-Fourier transform infrared (ATR-FTIR) spectroscopy
ATR-FTIR spectra of MSG films were carried out on a Nicolet 6700 FTIR Spectrometer (Thermo Scientific, USA). A total of 32 scans were performed at 4 cm−1 resolution with scan width of 4000–600 cm−1.2.9 Thermal gravimetric analysis (TGA)
Thermal stability of films was measured using Q50 TGA analyzer (TA Instrument, USA). Samples were dried at 40 °C for 24 h and then scanned from 10 °C to 605 °C at the rate of 10 °C min−1, with nitrogen atmosphere (10 mL min−1) to avoid thermo-oxidative reactions.2.10 Differential-scanning calorimeter (DSC)
DSC of MSG films were carried out on DSC TA Q-2000 (TA Instrument, USA). About 4 mg of the film specimen was compressed in the aluminum standard pans and scanned in duplicate at a rate of 10 °C min−1 from −20 °C to 250 °C.2.11 Dynamic mechanical analyzer (DMA)
The dynamic mechanical properties of SPI–gelatin and MSG films were determined using a dynamic mechanical analyzer (Q800, TA Instruments, USA). DMA was performed in a tension mode at a frequency of 1 Hz and amplitude of 15 μm. Analyses were performed on rectangular specimens with dimensions of 20 × 10 × 0.3 mm (length × width × thickness). The samples were heated from 40 to 200 °C at a heating rate of 5 °C min−1. The storage modulus (E′), loss modulus (E′′), and loss tangent (tan![[thin space (1/6-em)]](https://www.rsc.org/images/entities/char_2009.gif) δ = E′′/E′) were recorded as a function of temperature. Glass transition temperature (Tg) was determined as the temperature at which tan
δ = E′′/E′) were recorded as a function of temperature. Glass transition temperature (Tg) was determined as the temperature at which tan![[thin space (1/6-em)]](https://www.rsc.org/images/entities/char_2009.gif) δ attained its peak value.
δ attained its peak value.
2.12 Statistical analysis
Analysis of variance and least significant difference tests were carried out using SPSS PASW Statistics (Version 18, SPSS Inc., Chicago, USA) to determine differences among the means. Tukey's test was applied to detect differences of the means, and p < 0.05 was considered to be statistically significant.3. Results and discussion
3.1 Physical and mechanical properties
The preparation of MSG films using different amount of MCC as reinforcement agent was carried out by casting. The films were flexible and thicknesses from 281 to 293 μm were obtained. As shown in Fig. 1, film color varied from yellow to slightly yellow with the increasing content of MCC.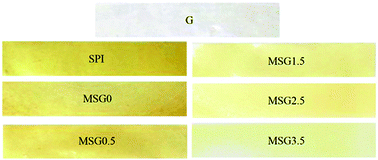 | ||
| Fig. 1 Photographs of the prepared gelatin (G), SPI, and MSG (with 0, 0.5, 1.5, 2.5 and 3.5% MCC content) films. | ||
To evaluate the effect of MCC on MSG films, different film properties such as thickness, MC and TSM were evaluated. Table 2 shows the results. All the films containing SPI have similar thickness, which were thicker than the film made from gelatin or SPI alone, and significantly different from gelatin film. Moreover, due to the porosity of MCC, thickness of MSG films increased with the increasing content of MCC. Film containing both SPI and gelatin exhibited significantly lower water content than that of the film containing SPI or gelatin alone. With different amount of MCC in the composite films, the water content decreased first, and then increased. Film with 1.5% MCC had the lowest MC of 16.41%. This effect is mainly owing to its properties of reversible absorbency. MCC chemically is a poly-hydroxyaldehyde. When the amount of MCC is below a critical value, it presents the hydrophobicity, otherwise it shows the hydrophilicity.28
| Film | Thickness (μm) | MC (%) | TSM (%) | E (MPa) |
|---|---|---|---|---|
| a a,b,c,d Different letters in the same column indicate significant differences (p < 0.05). | ||||
| Gelatin | 193 ± 18.49c | 20.28 ± 9.07a | 60.13 ± 3.51a | 45.32 ± 3.28c |
| SPI | 277 ± 28.12b | 20.89 ± 8.91a | 33.41 ± 1.36bc | 66.11 ±![[thin space (1/6-em)]](https://www.rsc.org/images/entities/char_2009.gif) 5.09bc 5.09bc |
| MSG0 | 271 ± 32.41b | 18.88 ± 9.17b | 36.25 ± 3.77b | 47.52 ± 4.27c |
| MSG0.5 | 281 ± 36.32ab | 16.59 ± 9.79c | 33.08 ± 7.39bc | 61.44 ± 5.44bc |
| MSG1.5 | 284 ± 41.45ab | 16.41 ± 9.93c | 32.97 ± 6.64c | 75.21 ± 5.17b |
| MSG2.5 | 288 ± 40.12ab | 16.81 ± 8.75c | 24.87 ± 7.19d | 107.35 ± 6.13 ab |
| MSG3.5 | 293 ± 45.63a | 17.54 ± 7.66bc | 28.07 ± 5.89cd | 120.03 ± 7.22a |
It was also observed that TSM values of SPI–gelatin composite film was between the value of SPI and gelatin films. MCC content of 1.5% and 2.5% has significantly effect on the total soluble material of MSG film. MSG2.5 films had the lowest TSM of 24.87%, approximately 11.38% decrease with respect to the composite films without MCC. This effect is particularly important. When MCC content reaches to a proper value, this film could be more resistant in the wet state.
Mechanical properties were evaluated by TS, EB and Young's modulus (E) from the stress–strain curves of each film. As observed from Fig. 2, TS values increase significantly with the increase of MCC content. TS values reached to 5.94 MPa when there was 3.5% MCC in the composite film, which was about 3.5 times of that of MSG0. Whereas, EB values reduce to 25.7% at MSG3.5, which was 0.27 times of that of MSG0, making it a less deformable films. To Young's modulus, only MSG0, MSG1.5, and MSG3.5 showed significant differences (Table 2). The increased Young's modulus of film MSG3.5 indicates that the film became stiffer when the content of MCC was 3.5%. From above results, MSG2.5 have TS of 4.34 MPa, EB of 45%, TSM of 24.87%, and E of 107.35 MPa comparing to 1.69 MPa, 95.4%, 36.25% and 47.52 MPa of MSG0 films respectively, inducing a relatively better films with good mechanical properties.
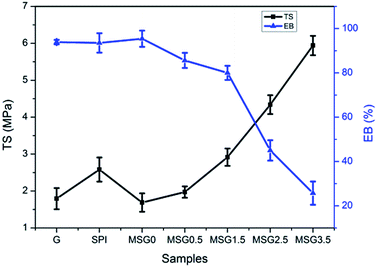 | ||
| Fig. 2 The TS and EB curves of SPI, gelatin (G), and MSG (with 0, 0.5, 1.5, 2.5 and 3.5% MCC content) films. | ||
The high crystallinity of MCC with the presence of unfolded proteins of high-molecular weight, and poly-disperse nature of gelatin results in a film of considerable thickness, with noticeably improvement of tensile strength.23,29 When MCC were introduced at low concentrations (0.5%), gelatin aggregation as well as SPI–gelatin interactions continues to hold sway, leading to indistinctive reinforcement of the composite film. As the content of MCC increased, the consequent formation of hydrogen bond and interpenetrating network between MCC and SPI–gelatin composite enhanced the film's mechanical properties.30 The TS and TSM results indicate that MSG2.5 had the relatively high resistance to water as well as superior mechanical properties.
3.2 Microstructure at the surfaces of films
The SEM photomicrographs of the surfaces of films: (a) SPI films, (b) MSG0, (c) MSG0.5, (d) MSG1.5, (e) MSG2.5, and (f) MSG3.5 were shown in Fig. 3a–f. The surfaces of SPI films (Fig. 3a) were relatively smooth, indicating that SPI has good film-forming ability. With the incorporation of gelatin, the films possessed more even and homogeneous surface as illustrated in Fig. 3b. It indicated the successful interaction between soy protein and gelatin, such as hydrogen bonding or electrostatic interaction. The blending of MCC with SPI–gelatin solution leads to a much better interfacial contact and a fine compatibility (Fig. 3c and d). The presence of 2.5% MCC caused a rough and uneven surface, resulting in a more ductile failure of MSG2.5 films (Fig. 3e). The excessive amount of MCC in MSG3.5 films caused asperities at the surface (Fig. 3f), which may be due to the non-uniform distribution.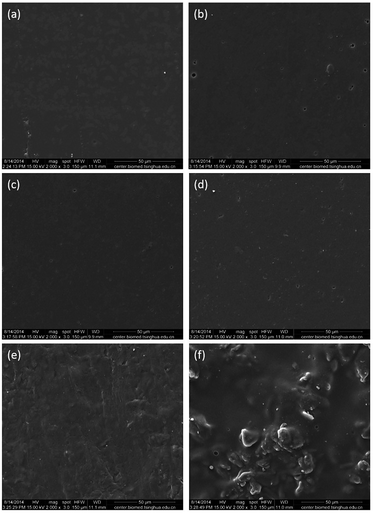 | ||
| Fig. 3 SEM photomicrograph of the fractured surface of the films: (a) SPI films, (b) MSG0, (c) MSG0.5, (d) MSG1.5, (e) MSG2.5, and (f) MSG3.5. | ||
3.3 ATR-FTIR analysis
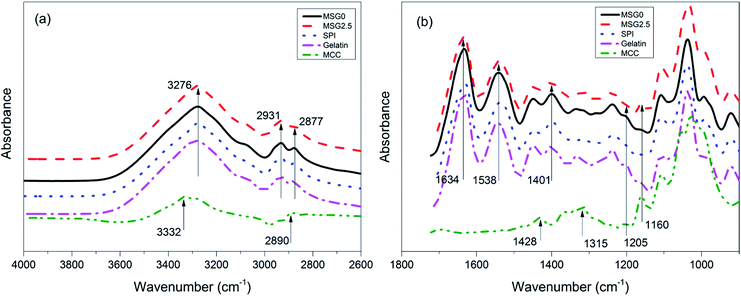
Fig. 4 shows the ATR-FTIR spectra of MCC, gelatin films, SPI films, SPI–gelatin composite films, and the composite film with 2.5% MCC. The gelatin film, SPI film and their corresponding mixture showed similar IR peaks in the range of 4000 to 1300 cm−1. The observed board band in the range of 3500–3000 cm−1 is attributable to O–H stretching and N–H bending, which are able to form hydrogen bonding with the carbonyl group of the peptide linkage in the protein.31 Moreover, the main absorption of SPI film such as C![[double bond, length as m-dash]](https://www.rsc.org/images/entities/char_e001.gif) O stretching at 1634 cm−1 (amide I), N–H bending at 1538 cm−1 (amide II), C–H deformation at 1401 cm−1, and the C–N stretching (amide III) at 1238 cm−1 still exist in the SPI–gelatin composite films.32 Comparing with SPI film, it was observed that peaks of amide I and II in MSG2.5 films showed a slight shift to lower wavenumber. It suggested that the polarity decreased as more hydrogen bonds formed between gelatin, MCC and protein molecules. The characteristic C–H stretching of CH2 and CH3 at 2931 and 2877 cm−1 in SPI–gelatin and MSG2.5 films also varied significantly. These data indicated that inter- and intra-molecular hydrogen bonding has been formed between protein chains and polar groups, and further demonstrated that the protein structure changed from compact to unfolded.
O stretching at 1634 cm−1 (amide I), N–H bending at 1538 cm−1 (amide II), C–H deformation at 1401 cm−1, and the C–N stretching (amide III) at 1238 cm−1 still exist in the SPI–gelatin composite films.32 Comparing with SPI film, it was observed that peaks of amide I and II in MSG2.5 films showed a slight shift to lower wavenumber. It suggested that the polarity decreased as more hydrogen bonds formed between gelatin, MCC and protein molecules. The characteristic C–H stretching of CH2 and CH3 at 2931 and 2877 cm−1 in SPI–gelatin and MSG2.5 films also varied significantly. These data indicated that inter- and intra-molecular hydrogen bonding has been formed between protein chains and polar groups, and further demonstrated that the protein structure changed from compact to unfolded.
The spectra of MCC exhibited a broad absorption band at 3332 cm−1, which corresponded mainly to stretching vibrations of the OH groups from adsorbed water molecules as a result of the great hygroscopicity of this material. The peak at 2890 cm−1 appeared due to C–H stretching. The bands at 1428 and 1315 cm−1 were attributed to the asymmetric CH2 bending and wagging.33 Moreover, the peak at 1205 cm−1 is due to the OH in-plane bending vibration. The sharp peak appearing at 1160 cm−1 in MCC can be attributed to the bending mode of C–CH2–C, which also appeared in the composite films with MCC. There was no new peak produced in MSG2.5 films, indicating that the reinforcement of MCC to the composite films was not caused by chemical reaction. The reinforced properties of MSG2.5 films are attributed to the effects of hydrogen bonds or electrostatic interaction and/or hydrophobic nature from protein–gelatin and protein–MCC molecules.
3.4 Thermo-gravimetric analysis
Thermal gravimetric (TG) and derivative thermal gravimetric (DTG) curves of MCC, gelatin film, SPI films and MSG (with 0, 0.5, 1.5, 2.5, and 3.5% MCC content, respectively) films are illustrated in Fig. 5. Thermal degradation of all MSG films consists of three stages (see Fig. 5a). Weight loss in the first stage (below 150 °C) is assigned to evaporation of residual moisture. The second step (from 250 to 400 °C) is due to the degradation of SPI, and loss of glycerol from the films.34 The final weight loss between 300 °C to 600 °C is due to the decomposition of MCC.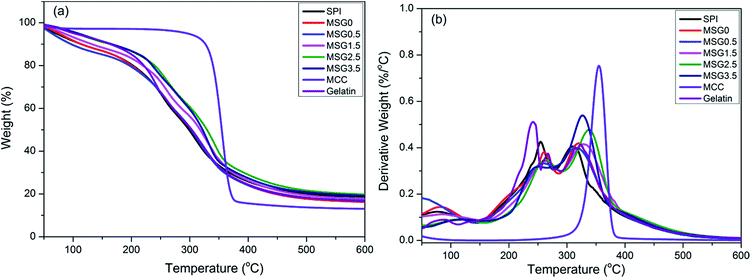 | ||
| Fig. 5 TGA scans of MCC, gelatin, SPI and MSG (with 0, 0.5, 1.5, 2.5, and 3.5% MCC content, respectively) films. | ||
As the DTG thermogram showed in Fig. 5b, the MSG0 films started to degrade at 141.15 °C and end at 369.40 °C. The MSG0.5 films degraded at 183.11 °C and ended at 382.69 °C. The MSG3.5 films degraded at 189.59 °C and ended at 369.61 °C. The whole time of degradation process not only delayed, but also decreased with the increase of MCC content. Moreover the percentage weight loss dropped faster corresponding to the growth of MCC content. TGA indicate that the thermal stability of the MSG films improved with the addition of MCC.
3.5 Differential-scanning calorimetry test
DSC thermograms of MCC, gelatin, SPI and MSG films are shown in Fig. 6. The glass transition temperature (Tg) of different MSG samples was used to analyze the effect of MCC on the thermal properties of films. In Fig. 6, the endothermic peaks of MCC, gelatin and SPI films were located at temperature of 74.91, 77.33 and 84.52 °C, respectively, while the Tg of MSG0.5, MSG1.5, MSG2.5 and MSG3.5 were 117.94, 118.72, 120.93 and 116.11 °C, respectively. In the thermograms of gelatin modified SPI film, two endothermic peak at 66.39 °C and 85.26 °C can be observed, which corresponded to the denaturation of the 7S (β-conglycinin) and 11S (glycinin) globulins of SPI, respectively. These denaturation temperatures shifted to higher values after adding MCC to the SPI–gelatin films. Above results also indicated that the Tg of SPI–gelatin film was lower than all MSG samples. Because the MSG films reconstruct the original SPI and gelatin structures during forming film process, and the stronger hydrogen bonding effect in MSG3.5 results in an improved dispersion of protein chains. MSG3.5 film showed the lowest Tg in all MSG samples.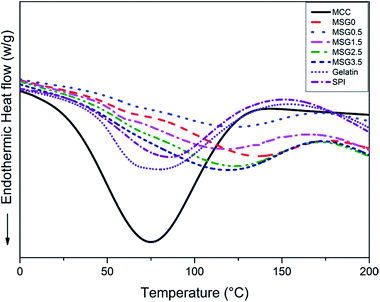 | ||
| Fig. 6 DSC thermograms of MCC, SPI, gelatin, MSG (with 0, 0.5, 1.5, 2.5, and 3.5% MCC content, respectively) films. | ||
When different polymers are mixed, they will interact with each other, either by combing together or by separating apart, called associative (synergistic) or segregative (antagonistic) effects, respectively. Structural incompatibilities films can occur when disrupted matrix apparently act as inactive filler. In addition, synergistic effect in composite films can also occur when either of the two components is structurally compatible with each other or one component acts as active filler, such as MCC. When low concentration of MCC (0.5%) was added, the MCC dispersed the soybean protein concentrate matrix, which maintained its integrity. Increasing the MCC mass percentage to 1.5% resulted in hydrogen bond between the soybean protein concentrate network which still appeared to be in a continuous phase in the matrix. When the MCC mass percentage was increased further, the MCC disperse in the soybean protein isolate, forming network with SPI–gelatin composite. Further increasing the MCC content more than 2.5% resulted in the formation of a new phase which keeping the main endothermic peaks of the initial composite without the former endothermic peak at 66.39 °C. The shape of the melting peak also depended on the moisture content in the sample.35 The moisture content of these DSC samples was shown in Table 2. These DSC results further demonstrated that SPI–gelatin and MCC are merged during heating.
3.6 Dynamic mechanical analyzer test
DMA measures the viscoelastic properties of the polymers with changing temperature. Thermal transitions are generally associated with chain mobility. The most important transition is the glass transition, which is related to the onset of main chain motions.36 Fig. 7 shows changes in storage modulus and tan delta values of SPI–gelatin and MSG films as a function of temperature. The Tg value has been determined as the temperature versus the maximal tan delta values. Over the entire temperature range, storage modulus of the MSG0 films was the lowest among all that of other films (Fig. 7a). After 70 °C, storage modulus of MSG films has been improved obviously by increasing the content of MCC. The improvement of rigidity suggests that MCC has a strong reinforcement effect on SPI–gelatin films. The increase in storage modulus is also in agreement with the results of tensile testing where Young's modulus increased with increasing MCC content. It further confirmed that hydrogen bond was formed between MCC and SPI–gelatin composite, which enhanced the film's mechanical properties.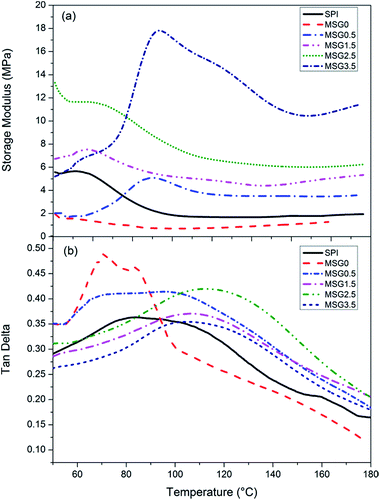 | ||
| Fig. 7 DMA thermograms storage modulus (a) and tan delta (b) of SPI and MSG (with 0, 0.5, 1.5, 2.5, and 3.5% MCC content, respectively) films. | ||
Effects of temperature on tan delta showed a significant increase in Tg value (Fig. 7b). SPI films had a tan delta peak value of 85.3 ± 1.7 °C. The tan delta peak value increased as MCC content increase to 2.5% and then decreases with further increase in MCC content to 3.5%. This is attributed to reduced mobility of biopolymer chains of SPI in the SPI–gelatin matrix. The magnitude of tan delta peak is an indication of the motion of polymer chains in amorphous phase.37 The broad peak with reduced magnitude at higher MCC contents can be attributed to the restricted motion of biopolymer chains of SPI due to the existence of excessive MCC. This is consistent with the lowest EB of MSG3.5.
3.7 Relationship between the dispersion state and reinforcement effect of MCC
There are abundant carboxyl groups and amino groups in SPI and gelatin protein. These oxygen and nitrogen containing groups could interact with the hydroxyl groups and oxygen atoms in MCC chain by hydrogen bonds, which is beneficial to homogeneously dispersion of MCC chains. The dispersion state of MCC in SPI and gelatin is depicted in Fig. 8.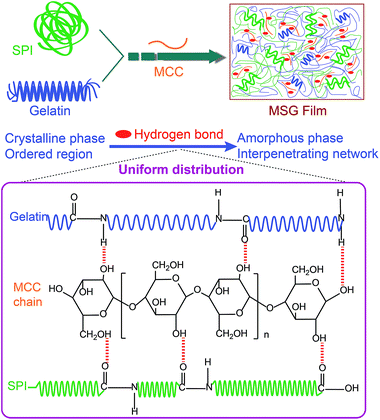 | ||
| Fig. 8 Schematic illustrations of the relationship between the dispersion state and reinforcement effect of MCC in MSG film. | ||
Based on SEM, FTIR and DMA measurements, the dispersion states of MCC in SPI varied with MCC content. Considering from the protein structure, gelatin has a fibrous tertiary structure then forms a triple helical, cross-linked quaternary structure, thus can form a soft, flexible and elastic gel.38 On the other hand, SPI is a complex mixture of proteins with widely different molecular properties. Most soy proteins are globulins. Thus SPI is a less organized matrix. In the gelling and film forming process, gelatin can re-nature and, re-acquire part of the triple helix structure of the collagen, which is a protein with a high degree of organization. With 0.5% MCC, MCC chains are considered to align parallel to the surface of regenerated composite film and are homogeneously distributed in SPI–gelatin matrix without intercontacts. With increasing of MCC content, the effect of hydrogen bond between MCC, gelatin and SPI increased. The crystalline phase or the ordered region of gelatin and SPI, changed to amorphous phase or more disordered region easily, and thus producing the well uniform distribution and better interpenetrating network in MSG films. When MCC content was between 2.5% and 3.5%, the uniform dispersion and a certain degree of alignment of MCC chains in the SPI–gelatin matrix occurred. The well-organized aggregation of SPI–gelatin matrix with MCC chains, together with the strong interpenetrating between SPI and gelatin matrix significantly enhance the mechanical properties of the regenerated MSG films.
4. Conclusions
In summary, MCC-reinforced SPI–gelatin composite films were successfully prepared. The influence of MCC content to composite films properties was studied, and TS, EB, SEM, ATR-FTIR, MC and TSM of MSG films were investigated. 2.5% content of MCC in SPI films could significantly improve the properties of the films, particularly their mechanical properties and water resistance. Furthermore, thermal properties characterized by TGA, DSC and DMA showed that the thermal stability of MSG films was improved. The intra-molecular hydrogen bonds between SPI, MCC and gelatin were formed, and these interactions led to improved integration of MCC and gelatin into the protein matrix, which were supported by FTIR and SEM analysis. Above all, the preparation of biodegradable MSG films provides a convenient and promising way for environmental friendly film material.Acknowledgements
This work was supported by Beijing Natural Science Foundation (no. 2151003) and China Postdoctoral Science Foundation (no. 2014M560052).Notes and references
- A. Sorrentino, G. Gorrasi and V. Vittoria, Trends Food Sci. Technol., 2007, 18, 84–95 CrossRef CAS PubMed.
- J. W. Rhim, H. M. Park and C. S. Ha, Prog. Polym. Sci., 2013, 38, 1629–1652 CrossRef CAS PubMed.
- C. Vaneeckhaute, E. Meers, E. Michels, J. Buysse and F. Tack, Biomass Bioenergy, 2013, 49, 239–248 CrossRef PubMed.
- J. Bero, V. Hannaert, G. Chataigné, M. F. Hérent and J. J. Quetin-Leclercq, Ethnopharmacol, 2011, 137, 998–1002 CrossRef PubMed.
- N. H. Silva, C. Vilela, I. M. Marrucho, C. S. Freire, C. P. Neto and A. J. Silvestre, J. Mater. Chem. B, 2014, 2, 3715–3740 RSC.
- I. Siró and D. Plackett, Cellulose, 2010, 17, 459–494 CrossRef.
- N. Reddy and Y. Yang, in Innovative biofibers from renewable resources, Springer-Verlag, Berlin Heidelberg, 2015, pp. 441–443 Search PubMed.
- V. K. Thakur, M. K. Thakur, P. Raghavan and M. R. Kessler, ACS Sustainable Chem. Eng., 2014, 2, 1072–1092 CrossRef CAS.
- R. Kumar, V. Choudhary, S. Mishra, I. Varma and B. Mattiason, Ind. Crops Prod., 2002, 16, 155–172 CrossRef CAS.
- J. Chen, X. Chen, Q. Zhu, F. Chen, X. Zhao and Q. Ao, J. Sci. Food Agric., 2013, 93, 1687–1691 CrossRef CAS PubMed.
- F. M. Monedero, M. J. Fabra, P. Talens and A. Chiralt, J. Food Eng., 2010, 97, 228–234 CrossRef CAS PubMed.
- P. Guerrero, P. Stefani, R. Ruseckaite and K. De la Caba, J. Food Eng., 2011, 105, 65–72 CrossRef CAS PubMed.
- Y. Zhao, Y. Zhao, H. Xu and Y. Yang, Environ. Sci. Technol., 2015, 49, 2391–2397 CrossRef CAS PubMed.
- R. R. Koshy, S. K. Mary, S. Thomas and L. A. Pothan, Food Hydrocolloids, 2015, 50, 174–192 CrossRef CAS PubMed.
- G. A. Denavi, M. Pérez-Mateos, M. C. Añón, P. Montero, A. N. Mauri and M. C. Gómez-Guillén, Food Hydrocolloids, 2009, 23, 2094–2101 CrossRef CAS PubMed.
- L. Song, J. Zhi, P. Zhang, Q. Zhao, N. Li, M. Qiao and J. Liu, J. Food Sci. Technol., 2014, 1–7 Search PubMed.
- J. S. Won, T. S. Lee, H. S. Kim, H. G. Son, T. M. Hong, H. W. Lee and S. G. Lee, J. Biobased Mater. Bioenergy, 2014, 8, 221–229 CrossRef CAS PubMed.
- P. Kaewprachu and S. Rawdkuen, Food Biosci., 2014, 2, 15–30 Search PubMed.
- R. J. Moon, A. Martini, J. Nairn, J. Simonsen and J. Youngblood, Chem. Soc. Rev., 2011, 40, 3941–3994 RSC.
- S. Levis and P. Deasy, Int. J. Pharm. Compd., 2001, 230, 25–33 CrossRef CAS.
- J. K. Pandey, H. Takagi, A. N. Nakagaito and H.-J. Kim, Handbook of polymer nanocomposites. Processing, performance and application: volume C: polymer nanocomposites of cellulose nanoparticles, Springer, 2014 Search PubMed.
- M. Ghaderi, M. Mousavi, H. Yousefi and M. Labbafi, Carbohydr. Polym., 2014, 104, 59–65 CrossRef CAS PubMed.
- M. O. Reis, J. Zanela, J. Olivato, P. S. Garcia, F. Yamashita and M. V. E. Grossmann, J. Polym. Environ., 2014, 22, 545–552 CrossRef CAS.
- K. Wilpiszewska and Z. Czech, Starch, 2014, 66, 660–667 CrossRef CAS PubMed.
- C. Bilbao-Sainz, R. J. A. B. D. F. Wood, T. G. Williams and T. H. McHugh, J. Agric. Food Chem., 2010, 58, 3753–3760 CrossRef CAS PubMed.
- Z. Wang, X. X. Sun, Z. X. Lian, X. X. Wang, J. Zhou and Z. S. Ma, J. Food Eng., 2013, 114, 183–191 CrossRef CAS PubMed.
- P. Lodha and A. N. Netravali, Ind. Crops Prod., 2005, 21, 49–64 CrossRef CAS PubMed.
- C. Miao and W. Y. Hamad, Cellulose, 2013, 20, 2221–2262 CrossRef CAS PubMed.
- K. Das, N. R. Bandyopadhyay, D. Ray, D. Mitra, S. Sengupta, S. P. Sengupta, A. K. Mohanty and M. Misra, J. Biobased Mater. Bioenergy, 2009, 3, 100–107 CrossRef CAS PubMed.
- N. Dogan and T. H. Mchugh, J. Food Sci., 2007, 72, 16–22 CrossRef PubMed.
- I. Yakimets, N. Wellner, A. C. Smith, R. H. Wilson, I. Farhat and J. Mitchell, Polymer, 2005, 46, 12577–12585 CrossRef CAS PubMed.
- T. Kurose, K. Urman, J. U. Otaigbe, R. Y. Lochhead and S. F. Thames, Polym. Eng. Sci., 2007, 47, 374–380 CAS.
- J. A. Lee, M. J. Yoon, E. S. Lee, D. Y. Lim and K. Y. Kim, Macromol. Res., 2014, 22, 738–745 CrossRef CAS.
- P. Kumar, K. Sandeep, S. Alavi, V. D. Truong and R. Gorga, J. Food Eng., 2010, 100, 480–489 CrossRef CAS PubMed.
- M. S. Rahman, G. Al-Saidi, N. Guizani and A. Abdullah, Thermochim. Acta, 2010, 509, 111–119 CrossRef CAS PubMed.
- A. Polyamide, Macromol. Mater. Eng., 2013, 298, 131–134 CrossRef PubMed.
- Z. Z. Yu, C. Yan, M. Yang and Y. W. Mai, Polym. Int., 2004, 53, 1093–1098 CrossRef CAS PubMed.
- K. V. Simon-Lukasik and R. D. Ludescher, Food Hydrocolloids, 2004, 18, 621–630 CrossRef CAS PubMed.
Footnote |
| † These authors contributed equally. |
| This journal is © The Royal Society of Chemistry 2015 |

