Nitrogen-doped porous carbon spheres derived from D-glucose as highly-efficient CO2 sorbents
Leqiong Xua,
Liping Guoa,
Gengshen Hub,
Jinghan Chena,
Xin Hu*a,
Sunli Wangc,
Wei Daia and
Maohong Fan*d
aCollege of Chemistry and Life Sciences, Zhejiang Normal University, Jinhua 321004, PR China. E-mail: huxin@zjnu.cn; Tel: +86-151-0579-0257
bZhejiang Key Laboratory for Reactive Chemistry on Solid Surfaces, Institute of Physical Chemistry, Zhejiang Normal University, Jinhua 321004, PR China
cFupait Environment Technology (Suzhou) Co., LTD, Suzhou, Jiangsu 215400, PR China
dDepartment of Chemical and Petroleum Engineering, University of Wyoming, Laramie, Wyoming 82071, USA. E-mail: mfan@uwyo.edu; Tel: +1-307-766-5633
First published on 15th April 2015
Abstract
Carbon spheres were synthesized from D-glucose under hydrothermal conditions. Highly porous N-doped carbon was obtained after the as-synthesized carbon spheres were subjected to urea modification and KOH activation. The resulting sorbent possessed a highly developed narrow microporosity and large amounts of nitrogen-containing groups in the framework, which were confirmed by various characterization techniques such as nitrogen adsorption, X-ray photoelectron diffraction and element analysis, etc. As a result, this sorbent exhibits a high CO2 adsorption capacity under atmospheric pressure of 4.37 and 6.68 mmol g−1 at 25 °C and 0 °C, respectively. In addition to its high CO2 adsorption capacity, the sorbent also had a high CO2/N2 selectivity of 35, indicating its potential in flue gas separation.
Introduction
Today's growing concerns regarding global warming and environmental pollution have spurred research interest in CO2 capture technologies.1 Currently, the commercial process for post-combustion capture is amine scrubbing.2 However, this technology suffers from excess energy consumption, equipment corrosion, solvent loss and toxicity. To overcome these problems, solid sorbents that adsorb CO2 under ambient conditions (25 °C, 1 bar) have been investigated.3–11 Among the various sorbents, carbonaceous materials are especially attractive due to advantages such as their inexpensive and easy preparation, high thermal and chemical stability, tunable pore structure, and ease of regeneration, not to mention their relative lack of sensitivity to water vapor compared to other CO2-philic materials.1,12 Previous studies have pointed out the importance of narrow micropores (<1 nm) on the CO2 adsorption capacities of porous carbons under ambient conditions (25 °C, 1 bar).1,13–15 Additionally, the incorporation of nitrogen-containing groups into carbon has been proposed as an effective way to enhance the interaction between CO2 molecules and the surfaces of sorbents,16–19 which may further improve CO2 adsorption capacity and CO2/N2 selectivity. Bearing in mind the above two factors, in this work we synthesized carbon spheres from D-glucose under hydrothermal conditions, which were then subjected to urea modification and KOH activation. The diameter of the as-synthesized carbon spheres was in the range of 200–300 nm and the spherical morphology was preserved after post-activation. After urea and KOH modification, the carbon spheres possess high microporosity and large amounts of basic nitrogen-containing groups, which consequently leads to high CO2 adsorption capacity under ambient conditions (i.e. 4.37 mmol g−1 and 6.68 mmol g−1 at 25 °C and 0 °C under 1 bar, respectively).Experimental section
The carbon spheres were synthesized by a hydrothermal method, as described previously.20 In a typical preparation, a solution containing 10 g D-glucose (analytical purity, Sinopharm Chemical Reagent Co., Ltd.) and 100 mL water was put into a 150 mL stainless steel autoclave with Teflon liner and maintained at 180 °C for 8 h. The collected precipitate was washed four times with water and once with ethanol by centrifugation, then oven-dried overnight at 80 °C. The as-synthesized carbon spheres (CS) were mixed with urea (analytical purity, Sinopharm Chemical Reagent Co., Ltd.) at a weight ratio of 1![[thin space (1/6-em)]](https://www.rsc.org/images/entities/char_2009.gif) :
:![[thin space (1/6-em)]](https://www.rsc.org/images/entities/char_2009.gif) 1 and then oxidized with oxygen in air at 350 °C for 2 h, followed by washing with hot water to remove the unreacted urea and dried overnight at 120 °C. The urea-modified sample was further activated by KOH (analytical purity, Sinopharm Chemical Reagent Co., Ltd.) at 650 °C with a KOH/precursor ratio of 2, with the final product denoted as NCS-650-2. The preparation procedure is illustrated in Scheme 1. For comparison, CS was directly activated by KOH activation at 650 °C and a KOH/precursor ratio of 2, which is denoted as CS-650-2.
1 and then oxidized with oxygen in air at 350 °C for 2 h, followed by washing with hot water to remove the unreacted urea and dried overnight at 120 °C. The urea-modified sample was further activated by KOH (analytical purity, Sinopharm Chemical Reagent Co., Ltd.) at 650 °C with a KOH/precursor ratio of 2, with the final product denoted as NCS-650-2. The preparation procedure is illustrated in Scheme 1. For comparison, CS was directly activated by KOH activation at 650 °C and a KOH/precursor ratio of 2, which is denoted as CS-650-2.
Scanning electron microscopy (SEM) images were obtained by field emission scanning electron microscopy (FE-SEM, Hitachi S-4800). Transmission electron microscopy (TEM) was carried out using a JEOL-2100F transmission electron microscope operated at 200 kV. Powdered X-ray diffraction (XRD) patterns were performed on a PHILIPS PW3040/60 powder diffractometer using Cu Kα radiation (λ = 0.15406 nm). Fourier transform infrared (FT-IR) spectra were collected on a Nicolet 670 Fourier spectrophotometer, using the KBr pellet technique. Elemental analysis (C, H and N) was performed on a dry basis using a VarioEL III Elemental Analyzer. Nitrogen adsorption and desorption isotherms were measured on a Beishide 3H-2000PS2 sorption analyzer at liquid nitrogen temperature. The specific surface area (SBET) was calculated according to the multipoint Brunauer–Emmett–Teller (BET) method at relative pressure P/P0 = 0.01–0.1. The total micropore volume (V0) was deduced by the t-plot method, and the total pore volume (Vt) was estimated from the adsorbed amount of liquid nitrogen at a relative pressure of 0.99. The micropore and mesopore size distributions were calculated using the Harvath–Kawazoe (H–K) and Barrett–Joyner–Halenda (BJH) methods, respectively. Comparing the N2 sorption, the adsorption isotherms of CO2 at 0 °C can assess narrow microporosity (size < 1 nm), where N2 adsorption at −196 °C can be kinetically restricted. The pore volume corresponding to the narrow microporosity (Vn) was obtained by applying the Dubinin–Radushkevich (D–R) equation to the CO2 adsorption data at 0 °C. X-ray photoelectron (XPS) measurements were performed using an AXIS Nova spectrometer (Kratos Inc., NY, USA) equipped with a monochromatic Al Kα X-ray source (1486.6 eV). XPS survey spectra were recorded with a pass energy of 160 eV, and high-resolution spectra with a pass energy of 40 eV. The CO2 adsorption isotherms were measured using the Beishide 3H-2000PS2 sorption analyzer at 0 °C and 25 °C, respectively.
Results and discussion
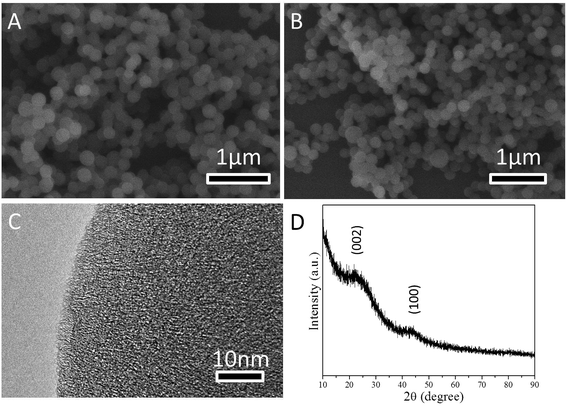
SEM and TEM were used to examine the morphology of CS and NCS-650-2. Fig. 1a shows the SEM image of CS, which has a spherical morphology with an average diameter of ca. 200 nm. After urea and KOH modification, NCS-650-2 still preserved the spherical morphology, as shown in the SEM image of Fig. 1b. On close observation, the HR-TEM image of NCS-650-2 (Fig. 1c) shows the amorphous and worm-like pore structures. The wide-angle X-ray diffraction (XRD) pattern of NCS-650-2 (Fig. 1d) further confirms its amorphous nature. Two weak and broad diffraction peaks at around 23° and 43° were observed for this sample, which correspond to the (002) and (100) diffraction patterns of amorphous graphitic carbon. This finding suggests that NCS-650-2 has poor crystallinity, which is in good agreement with the TEM observation (Fig. 1c). | ||
| Fig. 1 SEM images of (a) CS and (b) NCS-650-2, HR-TEM image of (c) NCS-650-2, and XRD pattern of (d) NCS-650-2. | ||
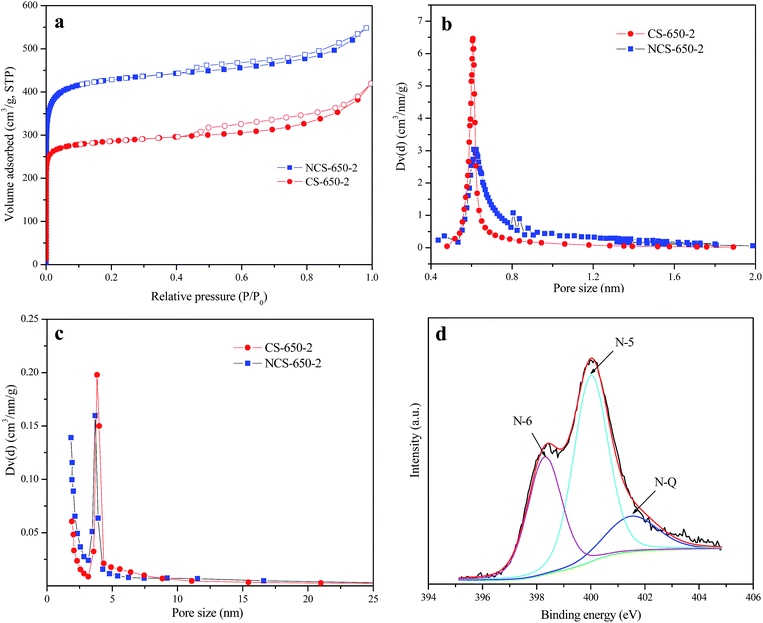
Fig. 2a shows nitrogen adsorption/desorption isotherms of NCS-650-2 and CS-650-2 at −196 °C, in which a type I + type IV isotherm was observed for both samples. The high amount of adsorbed nitrogen at low relative pressure indicates that these materials have large amounts of micropores, while the presence of hysteresis at P/P0 between 0.4 and 1 reveals that mesopores also exist in these materials. The presence of multiple-length-scale porosity (meso-, and micropores) of both samples can be further confirmed by the pore size distribution (PSD) curves shown in Fig. 2b and c, in which micropore and mesopore PSD are centered at ca. 0.6 nm and 3.8 nm, respectively. The porous textures for as-synthesized CS and modified carbon spheres are listed in Table 1, together with their CO2 adsorption capacities at 0 and 25 °C and 1 bar. From the results, CS shows very limited pore volume and surface area, while the modified carbon spheres show much higher porosities, of which NCS-650-2 shows a higher value than CS-650-2 in each porous texture characteristic. The volumes of narrow micropores (Vn) for CS, NCS-650-2 and CS-650-2 calculated from the CO2 adsorption data at 0 °C are 0.13, 0.55 and 0.77 cm3 g−1, respectively. These results indicate that urea and KOH modification of CS can produce sorbents with highly developed porosity, especially narrow microporosity.
| Sample | SBETa (m2 g−1) | V0b (cm3 g−1) | Vtc (cm3 g−1) | Vnd (cm3 g−1) | CO2 uptake (mmol g−1) | |
|---|---|---|---|---|---|---|
| 25 °C | 0 °C | |||||
| a Surface area was calculated using the BET method at P/P0 = 0.01–0.1.b Total pore volume at P/P0 = 0.99.c Evaluated by the t-plot method.d Obtained by applying the Dubinin–Radushkevich (D–R) equation to the CO2 adsorption data at 0 °C. | ||||||
| CS | 20 | 0.05 | — | 0.13 | 0.64 | 0.96 |
| CS-650-2 | 1176 | 0.65 | 0.41 | 0.55 | 4.06 | 5.89 |
| NCS-650-2 | 1692 | 0.85 | 0.61 | 0.77 | 4.37 | 6.68 |
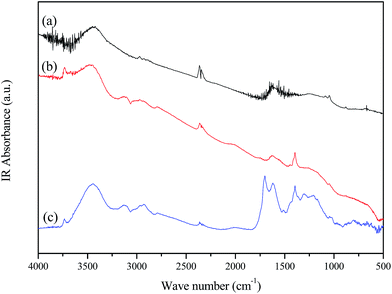
Elemental analysis results show that NCS-650-2 has a nitrogen content of 2.74%, which is due to urea modification. The presence of nitrogen-containing groups in the prepared sorbent was further confirmed by FT-IR spectroscopy. Fig. 3 shows the FTIR spectra of CS, CS-650-2 and NCS-650-2. The FTIR spectrum of NCS-650-2 shows characteristic bands at 3445, 1623, and 1051 cm−1. The bands at 3445 cm−1 can be caused by N–H and/or –OH stretching vibration.16,21 The band at 1623 cm−1 can be attributed to N–H in-plane deformation vibrations,22 while the band at 1051 cm−1 correspond to the C–N stretching vibrations.23,24 The nature of the nitrogen moieties on NCS-650-2 can be analyzed by XPS, as shown in Fig. 2d. The XPS N1s spectra were deconvoluted into three peaks with binding energies centered at 398.3, 400.1 and 401.5 eV, which can be attributed to pyridinic-N (N-6), pyrrolic/pyridonic-N (N-5) and quaternary-N (N-Q), respectively.21,25,26 Quantitative analysis reveals that the amount of N-5 is higher than those present in the form of N-6 and N-Q, which may be beneficial to CO2 capture, as it has been documented that N-5 generally has a much greater contribution to CO2 capture than pyridinic nitrogen or quaternary nitrogen.25,27
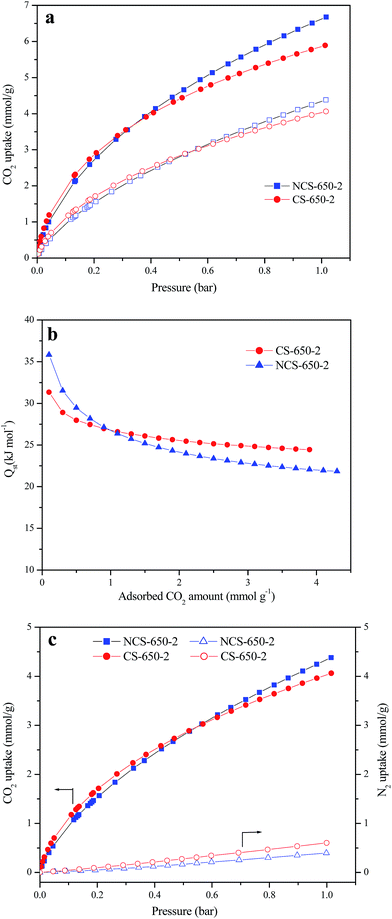
CO2 adsorption on CS, NCS-650-2 and CS-650-2 was investigated at 25 °C and 0 °C under atmospheric pressure (1 bar); the corresponding CO2 adsorption isotherms for NCS-650-2 and CS-650-2 are presented in Fig. 4a. CS shows very small CO2 adsorption capacities of 0.64 and 0.96 mmol g−1 at 25 °C and 0 °C, respectively, which is due to its less-developed porosity. By contrast, after KOH activation, CS-650-2 shows much higher CO2 adsorption capacities of 4.06 and 5.88 mmol g−1 at 25 °C and 0 °C, respectively. The CO2 adsorption capacities were further increased to 4.37 and 6.68 mmol g−1 in NCS-650-2 after the CS was subjected to urea modification and KOH activation. This adsorption capacity is one of the highest values reported for carbonaceous materials14,28,29 and higher than many microporous materials such as MOF,30 COF31 and PAF.32 For example, Xing et al. prepared N-doped activated carbons from bean dreg, which possess CO2 uptake capacity of 4.24 mmol g−1 at 25 °C and 1 atm.28 Sevilla et al. synthesized N-doped activated carbons from algae and glucose with a CO2 adsorption capacity of 4.4 mmol g−1 at 25 °C and 1 atm.29 In another work, they synthesized porous carbons from biomass resource (sawdust) and achieved the maximum CO2 uptake of 4.8 mmol g−1 at 25 °C and 1 atm.14 Some MOFs (such as MOF-210 (ref. 30) and IRMOF-1 (ref. 33)) and COFs31 developed by Yaghi et al. showed less than 2.5 mmol g−1 at 25 °C and 1 bar. Furthermore, a series of PAFs developed by Qiu's group showed 1.1–1.8 mmol g−1 at 25 °C and atmospheric pressure. The high adsorption capacity of NCS-650-2 can be attributed to its highly developed narrow microporosity and nitrogen-containing framework.
The isosteric heat of adsorption (Qst) for NCS-650-2 and CS-650-2 was calculated from the CO2 sorption isotherms measured at 25 °C and 0 °C using the Clausius–Clapeyron equation.34,35 Fig. 4b shows the curves of Qst vs. CO2 adsorption capacity, in which Qst decreases with increased CO2 loading, and the initial Qst values for NCS-650-2 and CS-650-2 are 35 and 31 kJ mol−1, respectively. That Qst decreases with increased CO2 loading indicates the heterogeneous binding energies of CO2 in the pores, and higher initial Qst value of NCS-650-2 compared to CS-650-2 may be due to the strong adsorbent–adsorbate interaction between the N-containing carbon framework and CO2 molecules. It should be noted that at higher CO2 coverage, CS-650-2 shows a higher Qst than NCS-650-2, which indicates that micropores play a dominant role at this stage, since the former has smaller micropores and narrower micropore PSD than the latter (Fig. 2b).
Fig. 4c shows the CO2 and N2 isotherms of NCS-650-2 and CS-650-2 at 25 °C. CO2/N2 selectivity of both samples was calculated using Henry's law through the initial slopes of CO2 and N2 adsorption isotherms. Based on the initial slopes of N2 and CO2 adsorption isotherms, the estimated CO2/N2 selectivity of NCS-650-2 is 35, which is comparable to or better than those obtained with reported nitrogen-doped carbons.36–39 The ideal adsorption solution theory40 (IAST) was also used to evaluate the selectivity for CO2/N2 of NCS-650-2 and CS-650-2, which is based on the pure gas adsorption isotherms with overall pressure of 1 bar and N2 molar fraction of 0.9. The corresponding values for these two samples are 25 and 18, respectively. These results indicate that nitrogen doping is beneficial for the enhancement of CO2/N2 selectivity, and thus a good candidate for flue gas separation.
Conclusions
Carbon spheres synthesized from D-glucose under hydrothermal conditions were subjected to urea modification and KOH activation to obtain a highly porous nitrogen-doped carbonaceous CO2 sorbent. The spherical morphology was still preserved after post-treatment. The resulting nitrogen-doped carbon exhibits high CO2 uptake capacities at atmospheric pressure of 4.37 mmol g−1 at 25 °C and 6.68 mmol g−1 at 0 °C, respectively. This high capacity of CO2 adsorption is due to the presence of narrow micropores (<1 nm) and basic nitrogen-containing groups in the framework of the sorbent. Furthermore, this sample exhibits a good CO2/N2 selectivity of 35, which shows significant potential for flue gas separation.Acknowledgements
Financial support from the NSF of China (21106136), Zhejiang Provincial Natural Science Foundation (LY15B060004), Zhejiang Provincial Xinmiao Project (no. 2014R404019), and Zhejiang Qianjiang Talent Project (no. QJD1302015), as well as collaboration with the University of Wyoming, are greatly appreciated.References
- X. Hu, M. Radosz, K. A. Cychosz and M. Thommes, Environ. Sci. Technol., 2011, 45, 7068–7074 CrossRef CAS PubMed.
- G. T. Rochelle, Science, 2009, 325, 1652–1654 CrossRef CAS PubMed.
- Q. Wang, J. Luo, Z. Zhong and A. Borgna, Energy Environ. Sci., 2011, 4, 42–55 CAS.
- L. Ma, R. Bai, G. Hu, R. Chen, X. Hu, W. Dai, H. F. M. Dacosta and M. Fan, Energy Fuels, 2013, 27, 5433–5439 CAS.
- X. Zhao, X. Hu, G. Hu, R. Bai, W. Dai, M. Fan and M. Luo, J. Mater. Chem. A, 2013, 1, 6208–6215 CAS.
- X. X. Feng, G. S. Hu, X. Hu, G. Q. Xie, Y. L. Xie, J. Q. Lu and M. F. Luo, Ind. Eng. Chem. Res., 2013, 52, 4221–4228 CrossRef CAS.
- K. Sumida, D. L. Rogow, J. A. Mason, T. M. McDonald, E. D. Bloch, Z. R. Herm, T. H. Bae and J. R. Long, Chem. Rev., 2012, 112, 724–781 CrossRef CAS PubMed.
- W. Q. Cai, L. J. Tan, J. G. Yu, M. Jaroniec, X. Q. Liu, B. Cheng and F. Verpoort, Chem. Eng. J., 2014, 239, 207–215 CrossRef CAS PubMed.
- S. Makhseed and J. Samuel, J. Mater. Chem. A, 2013, 1, 13004–13010 CAS.
- F. Akhtar, Q. Liu, N. Hedin and L. Bergstrom, Energy Environ. Sci., 2012, 5, 7664–7673 CAS.
- H. Ma, H. Ren, X. Zou, F. Sun, Z. Yan, K. Cai, D. Wang and G. Zhu, J. Mater. Chem. A, 2013, 1, 752–758 CAS.
- N. P. Wickramaratne and M. Jaroniec, ACS Appl. Mater. Interfaces, 2013, 5, 1849–1855 CAS.
- V. Presser, J. McDonough, S. H. Yeon and Y. Gogotsi, Energy Environ. Sci., 2011, 4, 3059–3066 CAS.
- M. Sevilla and A. B. Fuertes, Energy Environ. Sci., 2011, 4, 1765–1771 CAS.
- N. P. Wickramaratne and M. Jaroniec, J. Mater. Chem. A, 2013, 1, 112–116 CAS.
- G. P. Hao, W. C. Li, D. Qian and A. H. Lu, Adv. Mater., 2010, 22, 853–857 CrossRef CAS PubMed.
- Y. Zhao, X. Liu, K. X. Yao, L. Zhao and Y. Han, Chem. Mater., 2012, 24, 4725–4734 CrossRef CAS.
- R. Bai, M. Yang, G. Hu, L. Xu, X. Hu, Z. Li, S. Wang, W. Dai and M. Fan, Carbon, 2015, 81, 465–473 CrossRef CAS PubMed.
- S. Wu, Y. Liu, G. Yu, J. Guan, C. Pan, Y. Du, X. Xiong and Z. Wang, Macromolecules, 2014, 47, 2875–2882 CrossRef CAS.
- X. Sun and Y. Li, Angew. Chem., Int. Ed., 2004, 43, 597–601 CrossRef PubMed.
- J. Yu, M. Guo, F. Muhammad, A. Wang, F. Zhang, Q. Li and G. Zhu, Carbon, 2014, 69, 502–514 CrossRef CAS PubMed.
- W. Shen, S. Zhang, Y. He, J. Li and W. Fan, J. Mater. Chem., 2011, 21, 14036–14040 RSC.
- N. Liu, L. Yin, C. Wang, L. Zhang, N. Lun, D. Xiang, Y. Qi and R. Gao, Carbon, 2010, 48, 3579–3591 CrossRef CAS PubMed.
- L. Liu, Q. F. Deng, T.-Y. Ma, X. Z. Lin, X. X. Hou, Y. P. Liu and Z. Y. Yuan, J. Mater. Chem., 2011, 21, 16001–16009 RSC.
- M. Sevilla, P. Valle-Vigón and A. B. Fuertes, Adv. Funct. Mater., 2011, 21, 2781–2787 CrossRef CAS PubMed.
- M. Sevilla, J. B. Parra and A. B. Fuertes, ACS Appl. Mater. Interfaces, 2013, 5, 6360–6368 CAS.
- J. R. Pels, F. Kapteijn, J. A. Moulijn, Q. Zhu and K. M. Thomas, Carbon, 1995, 33, 1641–1653 CrossRef CAS.
- W. Xing, C. Liu, Z. Zhou, L. Zhang, J. Zhou, S. Zhuo, Z. Yan, H. Gao, G. Wang and S. Z. Qiao, Energy Environ. Sci., 2012, 5, 7323–7327 CAS.
- M. Sevilla, C. Falco, M.-M. Titirici and A. B. Fuertes, RSC Adv., 2012, 2, 12792–12797 RSC.
- H. Furukawa, N. Ko, Y. B. Go, N. Aratani, S. B. Choi, E. Choi, A. O. Yazaydin, R. Q. Snurr, M. O'Keeffe, J. Kim and O. M. Yaghi, Science, 2010, 329, 424–428 CrossRef CAS PubMed.
- H. Furukawa and O. M. Yaghi, J. Am. Chem. Soc., 2009, 131, 8875–8883 CrossRef CAS PubMed.
- T. Ben, C. Pei, D. Zhang, J. Xu, F. Deng, X. Jing and S. Qiu, Energy Environ. Sci., 2011, 4, 3991–3999 CAS.
- A. R. Millward and O. M. Yaghi, J. Am. Chem. Soc., 2005, 127, 17998–17999 CrossRef CAS PubMed.
- S. S. Kaye and J. R. Long, J. Am. Chem. Soc., 2005, 127, 6506–6507 CrossRef CAS PubMed.
- X. Hu, B. O. Skadtchenko, M. Trudeau and D. M. Antonelli, J. Am. Chem. Soc., 2006, 128, 11740–11741 CrossRef CAS PubMed.
- J. Wang, A. Heerwig, M. R. Lohe, M. Oschatz, L. Borchardt and S. Kaskel, J. Mater. Chem., 2012, 22, 13911–13913 RSC.
- X. Ma, Y. Li, M. Cao and C. Hu, J. Mater. Chem. A, 2014, 2, 4819–4826 CAS.
- G. P. Hao, W. C. Li, D. Qian, G. H. Wang, W. P. Zhang, T. Zhang, A. Q. Wang, F. Schuth, H. J. Bongard and A. H. Lu, J. Am. Chem. Soc., 2011, 133, 11378–11388 CrossRef CAS PubMed.
- M. Zhong, S. Natesakhawat, J. P. Baltrus, D. Luebke, H. Nulwala, K. Matyjaszewski and T. Kowalewski, Chem. Commun., 2012, 48, 11516–11518 RSC.
- A. L. Myers and J. M. Prausnitz, AIChE J., 1965, 11, 121–127 CrossRef CAS PubMed.
| This journal is © The Royal Society of Chemistry 2015 |


