Microwave-assisted synthesis of La–Cr co-doped SrTiO3 nano-particles and their use in photocatalytic hydrogen evolution under visible light†
Fanpeng Caia,
Yadong Mengb,
Bo Hub,
Yubing Tanga and
Weidong Shi*b
aSchool of Biology and Chemical Engineering, Jiangsu University of Science and Technology, Zhenjiang, 212003, P. R. China
bSchool of Chemistry and Chemical Engineering, Jiangsu University, Zhenjiang, 212013, P. R. China. E-mail: swd1978@ujs.edu.cn
First published on 17th June 2015
Abstract
The increasing need for efficient materials capable of solar fuel generation is primary to the development of a green energy economy. In this contribution, we demonstrate that La–Cr co-doped SrTiO3 (STO) nano-particles obtained through a one-pot microwave-assisted method exhibit visible light absorption. We fine-tune the content from cation substitution in the structure of the STO to develop high-efficiency visible-light-driven water splitting photocatalysts considering the discrete impurity levels created by dopants. In our study, we draw the conclusion from the experiments that the photocatalytic hydrogen production performance was optimum when the doping molar amount of La–Cr was 5%. Rational explanations for the high-performance of the photocatalysts of La–Cr co-doped STO materials are described.
1 Introduction
Hydrogen production by solar-driven photocatalytic water splitting on the surface of semiconductors is a promising strategy to transform solar energy into hydrogen fuel.1–7 Sunlight driven water splitting is considered to be a viable method to produce hydrogen energy on account of water and sunlight being naturally abundant on Earth. Since the photocatalytic splitting of water into H2 and O2 on the surface of a semiconductor was first reported, much attention had been paid to semiconductor materials which could be used as photocatalysts.8–12 Amongst all the semiconductors, STO has been regarded as one of the most promising photocatalysts for water splitting because of its strong catalytic activity, high chemical and photochemical stability.13,14 However, STO shows activity only under ultraviolet irradiation, accounting for merely about 4% of the incoming solar energy, which limits its practical application.15 To overcome this defect, numerous studies have focused on extending the photocatalytic activity of STO toward the visible-light region.Among them, doping using transition metals is a good strategy to develop visible light responsive photocatalysts if a suitable dopant is chosen.16–19 The replacement of cations in the crystal lattice of STO may create impurity energy levels within the band gap of the photocatalyst that facilitate absorption in the visible range. However, it was reported that the impurity levels created by dopants in the photocatalysts are usually discrete, which would appear disadvantageous for the migration of photogenerated holes.20 Therefore, we have reason to believe that it is important to fine-tune both the content and depth of the cation substitution in the structure of STO to develop visible-light-driven water-splitting photocatalysts. Although there has been extensive research on doped STO photocatalysts,21–26 little attention has been paid to the effects of the doped content of La and Cr.
In recent years, microwave-assisted synthesis has been used to develop facile synthetic methods for inorganic nano-scale materials in consideration of the shorter reaction times and higher reaction rates as compared to conventional heating methods.27–29 As a result, microwave heating has opened the possibility of realizing fast chemical reactions and rapid material preparation in very short time periods, usually in minutes, instead of the hours or even days usually required by the conventional heating methods, leading to a relatively low cost, energy savings, and high efficiency for material production. Additionally, the shorter crystallization time often leads to a small particle size of the product, which is essential for the synthesis of inorganic nano-scale materials. Thus, microwave-assisted synthesis is a promising synthetic method to obtain inorganic nano-scale materials.
There are some reports on La–Cr co-doped STO in previous research, such as Ye et al. reported that the reaction environment plays a significant role in the surface properties and thus affects the photocatalytic efficiency of La–Cr co-doped STO.30 However, the hydrothermal method in their work consumed 72 hours for preparation of the sample, which is neither efficient nor time-saving. Up to date, there was no research on fine-tuning the content of the La–Cr substitution in the structure of STO to develop efficient visible-light-driven water-splitting photocatalysts. What is more, we for the first time synthesize La–Cr co-doped STO using a microwave-assisted method that is able to heat the target materials without heating the entire furnace or oil bath, which saves time and energy. In this manuscript, La–Cr co-doped STO was prepared using a microwave-assisted method successfully. In our work, we fine-tune the content of La–Cr cation substitution in the structure of STO to develop efficient visible-light-driven water-splitting photocatalysts. For comparison, La doped STO and Cr doped STO were prepared using the same method, respectively. The photocatalytic activities of the as-obtained La–Cr co-doped STO samples were evaluated in a Lab-H2 photocatalytic hydrogen production system.
2 Experimental section
2.1. Synthesis of the La–Cr co-doped SrTiO3 nano-particles
La–Cr co-doped SrTiO3 nanoparticles were prepared using a facile microwave-assisted method. In a typical synthesis procedure, Sr(OH)2·8H2O (3.5 mmol), TiO2 (3.5 mmol) and KOH (0.0375 mol) were dissolved in 35 mL of purified water. After stirring for about 30 min, a certain amount of La(NO)3·6H2O and Cr(NO)3·9H2O were dispersed into the solution under vigorous stirring. Then the as-obtained mixture was transferred into a Teflon-lined autoclave of 50.0 mL capacity. The obtained mixture was heated in a microwave reactor (MDS-6, Shanghai Sineo Microwave Chemistry Technology Co., Ltd.) with the operating power of 800 W and working temperature of 150 °C for 5 h. After the container cooled to room temperature, the product mixture was washed with deionized water by repeated centrifugation, and the resulting product was dried at 60 °C in air. Pure STO nanoparticles were prepared using the same method without the extra reagents of La(NO)3·6H2O and Cr(NO)3·9H2O introduced to the STO precursor liquid. The obtained samples with (La–Cr)/Sr molar ratios of 0, 1%, 2%, 4%, 5%, 6% and 8% were labeled as pure STO, La–Cr-1, La–Cr-2, La–Cr-4, La–Cr-5, La–Cr-6 and La–Cr-8. For comparison, obtained samples with La/Sr and Cr/Sr molar ratios of 5% were named as La-5 and Cr-5, respectively.2.2. Characterization
Powder X-ray diffraction (XRD) patterns were obtained on a D/MAX-2500 diffractometer (Rigaku, Japan) using a Cu Kα radiation source (λ = 1.54056 Å) at a scan rate of 7° min−1 to determine the crystal phase of the obtained samples. UV-vis absorption spectra of the samples were measured using a UV-vis spectrometer (Shimadzu UV-2500). X-ray photoelectron spectroscopy (XPS) data were obtained using an ESCALa-b220i-XL electron spectrometer (VGScientific, England) using 300 W Al Kα radiation. Transmission electron microscopy (TEM), high-resolution transmission electron microscopy (HRTEM) and HAADF-STEM mapping analyses were conducted on an F20 S-TWIN electron microscope (Tecnai G2, FEI Co.), using a 200 kV accelerating voltage. The photoluminescence spectra were obtained using a F4500 (Hitachi, Japan) photoluminescence detector.2.3. Photocatalytic hydrogen production
The photocatalytic hydrogen production experiments were carried out in a Lab-H2 photocatalytic hydrogen production system.31 A 300 W xenon arc lamp was used as the light source and was positioned 20 cm away from the reactor in the system. In a typical water-splitting over doped STO experiment, 100 mg of the prepared doped STO photocatalyst was dispersed with constant stirring in 200 mL of 20 vol% methanol in aqueous solution. Prior to irradiation, the system was placed under vacuum to remove the dissolved oxygen. During the whole reaction process, vigorous agitation was performed to ensure uniform irradiation of the photocatalysts suspension. A certain amount of H2PtCl6·6H2O aqueous solution was dripped into the system to load 0.5 wt% Pt onto the surface of the photocatalyst by a photochemical reduction deposition method. The generated gas was collected intermittently through the septum, and the hydrogen content was analyzed using a gas chromatograph (GC-SP7800, Beijing Jing Ke Ruida, China, TCD, nitrogen as the carrier gas and a 5 Å molecular sieve column). All glassware was rigorously cleaned and carefully rinsed with distilled water prior to use.3 Results and discussion
The crystal structures of the materials were investigated with powder X-ray diffraction (Fig. 1). The XRD experiment confirmed that all samples are pure single phase. Fig. 1 shows the XRD patterns of the pure STO and doped STO powder samples at room temperature, which reveal that both the pure and doped materials possess a homogeneous crystal structure of cubic perovskite symmetry (JCPDS card no. 05-0634). In our work, the La and Cr substitute the Sr and Ti, respectively (Q-JACS), and the radius of Cr and La is 0.615 Å and 1.032 Å, while the radius of Ti and Sr is 0.605 Å and 1.180 Å, respectively.25,30 Obviously, the radius of Ti is similar to Cr, and the radius of Sr is similar to La. As a result, the peak positions of the La-STO, Cr-STO and La–Cr-STO samples show almost an identical crystal structure to that of STO (Fig. 1a and b), which also indicates that doping with La and Cr, and La–Cr co-doping did not introduce any possible impurities.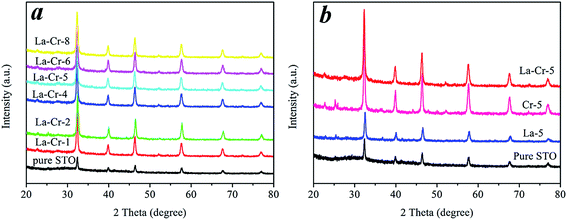 | ||
| Fig. 1 (a) XRD patterns of pure STO and different La–Cr doping amount samples. (b) XRD patterns of La–Cr-5, Cr-5, La-5 and pure STO. | ||
The products in this work are cubic phase, and the lattice constant “a” of the pure STO, Cr-5 and La–Cr-5 is 3.908, 3.911 and 3.910, respectively. As we can see, the lattice constant “a” of Cr-5 is bigger than that of pure STO, this is because the radius of Cr is 0.615 Å, which is bigger than that of Ti (0.605 Å). As a result, this is reasonable after Cr replaces Ti. On the other hand, the radius of La is 1.032 Å, which is smaller than that of Sr (1.180 Å), which makes the lattice constant “a” of La–Cr-5 shorter than that of Cr-5, and larger than that of pure STO.
Fig. 2 displays typical transmission electron microscopy (TEM) and high-resolution TEM (HRTEM) images of the La–Cr-5 sample. As shown in Fig. 2a, it can be clearly observed that a great amount of the sample was dispersed as cubic particles with average diameters of 60 nm for La–Cr-5. As shown in the SAED pattern (insert in Fig. 2a) taken from the nanoparticles in Fig. 2a, it was revealed that the La–Cr-5 nanoparticles had a single-crystalline structure. Furthermore, the SAED pattern shows a cubic array of sharp spots, and can be indexed as cubic phase, which is consistent with the XRD and TEM results. From the HRTEM image in Fig. 2b, the lattice fringes can be clearly observed, suggesting a well-defined crystal structure, and the fringe with a lattice spacing of ca. 0.39 nm corresponds to the (100) plane of the cubic STO. Furthermore, HRTEM images provide further evidence for the cubic structure of the La–Cr-5.
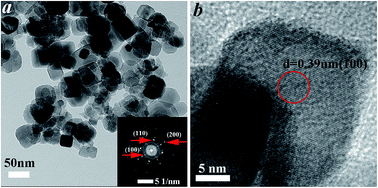 | ||
| Fig. 2 TEM image, SAED pattern and HRTEM image of the La–Cr-5 sample. (a) TEM image of the La–Cr-5 sample, the insert is the SAED pattern of the La–Cr-5 sample. (b) HRTEM image of the La–Cr-5 sample. | ||
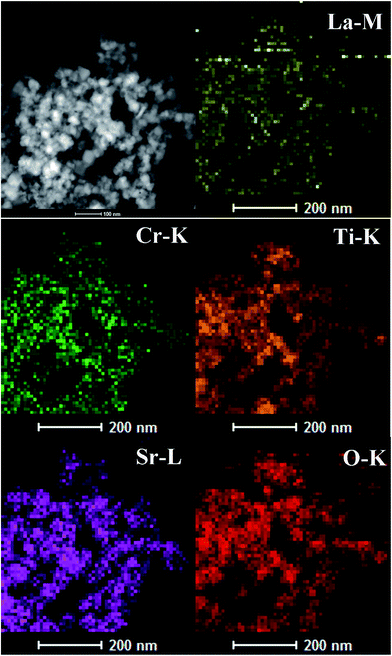
The structure of the La–Cr-STO inner space is further characterized using scanning transmission electron microscopy (STEM), a very powerful characterization technique for determining the elemental distribution in a material. As can be seen in Fig. 3, all of the signals for La (yellow), Cr (green), Sr (purple), O (red), and Ti (orange) are very uniform in the observation area, indicating homogeneous distribution of Sr, O, Ti, La, and Cr in the composite. The above phenomena indicate the successful co-doping of La–Cr into the STO crystal lattice and further confirm the formation of the La–Cr–Sr–Ti–O chemical bonds during the present microwave-assisted hydrothermal process. By the way, the doping amount of Cr-5 and La–Cr-5 have been determined using EDS and the results are shown in Fig. S1 and S2.†
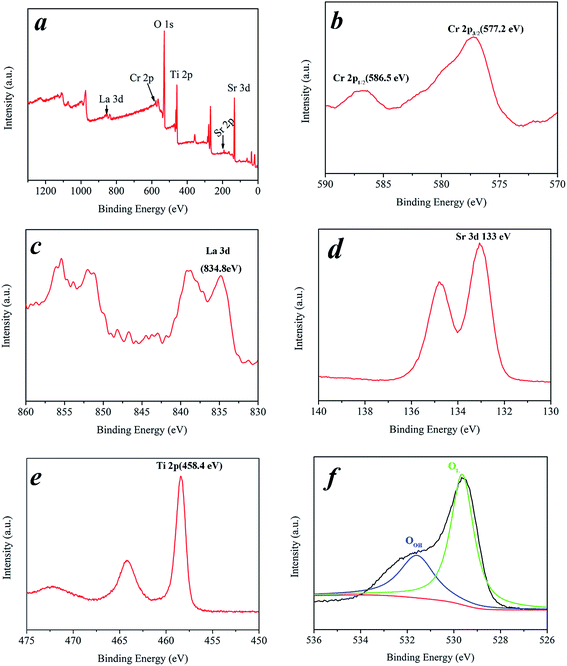
As shown in Fig. 4b, the core level spectrum of the Cr 2p region shows two main peaks for Cr 2p1/2 and Cr 2p3/2 centered at ca. 586.1 eV and 577.2 eV, respectively, which are close to the literature values and assigned to the Cr3+ state.32 Experiments on the La-doped sample revealed the La core level 3d peaks depicted in Fig. 4c. The peaks are situated at 834.8 eV which correspond to the La3+ state.33 Shown in Fig. 4d are the binding energies of the Sr 3d, with a binding energy of ca. 133 eV which corresponds to that of the Sr2+. The XPS of the Ti (Fig. 4e) exhibited two different signals of Ti 2p3/2 and Ti 2p1/2 at 458.4 eV and 464.2 eV, respectively.34 The different atomic species present at the surface are indicated as OL = TiO2 lattice oxygen and OOH = oxygen from OH species. The O 1s peaks of the present samples show a regular pattern (Fig. 4f) and show two components, corresponding to oxygen in the oxide lattice (OL with binding energies of ca. 529.5 eV), and to surface hydroxyl groups (OOH with binding energies of ca. 531.7 eV), and the peaks at 531.7 and 529.5 eV are ascribed to the O 1s of H2O and doped SrTiO3, respectively.35–39
Introducing impurity levels or bands into the band gap of UV-active oxide semiconductors by the incorporation of transition metals is considered to be an effective method of sensitizing materials to the visible-light region for photocatalytic water-splitting. As shown in Fig. 5a, the optical absorptions of La–Cr co-doped STO exhibit a strong enhancement in the visible-light and ultraviolet regions. Furthermore, the UV-vis absorption spectra of these doped materials suggest that the optical absorption properties increased with the increment of the doping amount. The band gaps were calculated according to the ultraviolet-visible absorption spectra as displayed in Fig. 5b, and all the doped materials showed narrower band gaps (∼2.80 eV) than that of pure STO (3.20 eV). The shrinkages in the band gaps of the doped materials, which shift the valence band to a more negative position and may thus facilitate hydrogen evolution, are due to the optical absorption properties increment. The insert picture in Fig. 5 shows that the color of the samples changes with the doped amount. Obviously, all the samples exhibit a yellow color, and an increased doped amount is accompanied with deeper color. When the location of the VB top-edge is more negative, the oxidation potential will become worse and worse accompanied with the performance of water-splitting in methanol solution becoming low. This reasoning would be verified in the experiments for photocatalytic hydrogen production in the next section.
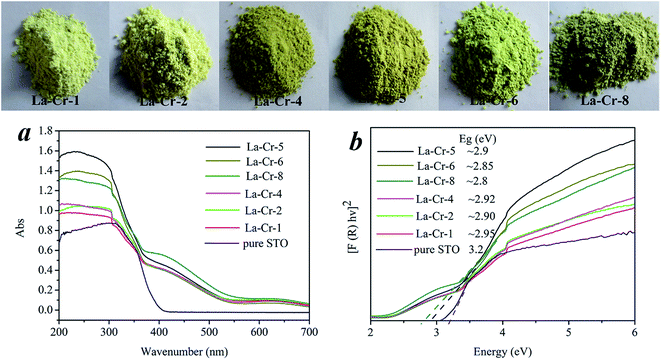 | ||
| Fig. 5 (a) UV-vis absorption spectra of all doped samples, (b) optical band gaps. The insert picture shows the color of all the samples. | ||
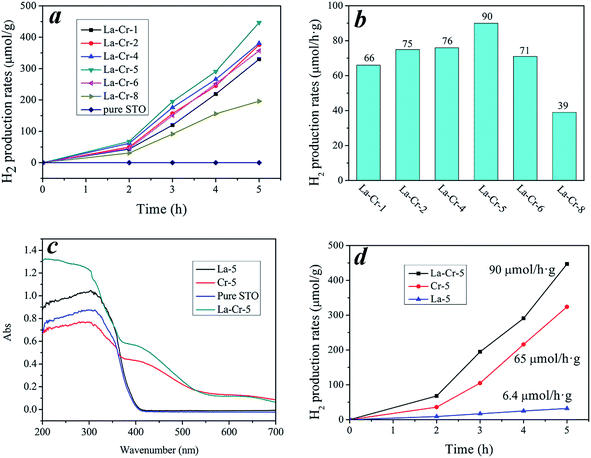
Photocatalytic H2 evolution experiments were carried out with the doped STO photocatalysts (loaded with 0.5 wt% Pt cocatalyst) suspended in CH3OH solution. Fig. 6a shows the typical reaction time course of the photocatalytic H2 evolution for different doping amounts. Obviously, doped STO shows an excellent photocatalytic H2 evolution performance under visible-light irradiation, but the pure STO has no activity. Initially, increasing the La–Cr doping amount resulted in a progressive increase of the photocatalytic hydrogen evolution rate under visible-light irradiation, however, additional increasing of the La–Cr content to 6% (Fig. 6b) resulted in a decrease of the photocatalytic hydrogen evolution rate. It can be seen that La–Cr-5 showed the best ability for photocatalytic H2 production, and the photocatalytic H2 production rate was about 90 μmol g−1 h−1 as shown in Fig. 6b. Therefore, a suitable content of La–Cr is crucial for optimizing the photocatalytic activity of La–Cr-STO photocatalysts.
Fig. 6c shows the UV-vis absorption spectra of La–Cr-5, La-5, Cr-5 and pure STO. By comparison, the UV-vis absorption data can accurately reveal how the element doping has affected the response in the optical absorption region. In detail, the Cr doped STO shows a strong enhancement of the optical absorption in the visible-light region being accompanied by a weakening of the light absorption in the ultraviolet region. The La doped STO exhibits weak enhancement of the optical absorption both in the visible-light and ultraviolet region. As for the La–Cr co-doped STO, a strong enhancement in both the visible-light and ultraviolet region was observed. Therefore, we can conclude that the doped transition metal ions play an important role in the absorption bands observed in the visible-light region for STO co-doped with La and the transition metal Cr. Shown in Fig. 6d is a comparison of the visible-light photocatalytic activity of the samples La–Cr-5, La-5 and Cr-5 for H2 production. Obviously, the La–Cr-5 possesses the best photocatalytic activity, the photocatalytic hydrogen production rate of La-5 is very low, and that of Cr-5 is much higher than that of La-5 but is still lower than that of La–Cr-5. The improvement of the activity for La–Cr-STO could be attributed to fewer defects and a lower recombination rate of electrons and holes. The explanation for this phenomenon will be discussed in the next section on the photoluminescence spectra.
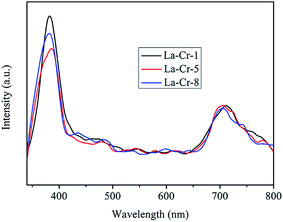 | ||
| Fig. 7 The photoluminescence spectra of all samples (10 mg was well dispersed in 5 mL of ethanol) with an excitation wavelength of 320 nm. | ||
As can be seen in Fig. 7, in a comparison of La–Cr-1, La–Cr-5 and La–Cr-8, the intensity of the PL signal for La–Cr-5 is much lower. This indicates that La–Cr-5 has a lower recombination rate of electrons and holes under visible-light irradiation, which may be due to the fact that the impurity levels created by the dopants in the photocatalysts are usually discrete, when the doping amount is too high this would appear to be disadvantageous for the migration of the photogenerated holes. Owing to the fewer defects in La–Cr-5, and that the overpotential is larger, this also results in the best separation of charge and consequently causes the best migration of charge carriers to the active sites. The trend of the proton concentration and the trend of polymerization for the sample set are in very good agreement with the corresponding activity, which contributes to charge transport. For comparison, the photoluminescence spectra of Cr-5 and Cr–La-5 are shown in Fig. S3, and discussion is also provided in the ESI.†
4 Conclusions
In summary, La–Cr co-doped STO was prepared using a microwave-assisted method successfully for the first time. The advantages of this approach are low cost, energy savings, and high efficiency. In this work, we fine-tune the content of La–Cr cation substitution in the structure of STO to develop efficient visible-light-driven water-splitting photocatalysts. The photocatalytic activity is improved upon the La–Cr/Sr molar ratio changing from 1% to 5%, and is decreased when the La–Cr/Sr molar ratio is changed from 5% to 8%. In this paper, we give a scientific explanation for the relationship between doping amount and photocatalytic activity.Acknowledgements
We gratefully acknowledge the financial support of the National Natural Science Foundation of China (21407067, 21276116, 21477050, 21301076 and 21303074), Excellent Youth Foundation of Jiangsu Nature Scientific Committee (BK20140011), Program for high-level innovative and entrepreneurial talents in Jiangsu Province, Program for New Century Excellent Talents in University (NCET-13-0835), Henry Fok Education Foundation (141068) and Six Talents Peak Project in Jiangsu Province (XCL-025).References
- K. Iwashina, A. Iwase, Y. H. Ng, R. Amal and A. Kudo, J. Am. Chem. Soc., 2015, 137, 604–607 CrossRef CAS PubMed.
- Q. Li, B. Guo, J. Yu, J. Ran, B. Zhang, H. Yan and J. R. Gong, J. Am. Chem. Soc., 2011, 133, 10878–10884 CrossRef CAS PubMed.
- D. J. Martin, P. J. Reardon, S. J. Moniz and J. Tang, J. Am. Chem. Soc., 2014, 136, 12568–12571 CrossRef CAS PubMed.
- X. Wang, S. Blechert and M. Antonietti, ACS Catal., 2012, 2, 1596–1606 CrossRef CAS.
- X. Wang, K. Maeda, A. Thomas, K. Takanabe, G. Xin, J. M. Carlsson, K. Domen and M. Antonietti, Nat. Mater., 2009, 8, 76–80 CrossRef CAS PubMed.
- Q. Xiang, J. Yu and M. Jaroniec, J. Am. Chem. Soc., 2012, 134, 6575–6578 CrossRef CAS PubMed.
- C. Xu, W. Yang, Q. Guo, D. Dai, M. Chen and X. Yang, J. Am. Chem. Soc., 2013, 135, 10206–10209 CrossRef CAS PubMed.
- B. Pant, H. R. Pant, N. A. M. Barakat, M. Park, T.-H. Han, B. H. Lim and H.-Y. Kim, Ceram. Int., 2014, 40, 1553–1559 CrossRef CAS PubMed.
- M. Yang, S. Hu, F. Li, Z. Fan, F. Wang, D. Liu and J. Gui, Ceram. Int., 2014, 40, 11963–11969 CrossRef CAS PubMed.
- T. Zhou, Y. Xu, H. Xu, H. Wang, Z. Da, S. Huang, H. Ji and H. Li, Ceram. Int., 2014, 40, 9293–9301 CrossRef CAS PubMed.
- A. Kudo and Y. Miseki, Chem. Soc. Rev., 2009, 38, 253–278 RSC.
- R. M. Navarro Yerga, M. C. Alvarez Galvan, F. del Valle, J. A. Villoria de la Mano and J. L. Fierro, ChemSusChem, 2009, 2, 471–485 CrossRef CAS PubMed.
- Q. Kuang and S. Yang, ACS Appl. Mater. Interfaces, 2013, 5, 3683–3690 CAS.
- Y. Sasaki, A. Iwase, H. Kato and A. Kudo, J. Catal., 2008, 259, 133–137 CrossRef CAS PubMed.
- Y. Liu, L. Xie, Y. Li, R. Yang, J. Qu, Y. Li and X. Li, J. Power Sources, 2008, 183, 701–707 CrossRef CAS PubMed.
- K. Iwashina and A. Kudo, J. Am. Chem. Soc., 2011, 133, 13272–13275 CrossRef CAS PubMed.
- J. Xu, Y. Wei, Y. Huang, J. Wang, X. Zheng, Z. Sun, L. Fan and J. Wu, Ceram. Int., 2014, 40, 10583–10591 CrossRef CAS PubMed.
- F. Yi, H. Li, H. Chen, R. Zhao and X. Jiang, Ceram. Int., 2013, 39, 347–352 CrossRef CAS PubMed.
- F. Zou, Z. Jiang, X. Qin, Y. Zhao, L. Jiang, J. Zhi, T. Xiao and P. P. Edwards, Chem. Commun., 2012, 48, 8514–8516 RSC.
- G. J. D. a. P. H. M. d. K. G. Blasse, Mater. Res. Bull., 1981, 16, 991–998 CrossRef CAS.
- T. Ishii, H. Kato and A. Kudo, J. Photochem. Photobiol.,A, 2004, 163, 181–186 CrossRef CAS.
- W. Wei, Y. Dai, M. Guo, L. Yu and B. Huang, J. Phys. Chem. C, 2009, 113, 15046–15050 CAS.
- Y. Jia, S. Shen, D. Wang, X. Wang, J. Shi, F. Zhang, H. Han and C. Li, J. Mater. Chem. A, 2013, 1, 7905 CAS.
- S. Shen, Y. Jia, F. Fan, Z. Feng and C. Li, Chin. J. Catal., 2013, 34, 2036–2040 CrossRef CAS.
- J. Wang, T. Fang, S. Yan, Z. Li, T. Yu and Z. Zou, Comput. Mater. Sci., 2013, 79, 87–94 CrossRef CAS PubMed.
- P. Reunchan, S. Ouyang, N. Umezawa, H. Xu, Y. Zhang and J. Ye, J. Mater. Chem. A, 2013, 1, 4221 CAS.
- J. Sungpanich, T. Thongtem and S. Thongtem, Ceram. Int., 2012, 38, 1051–1055 CrossRef CAS PubMed.
- M. B. Suwarnkar, R. S. Dhabbe, A. N. Kadam and K. M. Garadkar, Ceram. Int., 2014, 40, 5489–5496 CrossRef CAS PubMed.
- Y. J. Zhu and F. Chen, Chem. Rev., 2014, 114, 6462–6555 CrossRef CAS PubMed.
- S. Ouyang, H. Tong, N. Umezawa, J. Cao, P. Li, Y. Bi, Y. Zhang and J. Ye, J. Am. Chem. Soc., 2012, 134, 1974–1977 CrossRef CAS PubMed.
- F. Cai, Y. Tang, H. Shen, C. Wang, A. Ren, L. Xiao, W. Gu and W. Shi, CrystEngComm, 2015, 17, 1086–1091 RSC.
- H. Kato and A. Kudo, J. Phys. Chem. B, 2002, 106, 5029–5034 CrossRef CAS.
- M. S. J. Marshall, D. T. Newell, D. J. Payne, R. G. Egdell and M. R. Castell, Phys. Rev. B: Condens. Matter Mater. Phys., 2011, 83 Search PubMed.
- R. E. Tanner, Y. Liang and E. I. Altman, Surf. Sci., 2002, 506, 251–271 CrossRef CAS.
- S. Ardizzone, C. L. Bianchi, G. Cappelletti, S. Gialanella, C. Pirola and V. Ragaini, J. Phys. Chem. C, 2007, 111, 13222–13231 CAS.
- G. Cappelletti, S. Ardizzone, C. L. Bianchi, S. Gialanella, A. Naldoni, C. Pirola and V. Ragaini, Nanoscale Res. Lett., 2008, 4, 97–105 CrossRef PubMed.
- J. Chen, S. Shen, P. Guo, M. Wang, P. Wu, X. Wang and L. Guo, Appl. Catal., B, 2014, 152–153, 335–341 CrossRef CAS PubMed.
- K. Li, B. Chai, T. Peng, J. Mao and L. Zan, ACS Catal., 2013, 3, 170–177 CrossRef CAS.
- Z. Li, P. Zhang, T. Shao, J. Wang, L. Jin and X. Li, J. Hazard. Mater., 2013, 260, 40–46 CrossRef CAS PubMed.
Footnote |
| † Electronic supplementary information (ESI) available. See DOI: 10.1039/c5ra04659a |
| This journal is © The Royal Society of Chemistry 2015 |

