DOI:
10.1039/C5RA04940G
(Paper)
RSC Adv., 2015,
5, 35155-35165
New insight into the promotion effect of Cu doped V2O5/WO3–TiO2 for low temperature NH3-SCR performance†
Received
20th March 2015
, Accepted 7th April 2015
First published on 7th April 2015
Abstract
The promotion effect of Cu on the V/WTi catalyst for the selective catalytic reduction of NOx by NH3 was investigated in the temperature range of 150–400 °C. The Cu addition shows a superior NH3-SCR performance in comparison with the V/WTi sample. The catalysts were characterized by XRD, Raman, EPR, H2-TPR, XPS, and in situ DRIFTS techniques. The obtained results reveal that the Cu oxides in close proximity to V oxides on the surface facilitate the formation of double redox couples of V5+/V4+ and Cu2+/Cu+, which may play a critical role in the superior NH3-SCR performance. The electronic interactions caused by the redox cycle of Cu2+ + V4+ ↔ V5+ + Cu+ could significantly improve the redox properties of the vanadium species, which is beneficial for the activation of NH3 species bound to the vanadium species. Moreover, the redox cycle of Cu2+ + V4+ ↔ V5+ + Cu+ induces the formation of high-activity nitrate species adsorbed on Cu species. The kinetic analysis reveals that the Cu doping induces the decrease of the activation energy (Ea) of NH3-SCR.
1. Introduction
Nitrogen oxides (NOx), are among the most dangerous air pollutants that cause acid rain and photochemical smog, as well as directly do harm to human health.1 The selective reduction of NOx by NH3 is one of the most efficient NOx emission control technologies.2 V2O5–WO3/TiO2 has been a well-known NH3-SCR catalyst and shows optimum performance only within a narrow temperature window of 300–400 °C.3 Under the conditions of low-load operation, the temperature of exhaust gas cannot reach the lowest operation temperature, causing the SCR denitrification system not to operate. This phenomenon could account for the lower flue gas temperature leading to NH4HSO4 deposited on the catalyst surface,4 resulting in the blockage of catalyst pore channels and catalyst deactivation. These problems need to be settled currently for most coal power plant. Hence, it is urgent to develop a novel NH3-SCR catalyst with excellent NOx conversion at low temperature to avoid the problems associated with the existing commercial system, especially for the coal power plant.5–7
In the past decades, many researchers have been dedicated to improve the low-temperature activity of V2O5-based NH3-SCR catalysts. Gao et al.8 revealed that Fe2O3 additive in V2O5–WO3/Fe2O3/TiO2 improved the NO decomposition due to the oxidation of NO to NO2 by Fe2O3. Liu et al.9 pointed out the Mn addition significantly enhanced the activity of V2O5/TiO2 catalyst for NH3-SCR below 400 °C owing to the synergistic effect of the redox cycle (Mn4+ + V4+ ↔ V5+ + Mn3+). These additives can not only serve as “structure” promoter but also play a “chemical” role in promoting the redox properties and influencing other intrinsic chemical states of the active vanadium species, including oxidation state and coordination circumstance, which is consistent with the promotion effect of WO3 or MoO3.10,11 Recently, highly dispersed amorphous copper oxides12 have been attractive due to the excellent performance in NOx conversion. Ramis et al.13 reported CuO–TiO2 showed high activity even at relatively low temperature in the NH3-SCR process. Ettireddy et al.7 developed the Cu/TiO2 catalyst that presented superior de-NOx performance at the low temperature under industrial relevant condition. The low temperature performance is associated with the remarkable surface Lewis acidic sites and the existence of redox cycle between Cu2+ and Cu+. However, limited information is available to regard the promotional effect of copper oxides on the V2O5–WO3/TiO2 catalysts for NH3-SCR active, especially the detail investigations focusing on further understanding the relationship among the “composition–structure–property” remain unreported.
It is well received that the redox property of vanadium species is principal factor governing activity and that this reaction may involve primarily the coordinated ammonia species on Lewis acid sites.10,14,15 Therefore, it is possible to improve the performance of V/WTi catalyst at low temperature by adding Cu. Meanwhile, it seeks to further understand the structure–performance correlation of copper oxide addition on the V/WTi catalyst. The V/WTi was first prepared by traditional incipient wetness impregnation method, and then, Cu was added to gain the V(Cu)/WTi catalyst with the same method. The promoting effect of Cu on the SCR active was evaluated and the structure–performance correlation on NH3-SCR performance was investigated. Moreover, the mechanism study was conducted by in situ DRIFTS techniques and kinetic analysis to elucidate the cause of Cu influencing the NH3-SCR performance. Finally, a mechanism of NH3-SCR over V(Cu)/WTi catalyst at low temperature is proposed to further understand the promotion effect.
2. Experimental
2.1 Catalysts preparation
The CuO (molar ratio Cu/V = 1![[thin space (1/6-em)]](https://www.rsc.org/images/entities/char_2009.gif) :1) modified V2O5/WO3–TiO2 catalyst with 1 wt% V2O5 was prepared by the traditional incipient wetness impregnation method. Commercial support (DT-52), was obtained from Millennium Inorganic Chemicals Inc. The complex of VO(CO2)2 was prepared by reacting calculated amount of V2O5 powder with appropriate amount of oxalic acid liquid (1 M) with continuous stirring at 70 °C for 30 min. Subsequently, the desired quantity of WTi powder was added into the mixed solution and stirred at 70 °C for 1 h. This mixture was statically dried overnight at 100 °C. The V(Cu)/WTi and Cu/WTi were prepared by the same method with dissolving a desired amount of Cu(NO3)2·5H2O into the aqueous solutions, and then the desired amount of dried V/WTi powder without calcination and WTi added into the mixed solutions and stirred 1 h, then dried overnight at 100 °C and calcined at 600 °C for 5 h.
:1) modified V2O5/WO3–TiO2 catalyst with 1 wt% V2O5 was prepared by the traditional incipient wetness impregnation method. Commercial support (DT-52), was obtained from Millennium Inorganic Chemicals Inc. The complex of VO(CO2)2 was prepared by reacting calculated amount of V2O5 powder with appropriate amount of oxalic acid liquid (1 M) with continuous stirring at 70 °C for 30 min. Subsequently, the desired quantity of WTi powder was added into the mixed solution and stirred at 70 °C for 1 h. This mixture was statically dried overnight at 100 °C. The V(Cu)/WTi and Cu/WTi were prepared by the same method with dissolving a desired amount of Cu(NO3)2·5H2O into the aqueous solutions, and then the desired amount of dried V/WTi powder without calcination and WTi added into the mixed solutions and stirred 1 h, then dried overnight at 100 °C and calcined at 600 °C for 5 h.
2.2 Catalysts characterization
Powder X-ray diffraction (XRD) was performed on Bruker D8 Advance TXS employing Cu Kα radiation (λ = 0.15418 nm). The XRD pattern was collected from 20° to 80° with the step size of 0.02°. The mean crystallite sizes of titania are calculated using Scherrer equation. The nitrogen adsorption–desorption isotherms of the samples were determined at −196 °C by V-Sorb 2800 TP, and the corresponding pore size distribution curves were calculated from branches by the BJH method. The BET surface area is calculated from the Brunauer–Emmett–Teller (BET) method. The samples were degassed for 5 h at 300 °C in N2 before measurement.
Electron paramagnetic resonance spectroscopy (EPR) was performed with a Bruker Model A320 instrument in a rectangular ER 4102st cavity. Prior to analysis, the samples were pretreated for 5 h at 300 °C, and then the EPR spectra was recorded at room temperature and atmospheric pressure.
Hydrogen temperature-programmed reduction (H2-TPR) was conducted using 0.1 g catalysts. The samples were pretreated with 5% O2/N2 (30 ml min−1) at 500 °C for 1 h and then cooled down to room temperature in N2. The samples were elevated in 5% H2/N2 (30 ml min−1) from 50 to 900 °C at a ramping rate of 10 °C min−1 while the consumption of H2 was recorded continuously using TCD.
The X-ray photoelectron spectroscopy (XPS) was recorded on a PHI-1600 ESCA system. All binding energies were calibrated internally by the carbon deposit C 1s binding energy (BE) at 284.8 eV.
The temperature-programmed desorption (TPD) of NO + O2 was performed using a Fourier Transform Infrared spectrometer (MKS-2030). Prior to TPD, 0.2 g samples were pre-treated with 5% O2/N2 (333 ml min−1) at 500 °C for 0.5 h and then cooled down to 50 °C. For NO + O2-TPD, the samples were saturated with a 500 ppm NO + 5% O2/N2 for 1 h, followed by N2 purge for another 1 h. The temperature was then raised up from 50 °C to 500 °C at a 10 °C min−1 ramping rate.
In situ diffuse reflectance Infrared Fourier transform spectra of adsorption species were performed on Nicolet 6700 FTIR equipped with a MCT detector cooled by liquid N2 at a resolution of 4 cm−1, averaging 10 scans for each spectrum. Diffuse reflectance experiments were performed in situ in a commercial high temperature chamber (Thermofisher) fitted with a ZnSe window. Prior to reactant gas (NH3 or NO) chemisorption, the samples were initially treated with 10% O2/N2 (50 ml min−1) at 500 °C for 30 min, and then the samples were cooled down to the target temperature. The samples were subsequently flushed under N2 for 1 h to remove any adsorbed impurities for background collection. Then the gas containing 3000 ppm NH3 or 3000 ppm NO + 5% O2 in N2 (50 ml min−1) passed through the sample at the target temperature for 45 min. In situ DRIFTS spectra were collected after purging the weakly adsorbed gas molecules. In situ DRIFTS spectra for NO, NH3 and O2 co-adsorption were collected at the similar conditions as NO chemisorption, where 3000 ppm NO and 3000 ppm NH3 in 5% O2 + N2 were introduced to the system.
2.3 Activity measurement
The catalytic activity measurement for the reduction of NO by NH3 (NH3-SCR) was carried out in a quartz reactor with 0.2 g catalysts (60–80 mesh) with 0.8 g of quartz (60–80 mesh). The temperature was monitored by a type K thermocouple inserted into the center of the catalyst. The concentrations of NO, NO2, N2O, H2O and NH3 were measured using a Fourier Transform Infrared spectrometer (MKS-2030) equipped with a 5.11 m gas cell. The gas flow rates in all experiment were controlled at 333 ml min−1 using mass flow controllers. Prior to experiments, the catalysts were pre-treated at 500 °C for 30 min under 5% O2/N2. The NOx conversion was measured from 100 °C to 500 °C at a ramp rate of 10 °C min−1. The reaction gas mixture contained 500 ppm NH3, 500 ppm NO, 4% H2O, 5% O2, and the balance of N2 at gas hourly space velocity (GHSV = 10000 h−1). The NOx conversion was calculated using the following equation:| |
 | (1) |
2.4 Kinetic measurement
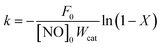
The kinetic tests were performed in a differential reactor, using 25 mg (80–100 mesh) of 75 mg of quartz sands (80–100 mesh). To avoid the diffusion effect, the experiment was carried out under steady-state conditions at high GHSV (300000 h−1). The samples were pre-treated in 5% O2/N2 at 500 °C for 30 min before the kinetic experiments. The kinetic steady-state measurements with a gas composition of 500 ppm NH3, 500 ppm NO and 5% O2 were performed between 220 and 280 °C. The kinetic parameters for the NO conversion were generally considered to be a first order reaction.16–18 The rate constant (k) can be calculated as:| |
 | (3) |
| |
 | (4) |
where k is the reaction rate constant (ml g−1 s−1), F0 is the molar NO feed rate (mol min−1), [NO]0 is the molar NO concentration (mol min−1) at the inlet, Wcat is the catalyst weight (g), X is the NO conversion (%), A is the pre-exponential factor, Ea is the apparent activation energy (J mol−1), R is the gas constant (8.314 J mol−1 K−1) and the T is the temperature (K).
3. Results
3.1 NH3-SCR performance
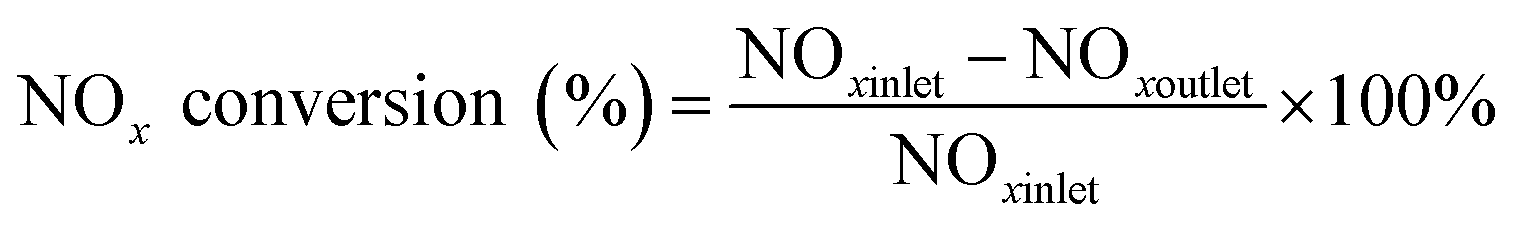
As shown in Fig. 1, NH3-SCR performance of these catalysts follows the order: V(Cu)/WTi > V/WTi > Cu/WTi. Although, the V/WTi sample exists a better NH3-SCR activity than Cu/WTi as a reference sample in the whole temperature range, NOx conversion of this sample is still less than 65% below 250 °C. While V(Cu)/WTi expresses a superior NH3-SCR performance in comparison with V/WTi and the temperature window shifts toward lower temperature. At 250 °C the NOx conversion reaches 84%, much higher than the 65% of V/WTi and the 46% of Cu/WTi. The result clear shows that the co-existence of Cu and V could significantly enhance NH3-SCR activity at low temperature. Under the reaction condition without H2O, the NH3-SCR performance showed in Fig. S1† for all catalysts is improved at low temperature, and the similar inhibiting effect of H2O on activity has been observed by others,16 which is attributed to the competitive adsorption of H2O on the vanadia sites leading to a reduction in the number of sites available for the adsorption of reagent. While the activity of three catalysts follows the same sequence of V(Cu)/WTi > V/WTi > Cu/WTi under the reaction condition with or without H2O.
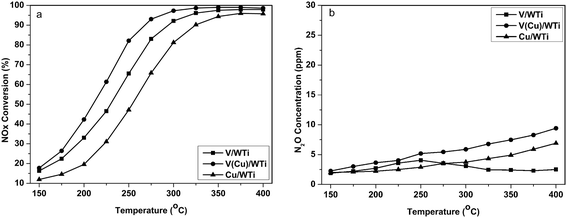 |
| | Fig. 1 NH3-SCR evaluation on V/WTi, V(Cu)/WTi and Cu/WTi catalysts as a function of temperature. (a) NOx conversion (b) N2O generation. | |
3.2 Characterization
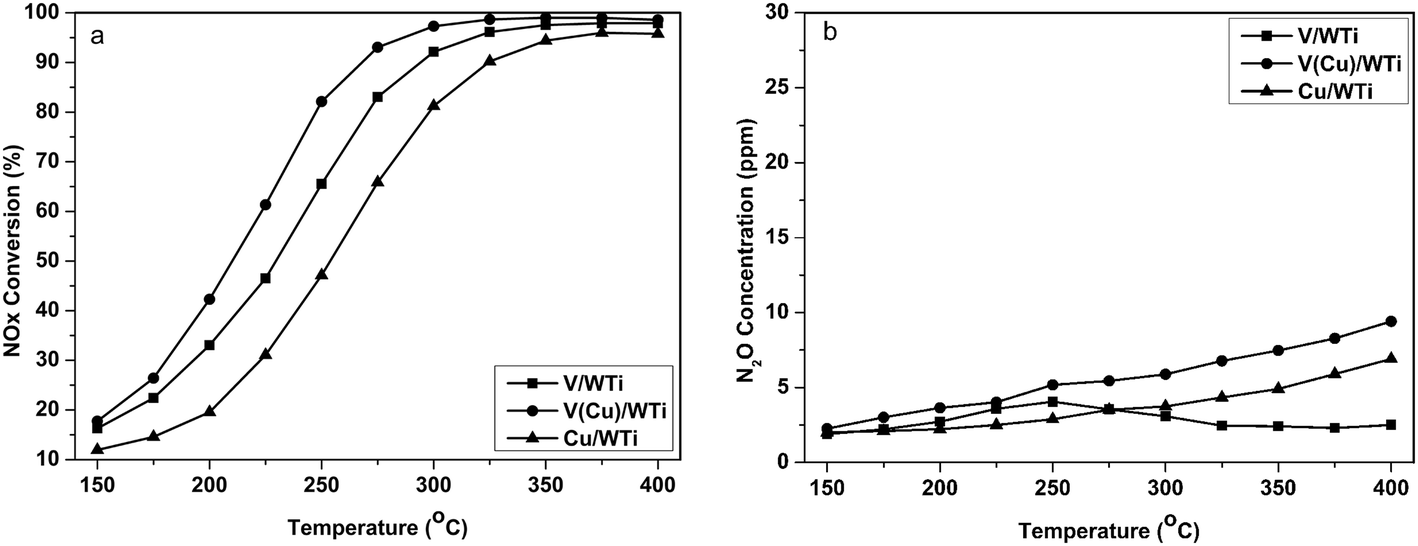
3.2.1 Phase composition and surface area. XRD results are showed in Fig. 2, and the crystalline sizes, lattice parameters and cell volume are listed in Table 1. These samples all exhibit the typical anatase phase of TiO2, but no CuO and V2O5 diffractions are observed. It indicates that both CuO and V2O5 are well dispersed on the surface of TiO2 as highly amorphous states or formed crystallites are too small to be detected. As showed in Table 1, besides the SBET and VBJH, their crystalline sizes, lattice parameters and cell volume also remain the same level, which suggests almost no or little effect on the support crystal structure with the introduction of CuO and V2O5. The theoretical surface density of vanadium on V/WTi and V(Cu)/WTi is 2.7 μmol m−2 and 2.9 μmol m−2, which is clearly less than the monolayer coverage (13.2 μmol m−2).19 So, the vanadium species can be well dispersed on the support with the Cu doping. Moreover, it can be well explained by the Raman spectra. As shown in Fig. S2,† the Raman vibration mode of anatase TiO2 can only be observed over V(Cu)/WTi and V/WTi without any signals for other metal, especially no bands ascribed to polymeric metavanadate species observed. Therefore, it has concluded that the V and Cu species can be highly dispersed on the support.
 |
| | Fig. 2 XRD patterns of various catalysts. | |
Table 1 Textural and structural properties of the catalysts
| Samples |
SBETa (m2 g−1) |
VBJHb (cm3 g−1) |
DBJHc (nm) |
TiO2 crystalline size (nm) |
Lattice parameters |
Cell volume (Å3) |
| a = b (Å) |
c (Å) |
| BET surface area of the samples. BJH desorption cumulative volume of pores. BJH desorption average pore diameter (4 V A−1). |
| V/WTi |
41 |
0.291 |
19.0 |
20.4 |
3.784 |
9.500 |
136.0 |
| V(Cu)/WTi |
37 |
0.281 |
20.1 |
21.1 |
3.787 |
9.508 |
136.4 |
| Cu/WTi |
37 |
0.290 |
20.0 |
21.6 |
3.786 |
9.513 |
136.4 |
3.2.2 EPR. EPR spectra of the samples are displayed in Fig. 3. Tetravalent vanadium exists a quite complex electron resonance spectrum, which is due to the high number of hyperfine lines arising from the interaction of the unpaired electron with the 51V nucleus and the anisotropy of both g and A tensors,20 therefore their parameters may not be exactly calculated. The parameters of anisotropic g factors and hyperfine splitting constants for V/WTi are as follow: g∥ = 1.926 ± 0.002, g⊥ = 1.976 ± 0.002, A∥ = 184 ± 2G, and A⊥ = 57 ± 2G values, which arises from the isolated, axially symmetric VO2+ species in square-pyramidal and/or octahedral coordination.10,20–22 The broad isotropic singlet can be observed, which is assigned to the clustered V–O–V clusters.10 In addition, the type hyperfine structure of the isolated VO2+ species exhibiting a broad signal indicates the presence of V4+ in V/WTi, which has been reported by others.14 The spectrum of V(Cu)/WTi, however, is much smaller, actually almost no hyperfine structure to be discerned, which may be due to the presence of copper suppressing stable isolated V4+ formation. Only the EPR signal corresponding to octahedral isolated Cu2+ presets g⊥ = 2.070 ± 0.002 appears.23 This result can be attributed to an affinity of interaction between surface copper and vanadium oxides. Thus the quasi-free electrons of the V4+ species can be captured by the copper component in the vicinity of surface vanadium oxide species, causing the concentration less than the limiting value, which results in the signals of the V4+ species too weak to be observed. This conclusion will be further confirmed by the following H2-TPR and XPS analysis.
 |
| | Fig. 3 EPR spectra of V/WTi and copper-containing V/WTi at room temperature after they were evacuated for 5 h at 300 °C and sealed off. | |
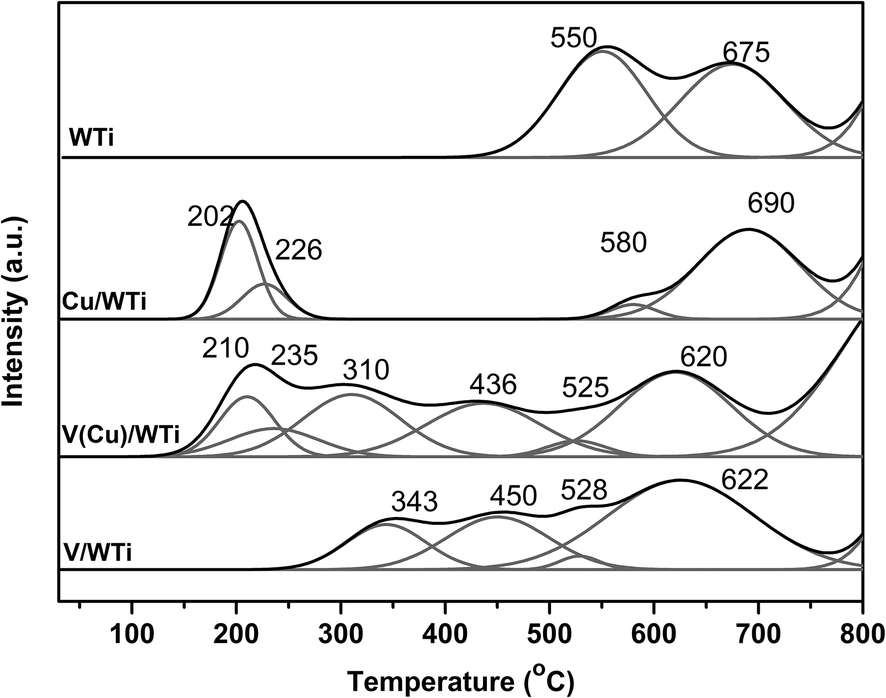
3.2.3 H2-TPR. Temperature-programmed reduction (H2-TPR) experiments were conducted to further investigate the effect of copper modification on the reduction behavior and the results are presented in Fig. 4 and Table 2. The support exhibits two major reduction peaks at 550 °C and 675 °C, which can be assigned to the reduction of some sulfate species existing on the surface of support24,25 and the well dispersed tungsten species oxide and TiO2 support.26 The V/WTi catalyst shows two new reduction peaks at 343 °C and 450 °C ascribed to the stepwise reduction of V5+ and V4+ (ref. 25, 27 and 28), and the peak of support TiO2 and tungsten oxide is clear shifted to lower temperature, which can be an indication of the strong interaction between V and support. The reduction temperature of vanadium species is obviously lower that is accounted for the V–O–Ti interaction,27 which is accorded with the lower reduction temperature of the support. The shoulder peak at 528 °C is remarkably smaller than that of the support, corresponding to the decomposition of the sulfate species during the calcination process,10 which can be observed over other two catalysts. In presence of Cu, the new overlapped peaks deconvoluted two sub-peaks at 210 °C and 235 °C are attributed to the reduction of Cu2+ and Cu+ (ref. 29 and 30), which shifts to higher temperature, compared to the peaks at 202 °C and 226 °C for Cu/WTi. Meanwhile, the reduction temperature of vanadium species clear shifts to lower temperature (310 °C and 436 °C). It suggests the reducibility of vanadium species is significantly improved by Cu oxide. The last broaden peak due to the support is just like the V/WTi, which means that the interaction between the Cu and the W or Ti can be very weak. The signals have been fitted with Gaussian lines to assess the H2 consumptions for the individual species, and the results of quantitative analysis are displayed in Table 3. The amount of H2 consumption due to V reduction on V/WTi is 1.42 mmol g−1 and Cu on Cu/WTi is 1.46 mmol g−1, while the total H2 consumption due to both Cu and V on V(Cu)/WTi is 1.90 mmol g−1 that is lesser than the sum of V/WTi and Cu/WTi samples. Meanwhile, the H2 consumption ratio of V5+/V4+ increases with the ratio of Cu2+/Cu+ decreasing shown in Table 3, which suggests larger amounts of easily reduced V5+ species formation on the Cu modified V/WTi sample, which is highly consistent with the EPR. The results strongly indicates that the synergistic interaction between V and Cu exists in V(Cu)/WTi catalyst, which greatly enhances the reduction potential of vanadium species. The synergistic interaction will be expounded in detail with the following discussion.
 |
| | Fig. 4 The H2-TPR result of the catalysts. | |
Table 2 H2-temperature programmed reduction
| Samples |
Reduction peaks temperature (°C) |
| Cu |
V |
SO42− |
Support (W and Ti) |
| T1 |
T2 |
T1 |
T2 |
T1 |
T1 |
| WTi |
— |
— |
— |
— |
550 |
675 |
| V/WTi |
— |
— |
343 |
450 |
528 |
625 |
| V(Cu)/WTi |
210 |
235 |
310 |
436 |
525 |
620 |
| Cu/WTi |
202 |
226 |
— |
— |
580 |
690 |
Table 3 H2 consumption of the obtained samples
| Samples |
Cu2+/Cu+ |
V5+/V4+ |
Total H2 consumption of V and Cu(mmol g−1) |
| V/WTi |
— |
0.66 |
1.42 |
| V(Cu)/WTi |
1.32 |
1.00 |
1.90 |
| Cu/WTi |
2.30 |
— |
1.46 |
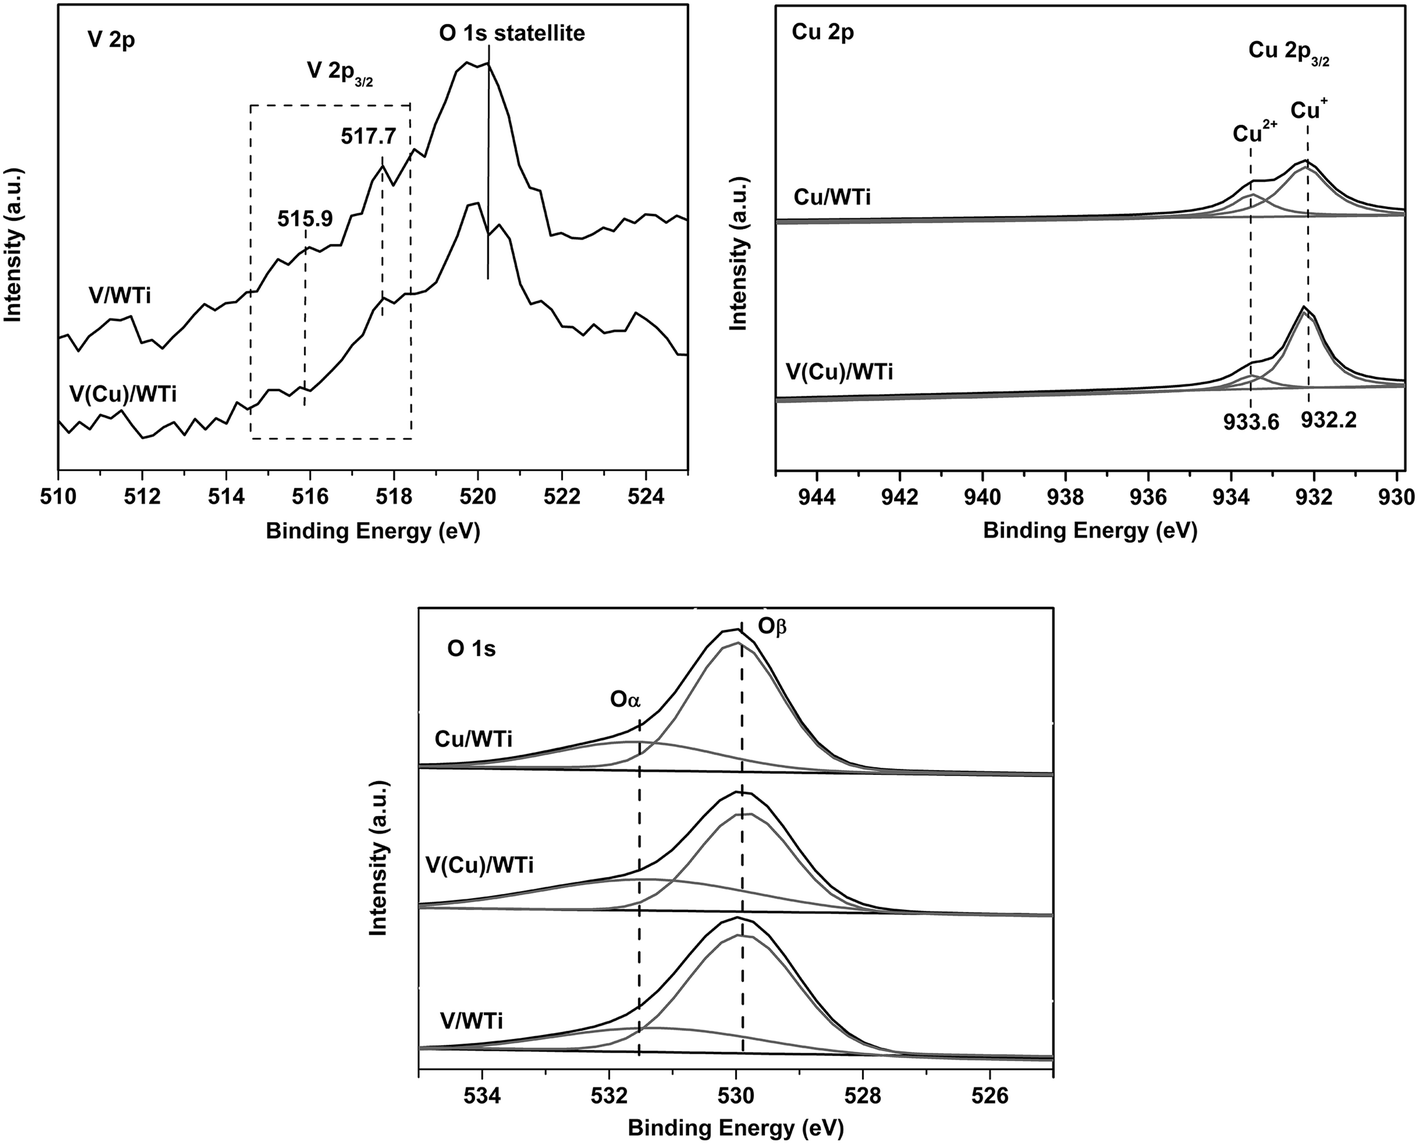
3.2.4 XPS. XPS analysis for the samples are illustrated in Fig. 5 and Table 4. As shown in Fig. 5 (V 2p), the vanadium oxide species in different chemical state can be identified by the position of the V 2p3/2 level. The V 2p3/2 peak within the range reported for V5+ (517.0–517.8 eV) and V4+ (515.6–516.1 eV) is very weak and impeded by the near O 1s satellite peak (520.3 eV). The results indicate the vanadium species are highly dispersed and located on the support in accord with the XRD and Raman analysis, and the V surface concentration is too low to quantitatively analyze. However the weak shoulder peaks exhibiting at 515.9 eV and 517.7 eV ascribed to V4+ and V5+ can be detected,31–33 suggesting that the redox couple V5+/V4+ exists on the catalysts which is in good agreement with our H2-TPR and EPR.
 |
| | Fig. 5 XPS spectra of the obtained samples: V 2p, Cu 2p and O 1s. | |
Table 4 The surface compositions of the obtained samples
| Samples |
Surface atomic concentration |
Surface atomic ratio |
| Ti (at%) |
W (at%) |
Cu (at%) |
O (at%) |
Cu2+/(Cu2+ + Cu+) (%) |
Oα/Oα + Oβ (%) |
| V/WTi |
21.15 |
5.02 |
— |
73.84 |
— |
30.83 |
| V(Cu)/WTi |
19.47 |
4.65 |
0.88 |
75.00 |
15.83 |
42.85 |
| Cu/WTi |
22.96 |
5.00 |
0.93 |
71.11 |
24.18 |
27.09 |
The result of Cu 2p is shown in Fig. 5 (Cu 2p). The binding energies of Cu 2p3/2 and Cu 2p1/2 peaks are located at 932.6 eV and 952.4 eV. The catalysts with low copper oxide loading exhibit a main center at 932.2 eV and a weak peak at 933.6 eV, which are the characteristics of Cu+ and Cu2+ species, respectively.34 For Cu/WTi and V(Cu)/WTi samples, the shake-up peak is very weak, indicating that the main copper specie is the Cu+. The relative percentage of Cu2+ can be determined by the area ratio of the corresponding characteristic peaks, and listed in Table 4. In comparison with the Cu/WTi, the percent of Cu2+ on the V(Cu)/WTi sample is much lower, which is mainly owing to the redox cycle of Cu2+ + V4+ ↔ V5+ + Cu+ shifting to the right, that is to say the electrons can conduct from V4+ to Cu2+ resulting in the higher amount of Cu+ and V5+ formed, which is well agreed with the H2-TPR and EPR results. In addition, the redox couple of Cu2+/Cu+ can reduce the surrounding electron clouds density of the vanadium species,35 promoting the electron transformation between the vanadium species and reagent, thus facilitating the reducibility of vanadium species as shown in H2-TPR profile.
The O 1s ionization of the XPS spectrum features is numerically fitted with two components: the first peak at 529.7 eV is attributed to the lattice oxygen (denoted as Oβ) and the one at 531.2 eV is ascribed to the surface adsorbed oxygen (denoted as Oα) such as O22− or O− assigned to the defect oxide or surface hydroxyl and adsorbed water,29,36 which is shown in Fig. 5 and Table 4. It is clear evident that the ratio of Oα over V(Cu)/WTi sample is much higher than that over other two samples, and the order is V(Cu)/WTi > V/WTi > Cu/WTi. The result obviously indicates the chemisorbed surface oxygen (Oα) content is significantly improved by Cu doping into V/WTi. The high ratio of Cu+ over V(Cu)/WTi sample can create the charge imbalance, oxygen vacancy, and unsaturated chemical bonds on the surface of the catalyst, contributing to more surface chemisorbed oxygen formed, which is well in accordance with the less total H2 consumption of copper species. The surface oxygen (Oα) is more reactive in the oxidation reaction due to its higher mobility than lattice oxygen (Oβ).2,32 Herein, the relative higher concentration surface oxygen may be attributed to the superior NH3-SCR activity at low temperature.
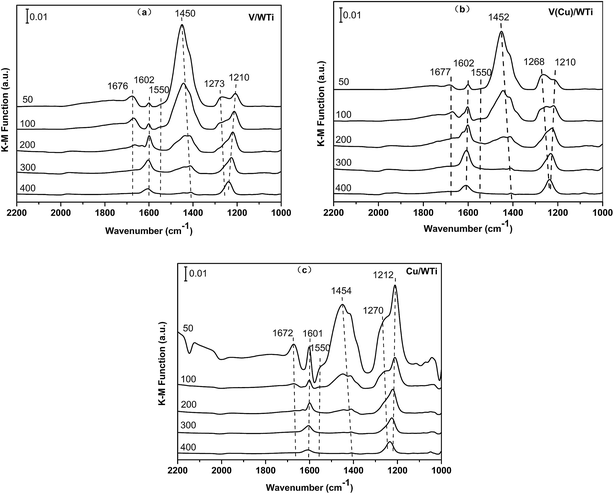
3.2.5 Surface acidity. In order to thoroughly distinguish the Lewis acid site and Brønsted acid site and their quantities, in situ DRIFTS are conducted between 50 and 400 °C, and the results are exhibited in Fig. 6. After NH3 adsorption on the V/WTi sample at 50 °C, several bands are detected in the range of 1000–1800 cm−1. The bands at 1450 and 1672 cm−1 are assigned to asymmetric and symmetric vibrations of N–H bonds in NH4+ coordinately linked to Brønsted acid sites. The bands at 1602 cm−1 and a broaden peak between 1210 cm−1 and 1273 cm−1 are attributed to asymmetric and symmetric vibrations of the NH3 coordinately bound to Lewis acid sites.12,37 In addition, amide (NH2) species coordinated to Lewis acid sites also can be observed at 1550 cm−1, which can be an important activated surface intermediate in ammonia activation for NH3-SCR.13
 |
| | Fig. 6 DRIFT spectra of NH3 adsorption of all catalysts at different temperature. | |
As compared with V/WTi, the results of V(Cu)/WTi and Cu/WTi are shown in Fig.6b and c. All the similar NH3 species adsorbed on the catalyst surface can be observed. The assignments of in situ DRIFTS bands are listed in Table 5. However, the intensity and proportion of these two kinds of acid sites is significant difference. In Table 6, it is clear suggesting that the V/WTi catalyst possesses the main Brønsted acid sites and the Cu/WTi catalyst contains the dominating Lewis acid sites. The proportion of Lewis acid sites on V(Cu)/WTi catalyst is slightly higher than that of the V/WTi sample, which is in accordance with the superior catalyst activity at low temperature, while the ratio of Brønsted acid sites remarkably decreases. This strongly indicates the Lewis acid sites, especially the activity of NH3 species bonded to, play a more important role than the Brønsted acid sites in low-temperature NH3-SCR performance.
Table 5 Assignments of DRIFTS bands observed during the NH3 adsorption
| Wavenumber (cm−1) |
Assignments |
References |
| 1450 and 1676 |
Asymmetric and symmetric vibrations of N–H bonds in NH4+ coordinately linked to Brønsted acid sites |
35 |
| 1210, 1270 and 1602 |
Asymmetric and symmetric vibrations of the coordinated NH3 linked to Lewis acid sites |
11 |
| 1550 |
NH2 species coordinated to Lewis acid sites |
13 |
Table 6 The integral of NH3 peak area adsorbed on the Brønsted acid 1452 (cm−1) and Lewis acid 1223 (cm−1) at 50 °C
| Samples |
Brønsted acid (a.u.) |
Lewis acid (a.u.) |
L/B (a.u.) |
| V/WTi |
9.3 |
1.5 |
0.16 |
| V(Cu)/WTi |
8.4 |
2.1 |
0.25 |
| Cu/WTi |
2.9 |
6.0 |
2.01 |
With an increase of temperature, the intensity of the band at 1450 cm−1 decreases more noticeably than that of 1210 cm−1, which still remains and shifts to higher wave number. This indicates that the Lewis acid sites are more stable than Brønsted acid sites on the catalyst surface. Meanwhile, the band at 1270 cm−1 weakens and shifts significantly download to around 1230 cm−1, which shows the weaker acid strength. It is worth noting that the peak at 1268 cm−1 of the V(Cu)/WTi is obviously higher than the others, which may be attributed to the large amount of lower-valent copper species due to the electron conduction between the V and Cu species decreasing the intensity of Lewis acidity,38 which is in good accordance with the EPR and TPR results. Thus the NH3 species are mainly adsorbed on the Lewis acid site contributed from vanadium species. With the temperature increasing to 300 °C, all the adsorbed NH3 species on Brønsted acid sites eventually disappear, which further indicates that the superior NH3-SCR performance is well associated with NH3 species bound to vanadium species in this work.
3.2.6 NOx adsorption. The NO + O2-TPD profiles of the catalysts are illustrated in Fig. 7, and the quantitative results are summed in Table 7. All the catalysts show only the desorption peak of NO2 between 50 °C and 350 °C without any desorption peak of NO, which may be due to NO oxidation by chemisorbed surface oxygen on the catalysts. Only one distinct desorption peak at 275 °C is observed on the V/WTi sample, whereas the Cu/WTi exhibits not only a stronger peak centered at 300 °C but also a small peak at 78 °C, respectively. The low temperature peak (labeled as Sw) can be related to the weakly adsorbed nitrate on the catalytic surface39 and the high temperature peak (labeled as Ss) is attributed to the stably adsorbed nitrate species,8 which can be described in detail by NO + O2-in situ DRIFTS results. This confirms that the existence of both kinds of adsorption sites over the Cu/WTi. Moreover, the amounts of the two sites are much higher than those of V/WTi. For V(Cu)/WTi samples, the first peak at 85 °C exhibits an obvious increase and the second peak at 285 °C shows a clear decrease. The ratio of Sw/Ss for V(Cu)/WTi is 0.60 much larger than the 0.11 of Cu/WTi and 0.04 of V/WTi. From the results, it clear indicates that the addition of Cu to the V/WTi not only provides new adsorption sites but also reduces the number of strong adsorption sites, which can be explained by the synergistic interaction of electron conduction between Cu and V contributing to stably nitrate species adsorbed on Cu species transforming into weakly adsorbed ones. The large amounts of the weakly adsorbed nitrate can decompose as NO2 with the temperature rise, which can be generally considered as an important intermediate species for NH3-SCR in the low temperature.12,40
 |
| | Fig. 7 NO + O2-temperature programmed desorption profiles of the obtained samples. | |
Table 7 The quantitative analysis of NO2 desorbed on weak site (Sw) at 50–125 °C and strong site (Ss) at 200–350 °C
| Samples |
Weak site (Sw) (a.u.) |
Strong site (Ss) (a.u.) |
Sw/Ss |
Total NO2 amounts (×10−3 mmol g−1) |
| V/WTi |
85 |
2146 |
0.04 |
7.76 |
| V(Cu)/WTi |
1024 |
1715 |
0.60 |
9.12 |
| Cu/WTi |
363 |
3349 |
0.11 |
12.36 |
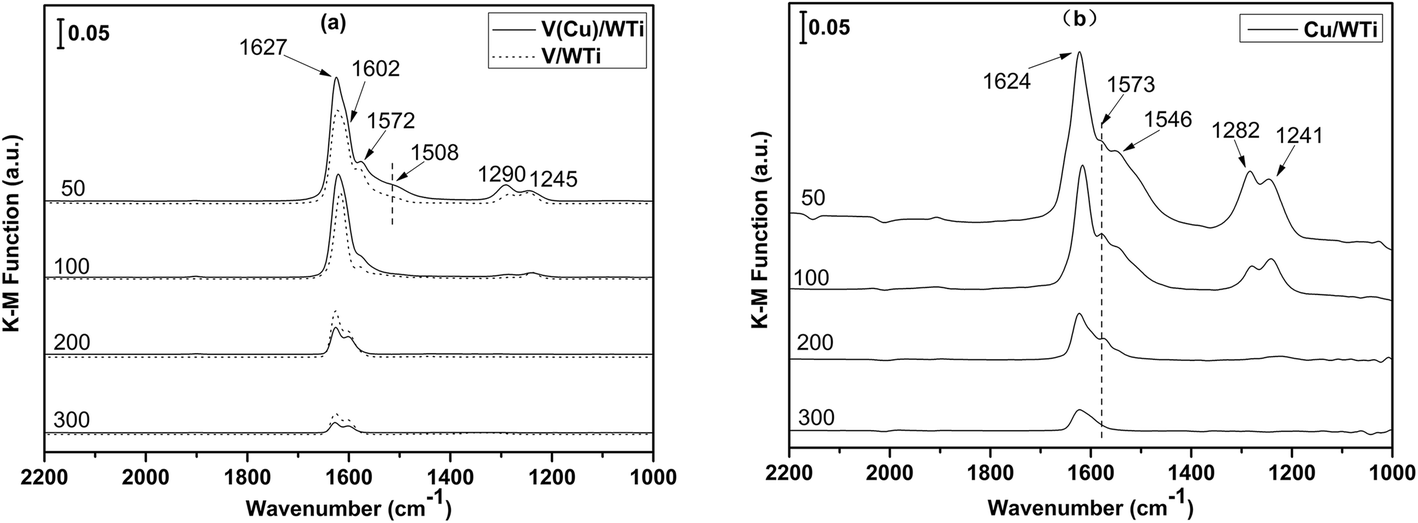
NO + O2 adsorption in situ DRIFTS at different temperatures are shown in Fig. 8. For V/WTi sample, variation bands can be observed in the range of 1000–2000 cm−1 at 50 °C, the bands at 1627 cm−1 and 1245 cm−1 can be assigned to the N![[double bond, length as m-dash]](https://www.rsc.org/images/entities/char_e001.gif) O stretching vibration of bridging bidentate nitrates and chelating bidentate nitrates.41 The band at 1603 cm−1 and a shoulder at 1572 cm−1 are attributed to the bridging monodentate nitrates and bidentate nitrates.42,43 Furthermore, the monodentate nitrates also present a band at 1290 cm−1 (ref. 44). With the addition of Cu, a new band at 1508 cm−1 attributed to the monodentate nitrates appears.41 Moreover, the intensities of all the adsorbed nitrate species are much stronger, which reveals that the presence of Cu can provide new adsorption sites, inducing more adsorbed nitrates species on the surface. As a reference sample, all the bands of absorbed nitrates species exist on the Cu/WTi, excepting for a new band at 1546 cm−1 attributed to the overlap of the monodentate nitrate (1508 cm−1) and bidentate nitrate species (1572 cm−1).24 The assignments of in situ DRIFTS bands are presented in Table 8.
O stretching vibration of bridging bidentate nitrates and chelating bidentate nitrates.41 The band at 1603 cm−1 and a shoulder at 1572 cm−1 are attributed to the bridging monodentate nitrates and bidentate nitrates.42,43 Furthermore, the monodentate nitrates also present a band at 1290 cm−1 (ref. 44). With the addition of Cu, a new band at 1508 cm−1 attributed to the monodentate nitrates appears.41 Moreover, the intensities of all the adsorbed nitrate species are much stronger, which reveals that the presence of Cu can provide new adsorption sites, inducing more adsorbed nitrates species on the surface. As a reference sample, all the bands of absorbed nitrates species exist on the Cu/WTi, excepting for a new band at 1546 cm−1 attributed to the overlap of the monodentate nitrate (1508 cm−1) and bidentate nitrate species (1572 cm−1).24 The assignments of in situ DRIFTS bands are presented in Table 8.
 |
| | Fig. 8 DRIFTS spectra of NO + O2 adsorption of all catalysts at different temperature. | |
Table 8 Assignments of DRIFTS bands observed during the NO + O2 adsorption
| Wavenumber (cm−1) |
Assignments |
References |
| 1627 |
Bridging bidentate nitrates |
39 |
| 1603 |
Bridging monodentate nitrates |
40, 41 |
| 1572 |
Bidentate nitrates |
40 |
| 1508, 1290 |
Monodentate nitrate |
41, 42 |
| 1245 |
Chelating bidentate nitrates |
39 |
With increasing temperature to 100 °C, the intensities of the bands at 1572 cm−1, 1290 cm−1and 1245 cm−1 remarkably decrease and the band at 1508 cm−1 almost vanishes for V(Cu)/WTi catalyst, while those bands decrease slowly on the other catalysts. This result may be due to the adsorbed nitrate species desorbing, decomposing or converting into NO2 during the heating process, which is correspondence with the NO + O2-TPD. With the further elevation of temperature to 300 °C, only the bands at 1627 cm−1 and 1602 cm−1 still exist for the three samples, which suggests the bridging bidentate and bridging monodentate nitrates are more stable. Interestingly, the intensities of the both nitrates on V(Cu)/WTi catalyst are obviously weaker than those of the other catalysts. It clear suggests the existence of Cu can significantly activate the adsorbed nitrates which are conductive to release much more NO2 facilitating to improve the NO2/NOx, which is beneficial for NH3-SCR.45
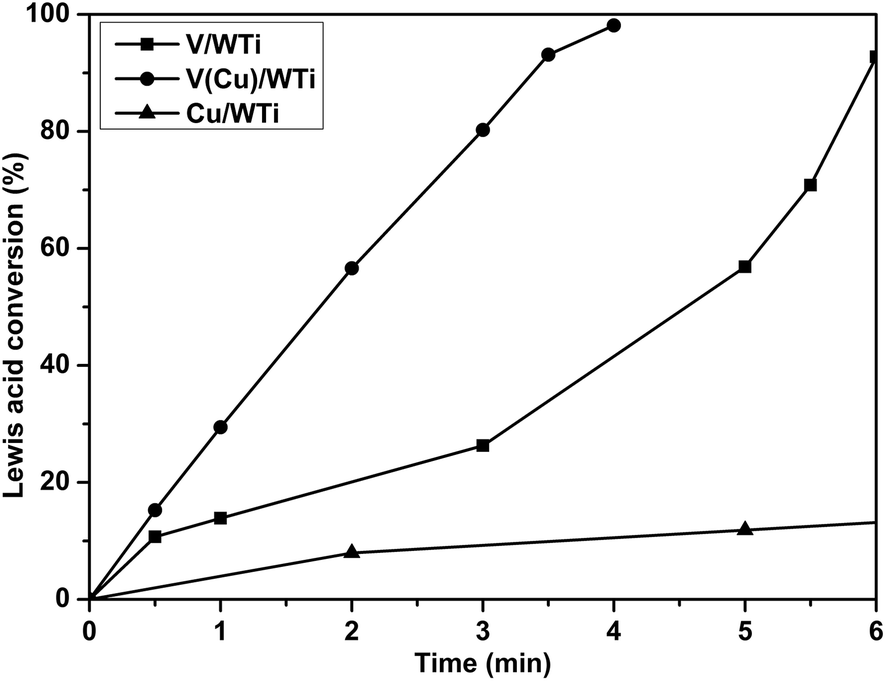
3.2.7 Reaction between NO + O2 and adsorbed NH3 species. In order to further explore the different activity of NH3 species linked to Lewis and Brønsted acid sites on the surface of these catalysts during the NH3-SCR process, in situ DRIFTS spectra of the reaction between NO + O2 and pre-adsorbed NH3 species on catalysts are recorded at 200 °C, and the corresponding results are shown in Fig. S4.† The consumption rate of the NH3 adsorption species linked to the Lewis sites is observably difference among the catalysts. The integral conversion of NH3 species adsorbed to Lewis acid site (1220 cm−1) over the catalysts as a function of time at 200 °C is illustrated in Fig. 9. It can be observed that only after 4 min the conversion of NH3 species linked to Lewis acid sites is almost completely over V(Cu)/WTi sample, while it takes 6 min and 15 min for V/WTi and Cu/WTi to reach the same level, respectively. This demonstrates that more active NH3 species assigned to Lewis acid site mainly attributed to surface vanadium species are formed on V(Cu)/WTi catalyst, which may be responsible for the enhancement in NH3-SCR performance at low temperature.
 |
| | Fig. 9 Integral conversion of the bands in NH3 adsorption in situ DRIFTS assigned to Lewis acid site (1220 cm−1) over the catalysts as a function of time at 200 °C. | |
3.3 Kinetics for NH3-SCR reaction
The rates of NO conversion over samples with various temperature have been plotted as an Arrhenius plot in Fig. 10, and the apparent activation energies determined by the eqn (3) are shown in Table 9. It is clear that the apparent activation energy for Cu/WTi is higher than that of V/WTi, but the V(Cu)/WTi sample shows the lowest Ea (42.14 kJ mol−1). According to the kinetic results, the activation energies calculated for NH3-SCR are in accordance with other literatures.46,47 Meanwhile, the same trend can be observed in normalization reaction rate constant by SBET following the order as: V(Cu)/WTi > V/WTi > Cu/WTi. This result significantly indicates the decrease of Ea clear improve the rate constant well correlating with the enhancement of the redox property, which is consistent with the superior SCR activity at low temperature.
 |
| | Fig. 10 Arrhenius plots of intrinsic reaction rate constants of the catalysts. | |
Table 9 Kinetic parameter (Ea) for NH3-SCR over the samples
| Samples |
V/WTi |
V(Cu)/WTi |
Cu/WTi |
| Ea (kJ mol−1) |
57.18 |
42.14 |
65.01 |
4. Discussion
4.1 The chemical modification of V/WTi by doping copper species
Our results reveal that the NH3-SCR performance can be remarkably enhanced by Cu adding at low temperature. The XRD and Raman show that the copper and vanadium species are highly dispersed on the catalyst surface with the existence of redox couples of both V5+/V4+ and Cu2+/Cu+ that is proved by EPR, H2-TPR and XPS results. Less total H2 consumption suggests that the higher amount of Cu+ causes a charge imbalance on the catalyst surface, and thereby induces to generate more surface oxygen species (Oα), which benefits the enhancement of NO oxidation and the activity of weakly adsorbed nitrates on Cu species.14,18 It is well know that the redox properties of active sites of vanadium species play a key role in controlling the performance of NH3-SCR reaction, especially at low temperature.15,23,48 The H2-TPR results reveal the copper species promote reducibility of vanadium species via the transformation of V5+/V4+, which can be illustrated that the redox couple Cu+/Cu2+ induces electrons transfer from the reactant to V5+. Besides, the existence of the redox cycle of Cu2+ + V4+ ↔ V5+ + Cu+ over the catalyst is also proved by XPS results and this process can be described as follows:9,29,48,49
| Cu2+ − O2− − V5+ + e ↔ Cu2+ − O2− − V4+ ↔ Cu+ − O2− − V5+ ↔ Cu2+ − O2− − V5+ + e |
The redox cycle can decrease the necessary energy for electrons transfer between Cu and V species. The affinity of both Cu and V species promotes this process resulting in the disappearance of hyperfine structure of the VO2+ species (Fig. 3). The process can significantly enhance the activity of NH3 and NO, and therefore improve the NH3-SCR performance.
4.2 The improvement of adsorption ability by doping copper species
It is well known that the SCR activity is positively related to surface acid sites,50 especially Lewis acid sites may be more important than Brønsted acid sites for low-temperature SCR catalysts.6 The amount of Lewis acid sites is slightly enhanced by Cu additives that is one of the reasons for the enhancement of low-temperature activity for our catalysts. More important, it is the NH3 species bound to Lewis acidity sties (mainly vanadium species) on V(Cu)/WTi that exhibit remarkable activity among the catalyst system, which may owe to electron conduction via the redox cycle of Cu2+ + V4+ ↔ V5+ + Cu+. The redox cycle of Cu2+ + V4+ ↔ V5+ + Cu+ shifting to right reduces the surrounding electron clouds density of vanadium species that induces vanadium species to capture electrons from NH3 species adsorbed on them, which contributes to the process of activating NH3 species to form higher active –NH2 species. Then, the reduced state of vanadium species can transfer electron to affinitive Cu species via the redox cycle. This process can significantly decrease the reactive energy barrier conducing to the lowest Ea for NH3-SCR. On the other hand, the NO + O2-TPD and in situ DRIFTS suggest that the addition of Cu increases NOx species adsorption sites and therefore the amount of nitrates. Meanwhile, the presence of Cu+ species via the redox cycle induces a charge imbalance so that more surface oxygen species (Oα) are formed around the Cu species, which significantly improves the activity of nitrates adsorbed on surface Cu species and thereby results in more NO2 release. Therefore, the higher active NH3 species mainly bonded to V species and active surface nitrates adsorbed on Cu species are responsible for the excellent NH3-SCR performance.
4.3 Possible mechanism of the improvement of NH3-SCR over V(Cu)/WTi catalyst
Our results indicate that the reaction process of NH3-SCR on all the catalysts follows the same Eley–Rideal mechanism (Fig. S5†). But redox properties may be a main factor that is closely related to the reactivity of NH3-SCR at low temperature in our present work, which can be well explained by results of kinetics. The lowest activation energy achieved during the NH3-SCR process over the V(Cu)/WTi catalyst supports our hypothesis.
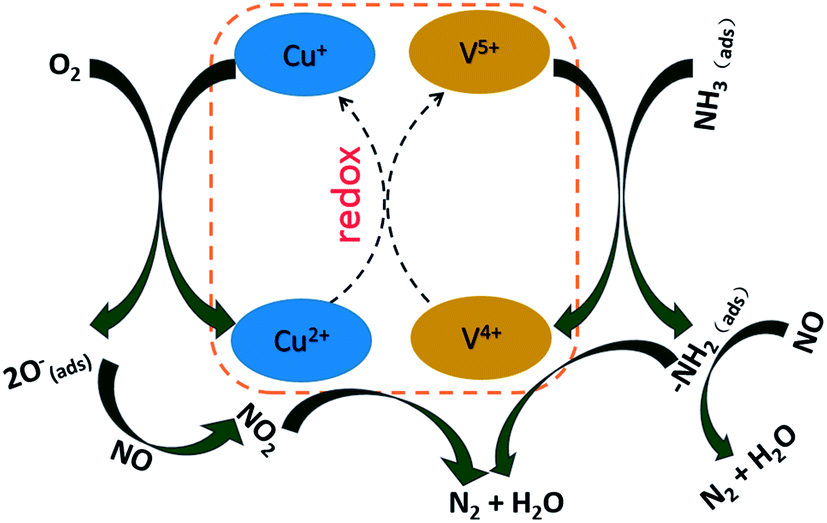
Based on above discussions, the possible promotion process of NH3-SCR reaction is then exhibited in Scheme 1. The interaction between surface vanadium and copper oxide sites by electrons transfer (Cu2+ + V4+ ↔ V5+ + Cu+) may promote the adsorption and activity of NH3 species linked to vanadium species (Fig. 9 and S4†). Besides, the existence of numerous Cu+ species induces more surface oxygen species (Oα) formation, which facilitates the activity of weak adsorption nitrates on Cu species. More NO2 is released from these high active nitrates and promotes the fast NH3-SCR.12 Therefore, it is the redox cycle of Cu and V species (Cu2+ + V4+ ↔ V5+ + Cu+) that improves the NH3-SCR on V(Cu)/WTi at low temperature.
 |
| | Scheme 1 Possible mechanism of the improvement of NH3-SCR over V(Cu)/WTi catalyst. | |
5. Conclusions
In this work, the promoting effect of Cu for NH3-SCR was intensively investigated. The presence of Cu enhances the redox property of Vanadium via the redox cycle of Cu2+ + V4+ ↔ V5+ + Cu+, which remarkably increases the activity of NH3 species adsorbed on vanadium species. Meanwhile, the redox cycle can not only provide more adsorbed nitrate sites but conduce to form higher activity nitrates species on copper species of the catalyst. The higher level of surface oxygen species (Oα) is beneficial to form NO2, which also contributes to the excellent NH3-SCR performance at low temperature. Consequently, the electron conduction via redox cycle of Cu2+ + V4+ ↔ V5+ + Cu+ significantly decreases the Ea for NH3-SCR at low temperature, facilitating the low-temperature activity.
Acknowledgements
The authors acknowledge the China Huadian Science and Technology Institute (CHDI.KJ-20) for financial support. This work is supported by the program of the National High Technology Research and Development Program if China (863 Program, 2011AA03A405).
Notes and references
- P. Forzatti, I. Nova and E. Tronconi, Angew. Chem., Int. Ed. Engl., 2009, 48, 8366–8368 CrossRef CAS PubMed.
- M. S. Maqbool, A. K. Pullur and H. P. Ha, Appl. Catal., B, 2014, 152, 28–37 CrossRef PubMed.
- Y. Li, H. Cheng, D. Li, Y. Qin, Y. Xie and S. Wang, Chem. Commun., 2008, 1470–1472 RSC.
- R. Jin, Y. Liu, Y. Wang, W. Cen, Z. Wu, H. Wang and X. Weng, Appl. Catal., B, 2014, 148–149, 582–588 CrossRef CAS PubMed.
- B. Thirupathi and P. G. Smirniotis, J. Catal., 2012, 288, 74–83 CrossRef CAS PubMed.
- P. G. Smirniotis, D. A. Peña and B. S. Uphade, Angew. Chem., Int. Ed., 2001, 40, 2479–2482 CrossRef CAS.
- P. R. Ettireddy, A. Kotrba, T. Spinks, T. Boningari and P. Smirniotis, Development of Low Temperature Selective Catalytic Reduction (SCR) Catalysts for Future Emissions Regulations, SAE Tech. Pap., 2014, 2014-01-1520 Search PubMed.
- R. Gao, D. Zhang, X. Liu, L. Shi, P. Maitarad, H. Li, J. Zhang and W. Cao, Catal. Sci. Technol., 2013, 3, 191–199 CAS.
- Z. Liu, Y. Li, T. Zhu, H. Su and J. Zhu, Ind. Eng. Chem. Res., 2014, 53, 12964–12970 CrossRef CAS.
- P. G. W. A. Kompio, A. Brückner, F. Hipler, G. Auer, E. Löffler and W. Grünert, J. Catal., 2012, 286, 237–247 CrossRef CAS PubMed.
- H.-L. Koh and H.-K. Park, J. Ind. Eng. Chem., 2013, 19, 73–79 CrossRef CAS PubMed.
- L. Chen, Z. Si, X. Wu and D. Weng, ACS Appl. Mater. Interfaces, 2014, 6, 8134–8145 CAS.
- G. Ramis, L. Yi, G. Busca, M. Turco, E. Kotur and R. J. Willey, J. Catal., 1995, 157, 523–535 CrossRef CAS.
- L. J. Alemany, L. Lietti, N. Ferlazzo, P. Forzatti, G. Busca, E. Giamello and F. Bregani, J. Catal., 1995, 155, 117–130 CrossRef CAS.
- I. E. Wachs, G. Deo, B. M. Weckhuysen, A. Andreini, M. A. Vuurman, M. d. Boer and M. D. Amiridis, J. Catal., 1996, 161, 211–221 CrossRef CAS.
- M. D. Amiridis, I. E. Wachs, G. Deo, J.-M. Jehng and D. S. Kim, J. Catal., 1996, 161, 247–253 CrossRef CAS.
- J. A. Dumesic, N. Y. Topsøe, H. Topsøe, Y. Chen and T. Slabiak, J. Catal., 1996, 163, 409–417 CrossRef CAS.
- L. Lietti, I. Nova, S. Camurri, E. Tronconi and P. Forzatti, AlChE J., 1997, 43, 2559–2570 CrossRef CAS PubMed.
- I. E. Wachs, G. Deo, B. M. Weckhuysen, A. Andreini, M. A. Vuurman, M. d. Boer and M. D. Amiridis, J. Catal., 1996, 161, 211–221 CrossRef CAS.
- M. C. Paganini, L. Dall'Acqua, E. Giamello, L. Lietti, P. Forzatti and G. Busca, J. Catal., 1997, 166, 195–205 CrossRef CAS.
- A. Brückner, U. Bentrup and J.-B. Stelzer, Z. Anorg. Allg. Chem., 2005, 631, 60–66 CrossRef PubMed.
- S. T. Martin, C. L. Morrison and M. R. Hoffmann, J. Phys. Chem., 1994, 98, 13695–13704 CrossRef CAS.
- J. Xue, X. Wang, G. Qi, J. Wang, M. Shen and W. Li, J. Catal., 2013, 297, 56–64 CrossRef CAS PubMed.
- X. Wang, A. Shi, Y. Duan, J. Wang and M. Shen, Catal. Sci. Technol., 2012, 2, 1386–1395 CAS.
- S. M. Jung and P. Grange, Appl. Catal., B, 2001, 32, 123–131 CrossRef CAS.
- L. Chen, J. Li and M. Ge, J. Phys. Chem. C, 2009, 113, 21177–21184 CAS.
- S. M. Lee and S. C. Hong, Appl. Catal., B, 2015, 163, 30–39 CrossRef CAS PubMed.
- S. Besselmann, C. Freitag, O. Hinrichsen and M. Muhler, Phys. Chem. Chem. Phys., 2001, 3, 4633–4638 RSC.
- X. Yao, L. Zhang, L. Li, L. Liu, Y. Cao, X. Dong, F. Gao, Y. Deng, C. Tang, Z. Chen, L. Dong and Y. Chen, Appl. Catal., B, 2014, 150–151, 315–329 CrossRef CAS PubMed.
- H. Zhu, L. Dong and Y. Chen, J. Colloid Interface Sci., 2011, 357, 497–503 CrossRef CAS PubMed.
- J. Mendialdua, R. Casanova and Y. Barbaux, J. Electron Spectrosc. Relat. Phenom., 1995, 71, 249–261 CrossRef CAS.
- J. Y. Lee, S. H. Hong, S. P. Cho and S. C. Hong, Curr. Appl. Phys., 2006, 6, 996–1001 CrossRef PubMed.
- X. Guo, C. Bartholomew, W. Hecker and L. L. Baxter, Appl. Catal., B, 2009, 92, 30–40 CrossRef CAS PubMed.
- H. Zhu, M. Shen, Y. Kong, J. Hong, Y. Hu, T. Liu, L. Dong, Y. Chen, C. Jian and Z. Liu, J. Mol. Catal. A: Chem., 2004, 219, 155–164 CrossRef CAS PubMed.
- B. Liu, J. Du, X. Lv, Y. Qiu and C. Tao, Catal. Sci. Technol., 2015, 5, 1241–1250 CAS.
- M. Kang, E. D. Park, J. M. Kim and J. E. Yie, Appl. Catal., A, 2007, 327, 261–269 CrossRef CAS PubMed.
- N. Y. Topsoe, H. Topsoe and J. A. Dumesic, J. Catal., 1995, 151, 226–240 CrossRef CAS.
- Z. Si, D. Weng, X. Wu, J. Li and G. Li, J. Catal., 2010, 271, 43–51 CrossRef CAS PubMed.
- R. Jin, Y. Liu, Z. Wu, H. Wang and T. Gu, Catal. Today, 2010, 153, 84–89 CrossRef CAS PubMed.
- M. Koebel, G. Madia, F. Raimondi and A. Wokaun, J. Catal., 2002, 209, 159–165 CrossRef CAS.
- K. I. Hadjiivanov, Catal. Rev., 2000, 42, 71–144 CAS.
- X. Yao, Q. Yu, Z. Ji, Y. Lv, Y. Cao, C. Tang, F. Gao, L. Dong and Y. Chen, Appl. Catal., B, 2013, 130–131, 293–304 CrossRef CAS PubMed.
- A. Trovarelli, Catal. Rev., 1996, 38, 439–520 CAS.
- T. Gu, R. Jin, Y. Liu, H. Liu, X. Weng and Z. Wu, Appl. Catal., B, 2013, 129, 30–38 CrossRef CAS PubMed.
- W. Zhao, Q. Zhong, T. Zhang and Y. Pan, RSC Adv., 2012, 2, 7906 RSC.
- A. Shi, X. Wang, T. Yu and M. Shen, Appl. Catal., B, 2011, 106, 359–369 CrossRef CAS PubMed.
- M. Iwasaki, in Urea-SCR Technology for deNOx After Treatment of Diesel Exhausts, Springer, 2014, pp. 221–246 Search PubMed.
- Z. Liu, Y. Yi, J. Li, S. I. Woo, B. Wang, X. Cao and Z. Li, Chem. Commun., 2013, 49, 7726–7728 RSC.
- Z. Liu, S. Zhang, J. Li, J. Zhu and L. Ma, Appl. Catal., B, 2014, 158–159, 11–19 CrossRef CAS PubMed.
- C.-H. Lin and H. Bai, Appl. Catal., B, 2003, 42, 279–287 CrossRef CAS.
Footnote |
| † Electronic supplementary information (ESI) available. See DOI: 10.1039/c5ra04940g |
|
| This journal is © The Royal Society of Chemistry 2015 |
Click here to see how this site uses Cookies. View our privacy policy here.