Orientation textures of crystallographic habit planes in the welded joint of an aluminium–lithium alloy prepared by Nd:YAG laser welding
Xiaokun Yuan*a,
Li Cuia,
Yuan Jib,
Xuehong Zhanga and
Jie Zhuc
aCollege of Materials Science and Engineering, Beijing University of Technology, Beijing 100124, China. E-mail: yuanxiaokun@bjut.edu.cn; Fax: +86 10 67396260; Tel: +86 10 67396260
bInstitute of Microstructure and Property of Advanced Materials, Beijing University of Technology, Beijing 100124, China
cState Key Laboratory for Advanced Metals and Materials, University of Science and Technology Beijing, Beijing 100083, China
First published on 3rd July 2015
Abstract
In the joint of a 5A90 aluminium–lithium alloy prepared by Nd:YAG laser welding, the crystallographic habit planes are preferentially textured at different locations, and such anisotropic distribution of habit planes suggests a potential perspective to understand the crystallographic orientation dependent performance of the welded joint structure.
The aluminium–lithium (Al–Li) alloys, for example, the 5A90 Al–Li alloy studied in the current work, are significantly lighter than aluminium itself since lithium is the least dense elemental metal and therefore, alloying with lithium could effectively reduce structural mass and provide an elastic modulus advantage, which in turn could result in appreciable improvement of both strength and stiffness of the alloys.1,2 Accordingly, Al–Li alloys are specifically of interest to the current aircraft and aerospace industries, and in particular, joining of such alloys is a significant issue to provide both weight superiority and cost benefits.3 Therefore, the prospective features of Al–Li alloys in aeronautic and astronautic applications promote the necessity to radically investigate the welded joint structure and its connections to the joint performances,4 such as the stability and corrosion resistance.
Conventional fusion welding methods could engender several demerits including a larger heat-affected zone (HAZ), increased porosity, higher residual stresses, lower tensile strength, and weaker age-hardening effects at both HAZ locations and fusion zones.5 Recently, the laser beam welding technique of Al–Li alloys has attracted rapid-increasing attentions since a laser as a highly localized heat source could produce narrower HAZ and lower residual stress, and as a typical laser beam welding technique, the Nd:YAG method has shown broader virtues in various aluminium alloys.6,7
During Nd:YAG laser welding of 5A90 thin sheets, the microstructure of the joint alters significantly as a result of the coupled effects of heat and deformation, which could strongly affect the final performance of the joint structure.8 As a principal description of the microstructure, orientation textures of both grains and boundary planes are significantly concerned: the orientation texture of grains can be routinely characterized via electron backscattered diffraction (EBSD) technique;2 moreover, the orientation texture of boundary planes, which quantitatively describes the type and frequency of crystallographic boundary planes, can be implemented via the stereological approach namely “five-parameter analysis (FPA)” method, whose validity has been widely reported.9–14 Therefore, by virtue of the FPA method, the major objective of the present work is to study the orientation textures of crystallographic habit planes at different locations in the joint of a 5A90 aluminium alloy prepared by the Nd:YAG laser welding method, which in turn provide more comprehensive specifications about the microstructure of the joint and hence increase beneficial knowledge of the connection between the microstructure and the performances.
The 5A90 Al–Li alloy used in the current work is provided by the Southwest Aluminium Co., Ltd, China. Sheets of 3.0 mm thickness in the T8 temper condition (solution annealed, cold worked, artificially aged) are used in this study. The welding specimens were chemically removed 0.2 mm thickness from each side using 10–20% NaOH solution, and then were immersed in 20% nitric acid solution prior to the polishing.
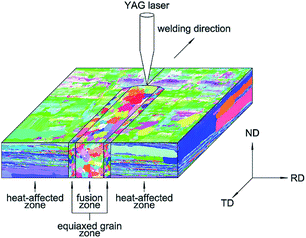
The specimens were then welded using a continuous wave Nd:YAG laser with maximum laser power 4.5 kW to obtain full penetration in butt-joints. A 150 mm focal length lens was employed to focus the beam on the specimen surface. The laser power was 1.8 kW and the weld speed was 45 mm s−1. An argon cover gas at a flow rate of 20 L min−1 was used to shield the weld from the atmosphere during welding (see Fig. 1 for scheme).
The sample for EBSD analysis was removed from cross sections namely RD–ND plane, and was treated by metallographic polishing with diamond and etching in Kroll reagent, which yielded surfaces suitable for EBSD mapping. The EBSD measurements were performed by using the high speed detector (EDAX Genesis 2000 system) incorporated in a thermal field scanning electron microscope (SEM, JOEL 6500F). To ensure the accuracy of the measurements, the data were collected with a step size of 1 micron.
The observations needed for the FPA analysis are line segments that are extracted from the orientation maps and are associated with the crystal orientations. Using the FPA method, the relative areas of different types of grain boundaries are described by the grain boundary plane distribution (GBPD), λ(Δg,n), which is defined as the relative area of a grain boundary with a misorientation, Δg, (described by three spherical parameters or three Eulerian angles), and boundary plane normal, n, (described by two extra independent spherical parameters), in units of multiples of a random distribution (abbreviated as MRD, and similarly hereinafter);9–14 the most frequent boundary type is determined by comparing the GBPD at specific misorientations, and the outcome is plotted on a stereographic projection. In the current work however, the GBPD is averaged over all misorientation; that is to say, the current work merely concerns the λ(n) which represents the distribution of habit planes in the crystal frame of reference;8,15,16 in this situation, the distribution of habit planes is parameterized as the area of boundary planes with plane normal, n, regardless of misorientation parameters, Δg. For the cubic symmetries, the FPA method requires 5 × 10⁴ line segments for the λ(Δg,n) analysis and only needs 2 × 10³ line segments for the λ(n) analysis.9 Each GBPD analysis in this work contains enough line segments and therefore can be regarded as reliable. The GBPDs were calculated using stereological programs developed at Carnegie Mellon University, and the details are described in previous references.9–16
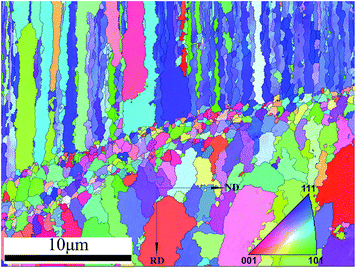
The microstructure of the sample is depicted by the inverse pole figure (IPF) map in Fig. 2, where the grain colour specifies the orientation according to the colouring indicated in the orientation legend for the cubic symmetry. The images illustrate that on the RD–ND plane, the HAZ (with a lamellar structure) and the fusion zone (with a relative equiaxial structure) can be clearly observed; moreover, the equiaxed zone (EQZ, with a relative equiaxial structure and with relative smaller grain sizes) between the HAZ and the fusion zone can also be easily observed.
 | ||
| Fig. 2 Inverse pole figure map for a selected joint structure (containing the HAZ, the EQZ, and the fusion zone); with orientation legend for the cubic symmetry. | ||
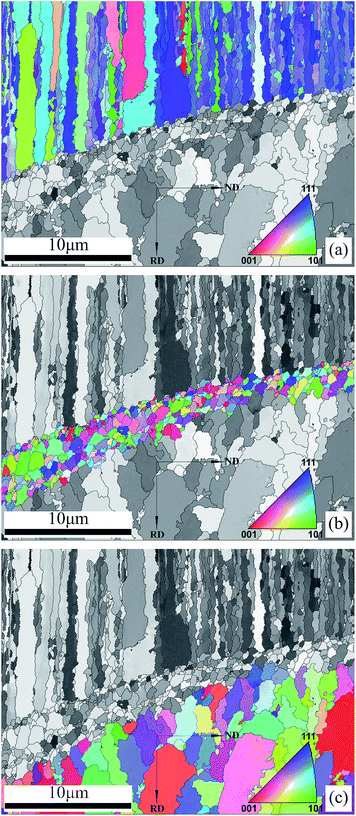
To facilitate the GBPD analysis, grains belong to the HAZ, the EQZ and the fusion zone were artificially sorted out and the outcomes are illustrated in Fig. 3 respectively. The images in Fig. 3 clearly illustrate that the Nd:YAG laser welding has significantly affected the homogeneity of the microstructure of the joint: for the HAZ (see Fig. 3a), grains are differently distorted at various locations; for the EQZ (see Fig. 3b), the curvature of the zone mainly results from the low heat input and high cooling rates experienced in laser welds;2 and for the fusion zone (see Fig. 3c), the span length is between 3.0 to 3.5 mm along the RD direction. Based on these phenomena, in the HAZ and the fusion zone, only grains close to the EQZ (within 200 μm) were selected to ensure the accuracy of the GBPD analysis. As a result, 37![[thin space (1/6-em)]](https://www.rsc.org/images/entities/char_2009.gif) 285 line segments were extracted from the HAZ, 8049 line segments were extracted from the EQZ, and 17
285 line segments were extracted from the HAZ, 8049 line segments were extracted from the EQZ, and 17![[thin space (1/6-em)]](https://www.rsc.org/images/entities/char_2009.gif) 286 line segments were extracted from the fusion zone.
286 line segments were extracted from the fusion zone.
 | ||
| Fig. 3 Inverse pole figure map for a selected joint structure: (a) the HAZ, (b) the EQZ, (c) the fusion zone; with orientation legend for the cubic symmetry. | ||
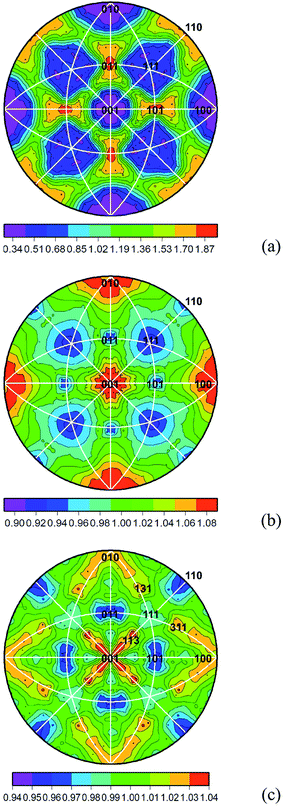
Then, for the extracted line segments, the GBPDs, λ(n), which are averaged over all misorientation, are plotted in the crystal reference frame in Fig. 4 to show the relative areas of habit planes. In Fig. 4, values greater than one MRD indicate that the total area associated with a specific habit plane is larger than the area that would be expected in a random distribution, and values less than one MRD are associated with specific habit planes whose total areas are less than the area that would be expected in a random distribution. In the HAZ, the most frequently occurred habit plane is {110} with a relative area 87% higher than that in the random distribution, the {111} plane is 32% lower than that in the random distribution, and the {100} plane is 66% lower than that in the random distribution (see the MRD bar in Fig. 4a). (The GBPD result for the HAZ is quite different from that of the 5A90 thin sheets prior to the welding, in which the {111}, {100} and {110} orientations occur 41%, 7% and −35% more frequent than the random distribution respectively, indicating that the Nd:YAG laser welding has severely altered the original distribution of crystallographic habit planes at HAZ locations.) In the EQZ, the most frequently occurred habit plane is {100} with a relative area 8% higher than that in the random distribution, the {110} plane is 6% lower than that in the random distribution, and the {111} plane is 8% lower than that in the random distribution (see the MRD bar in Fig. 4b). In the fusion zone, the most frequently occurred habit plane is {100} with a relative area 4% higher than that in the random distribution, and with spreads along the zone axes towards the positions of {311} planes, which means that habit planes deviated from 0° to 25.24° by referring to the {100} planes occur with nearly the same frequency of {100} planes; besides, the {111} plane is 1% lower than that in the random distribution, and the {110} plane is 4% lower than that in the random distribution (see the MRD bar in Fig. 4c).
The misorientation averaged GBPD analysis on the RD–ND plane highlights that the distribution of the habit planes in the laser-welded joint is spatially inhomogeneous (similar results have been obtained on RD–TD plane, but are not included in the current work). Recent researches have indicated that the population of grain boundary planes is generally inversely correlated to the grain boundary energy.10–14 Particularly, for the aluminium alloys, the (111) surface has the lowest energy, (110) has the highest, and (100) is intermediate, and the total energy anisotropy is within 15%.17 Considering this, the observed GBPDs in the current work imply that grains at different locations did not undergo normal growth during laser welding; meantime, they could also suggest the intimate connection between the anisotropy of grain boundary energy and the performances of the joint structure.
For the HAZ (see Fig. 4a), grains close to the EQZ were selected and for these grains, crystallographic planes are more frequently terminated by {110} planes than any other orientations, and the occurring frequency of the {110} planes (1.87 MRD) is 5.5 times higher than the occurring frequency of the {100} planes (0.34 MRD); that is to say, the total anisotropy of the habit plane occurring frequency (abbreviated as TA-HPOF, and similarly hereinafter) is within 450% (compare 1.87 MRD with 0.34 MRD). However, since (110) plane has the highest energy,17 it should occur with a frequency lower than those of (100) and (111) planes; therefore, the GBPD result of the HAZ that is not consistent with the boundary energy tendency might suggest degraded performance of the joint structure at HAZ locations: the prevalent distribution of high-energy {110} planes would lead to a more reactive state, and the HAZ locations would thus be more sensitive to the corrosion, and the decreased corrosion resistance at these locations would in turn induce cracks which would abate the performance if the joint is under load conditions.18
For the EQZ (see Fig. 4b), the maximum distribution of the habit planes is at {100} positions, and the minimum distribution of the habit planes is at {111} positions, and accordingly, the TA-HPOF is within 20% (compare 1.08 MRD with 0.90 MRD). Note that the (100) surface has higher energy than that of (111) surface17 and therefore, the EQZ is overall not in a steady state that would be determined by the surface energy relationship. In the current work, since EQZ has the narrowest width along the RD direction (see Fig. 3), it can then be speculated that the effective control of the EQZ width during laser welding would be beneficial to the higher performance of the joint structure.
For the fusion zone (see Fig. 4c), the GBPD outcome indicates that crystallographic planes with highest occurring frequencies have multiple occurring planes which include both {100} planes themselves and planes deviated from 0° to 25.24° by referring to the {100} planes. This phenomenon therefore might imply that during laser welding, the initial preferential distribution of the habit planes in the original thin sheets has been transferred into dozens of crystallographic planes that share common zone axes with {100} planes. Therefore, although the TA-HPOF is merely within 11% (compare 1.04 MRD with 0.94 MRD) in the fusion zone, the broad and high-populated distribution of low indices planes close to the {100} positions10 (and therefore might not have low surface energy) might indicate the reduced performance at the fusion zone locations. Actually, our parallel experimental work has revealed that on the RD–ND plane, there is 21.4% reduction of microhardness from the HAZ to the fusion zone.
We should present an overall analysis about the welded joint structure. The MRD bars in Fig. 4 illustrate the TA-HPOF, which might be used as the proxy of the shape anisotropy. For the HAZ, the TA-HPOF is within 450%, which indicates that the crystallographic planes are terminated by various habit planes in a wide MRD range (which would present explicit shape anisotropy), and this is consistent with the lamellar structure of the HAZ (see Fig. 3a). For the EQZ and fusion zone, the TA-HPOF is within 20% and 11% respectively; that is to say, grains in the EQZ and fusion zone should present less shape anisotropic features (correspond to more equiaxed morphologies, which can be observed in Fig. 3b and c). Therefore, how the Nd:YAG laser welding affects the homogeneity of the joint structure can be quantitatively described. Particularly, the intermediate TA-HPOF value of the EQZ suggests that the EQZ could be regarded as the transition region between the larger shape anisotropy (in the HAZ) and the smaller shape anisotropy (in the fusion zone). Furthermore, the transitional role of the EQZ might also be reflected in the energy anisotropy: the {111} planes do not occur with the highest frequencies in the HAZ, the EQZ and the fusion zone, and therefore, these local regions should not be treated as completely stable; however, the HAZ displays major energy anisotropy at {110} positions (see Fig. 4a), while the EQZ and the fusion zone both present major energy anisotropy at {100} positions (see Fig. 4b and c, which indicate that the energy anisotropy in EQZ is relatively similar to that in the fusion zone). We therefore surmise that the evolution of the EQZ might be bilaterally determined by the energy anisotropy in the HAZ and the fusion zone. Therefore, optimization the transitional role of the EQZ (between the HAZ and the fusion zone) could be a possible approach for fine-tuning the joint performances.
Conclusions
By virtue of the misorientation averaged FPA analysis, study of the habit plane distribution in the joint of a 5A90 aluminium–lithium alloy prepared by the Nd:YAG laser welding leads to the following conclusions: the distribution of the habit planes in the laser-welded joint is spatially inhomogeneous, and different low indices habit planes are preferred at different locations. The HAZ and the fusion zone are not in an energy stable state, and the EQZ could be regarded as the transition region of both shape anisotropy and energy anisotropy between the HAZ and the fusion zone. The current work therefore presents a beneficial alternative to understand the crystallographic orientation dependent performances of the laser-welded structure.Acknowledgements
Li Cui acknowledges supports from the National Natural Science Foundation of China 51475006. Xiaokun Yuan acknowledges supports from the National Natural Science Foundation of China 51471007 and the State Key Lab of Advanced Metals and Materials 2013-Z01. Xiaokun Yuan truly appreciates Prof. Gregory S. Rohrer (Department of Materials Science and Engineering, Carnegie Mellon University, USA) for giving important insights, and appreciates Dr Zhixue Qu for sharing fruitful discussion, and appreciates Dr Yuntao Lei for providing kind help to this work, and thanks Dr Hongmei Xu for presenting linguistic assistantship.Notes and references
- J. R. Pickens, J. Mater. Sci., 1990, 25, 3035 CrossRef CAS.
- L. Cui, X. Y. Li, D. Y. He, L. Chen and S. L. Gong, Mater. Charact., 2012, 71, 95 CrossRef CAS PubMed.
- A. Steuwer, M. Dumont, J. Altenkirch, S. Birosca, A. Deschamps, P. B. Prangnell and P. J. Withers, Acta Mater., 2011, 59, 3002 CrossRef CAS PubMed.
- H. Ovri and E. T. Lilleodden, Acta Mater., 2015, 89, 88 CrossRef CAS PubMed.
- G. Padmanabham, S. Pandey and M. Schaper, Sci. Technol. Weld. Joining, 2005, 10, 67 CrossRef CAS PubMed.
- M. F. Lee, J. C. Huang and N. J. Ho, J. Mater. Sci., 1996, 31, 1455 CrossRef CAS.
- S. T. Wei, C. Y. Hao and J. C. Chen, Mater. Sci. Eng., A, 2007, 452, 170 CrossRef PubMed.
- X. K. Yuan, K. Y. Gao, G. S. Rohrer and X. Y. Fang, Adv. Eng. Mater., 2014, 16, 1105 CrossRef CAS PubMed.
- D. M. Saylor, B. S. El-Dasher, B. L. Adams and G. S. Rohrer, Metall. Mater. Trans. A, 2004, 35, 1981 CrossRef.
- D. M. Saylor, B. S. El-Dasher, A. D. Rollett and G. S. Rohrer, Acta Mater., 2004, 52, 3649 CrossRef CAS PubMed.
- J. Li, S. J. Dillon and G. S. Rohrer, Acta Mater., 2009, 57, 304 Search PubMed.
- G. S. Rohrer, J. Mater. Sci., 2011, 46, 5881 CrossRef CAS.
- G. S. Rohrer, J. Am. Ceram. Soc., 2011, 94, 633 CrossRef CAS PubMed.
- H. Beladi, G. S. Rohrer, A. D. Rollett, V. Tari and P. D. Hodgson, Acta Mater., 2014, 63, 86 CrossRef CAS PubMed.
- G. S. Rohrer, D. M. Saylor, B. S. El-Dasher, B. L. Adams, A. D. Rollett and P. Wynblatt, Z. Metallkd., 2004, 95, 197 CrossRef CAS.
- X. K. Yuan, G. S. Rohrer, X. Y. Song, H. Chien and J. Li, Int. J. Refract. Met. Hard Mater., 2014, 44, 7 CrossRef CAS PubMed.
- R. S. Nelson, D. J. Mazey and R. S. Barnes, Philos. Mag., 1965, 11, 91 CrossRef CAS PubMed.
- S. H. Kim, U. Erb and K. T. Aust, Scr. Mater., 2001, 44, 835 CrossRef CAS.
| This journal is © The Royal Society of Chemistry 2015 |


