Delamination of graphite in a high pressure homogenizer†
T. J. Nacken,
C. Damm,
J. Walter,
A. Rüger and
W. Peukert*
Institute of Particle Technology (LFG), Friedrich-Alexander University Erlangen-Nürnberg (FAU), Cauerstrasse 4, 91058 Erlangen, Germany. E-mail: wolfgang.peukert@fau.de; Tel: +49-9131-85-29401
First published on 23rd June 2015
Abstract
A scalable industrial method for graphene and Few-Layer-Graphene (FLG) production by graphite delamination in N-methylpyrrolidone and water–surfactant mixtures using a high pressure homogenizer is presented. This paper is focused on processing conditions and extensive subsequent analysis of the delaminated products by a combination of analytical ultracentrifugation, UV/Vis and statistical Raman spectroscopies including co-localization with atomic force microscopy. In this way quantitative processing-structure–property correlations showing how suspension properties and processing parameters governing yield, quality and lateral dimension of the produced graphene are obtained. It is found that a high pressure homogenizer can be used to obtain sufficiently high concentrated FLG suspensions with low defect concentration.
Introduction
Graphene is a 2D-sheet material consisting of a one atomic layer of sp2-hybridized carbon. Since its first discovery graphene has become one of the most investigated materials in the new millennium, because of its outstanding physical properties, e.g. ballistic electron transport and high charge carrier density.1–8 Within the last decade different graphene production methods have been established. These methods can be divided into bottom-up (e.g. chemical vapor deposition) and top-down approaches, namely ultrasonication,9–11 dry or wet planetary ball milling,12–15 stirred media delamination16–18 and high shear-mixing in rotor–stator devices19–21 in either organic solvents or water–surfactant mixtures. Today, even combination of techniques is known, e.g. planetary ball milling or microwave treatment and subsequent ultrasonication.14,22 Furthermore large-scale production of graphene oxide like compounds in aqueous media is possible by electrochemical graphite exfoliation.23 Drawbacks of graphene production by ultrasonication and planetary ball milling techniques are limited scalability, long processing times and therefore low production rates.In this paper an industrial high pressure homogenizer (HPH) is used as delamination device for delamination of graphite suspensions. This method is simple, scalable and does not require toxic chemicals, graphite oxidation or ultrasound post-processing to achieve exfoliation. Moreover, due to residence times in the nozzle <1 s HPH provides mild exfoliation conditions which helps to avoid defect formation. HPH devices are commonly used in food industry, cell disintegration,24 emulsification25,26 or dispersion of active pharmaceutical ingredients.27,28 Recently, HPH devices were employed for graphene production by exfoliation of thermally reduced graphite oxide. The produced graphene dispersions were used for manufacturing graphene films by printing techniques or for preparation of graphene nanocomposites with superior mechanical and electrical properties.29–31 Processing of unmodified graphite by HPH, however, did not yield stable graphene suspensions.31 Yi et al. showed the feasibility of delamination by HPH for unmodified graphite and other layered materials and investigated the influence of feed concentration and processing time on yield and morphology of the product.32–35 Moreover, Yi et al. demonstrated 10 L batch graphene production by a jet cavitation method and obtained few layer graphene with low defect concentration.36 The processing time, however, was quite long (8 h).36 In this paper we report an environmental friendly method for graphene production in large quantities (5 L batches) in processing times <3 h by top-down processing of isostatic and unmodified graphite in an industrial high pressure homogenizer. In contrast to the device used by Yi et al. our device allows a simple control of the nozzle pressure by adjusting the flow rate and a controlled suppression of cavitation by applying a counter pressure. The graphite delamination process is performed in aqueous dispersions of the non-ionic surfactant TWEEN®80 (TW80) as an inexpensive, non-toxic and therefore environmental friendly dispersing medium. We selected TW80 as surfactant because according to preliminary studies for the used graphite it gave the best exfoliation result amongst the investigated commercial surfactants. We further focused on advanced analytical methods to study the influence of processing conditions on yield and quality of the product in detail. Usually exfoliated graphene sheets are analyzed by Transmission Electron Microscopy (TEM) and/or Atomic Force Microscopy (AFM). In TEM, however, only a few μm2 of the sample area are investigated and flakes with very small lateral dimensions can get lost during sample preparation because of using holey grids as sample supports. AFM gives a more representative image of the flake size distribution than TEM because larger sample areas can be scanned and there is no loss of any particle size fraction during sample preparation. The measured flake height, however, is influenced by adsorbed surfactant and the sample preparation/washing procedure. Thus, we focus on statistical Raman spectroscopy which is less influenced by adsorbed surfactants and allows investigation of a large sample area (≥3600 μm2). Further, statistical Raman spectroscopy is combined with AFM and also with analytical ultracentrifugation (AUC) to get a highly detailed picture of the product quality regarding delamination degree, particle size distribution and defects.
Statistical analysis of more than 1300 individual Raman spectra per sample provides representative insight into the product quality distribution with respect to in-plane defects, degree of delamination (flake thickness) and lateral flake dimension.17,18,37,38 In addition, AUC provides detailed insights into the sedimentation behaviour of the obtained platelet suspensions and allows the determination of lateral dimensions directly in solution, if the flake height is known.39
Experimental
Materials
The unmodified isostatic graphite GSI70 (RMC Remacon GmbH, Germany) was used as feed material for the delamination experiments. It has a purity >99.5% and a median particle size x50,3 of 15–20 μm (measured by the supplier using a Cilas particle sizer 920). In addition the unmodified natural graphite “GNP6” (RMC Remacon GmbH, Germany) was used to demonstrate transferability to a different feed material. It has a purity >99.5% and a median particle size x50,3 of 3.5 μm (measured by the supplier using a Cilas particle sizer 920). In standard suspensions the non-ionic surfactant TWEEN®80 (TW80) (Sigma-Aldrich GmbH, Germany) was used and for transferability the anionic surfactant sodium dodecyl sulfate (SDS) (Sigma-Aldrich GmbH, Germany) was used to prevent agglomeration of the graphene particles obtained by graphite delamination in water. N-Methylpyrrolidone (NMP) was purchased from Merck with a purity >99.5%. All materials were used as supplied without further purification. Deionized water was used for preparation of all graphite suspensions.Delamination experiments
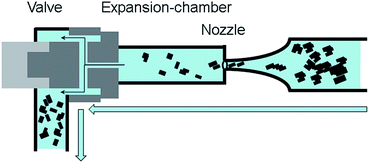
For delamination experiments graphite suspensions in aqueous solutions of the surfactant TW80 or SDS were prepared. All delamination experiments were carried out in a high pressure homogenizer “Economic Dispersionizer Omega®60” (Netzsch Feinmahltechnik GmbH, Germany). In this device the graphite suspension is pumped through a nozzle with a defined flow rate to adjust the system pressure. The principle of high pressure homogenization is shown schematically in Fig. 1.The Omega®60 is equipped with a 15 L double walled stirred tank connected with a thermostat for feed suspension holdup and cooling. Inside the tank the suspension was stirred with 1000 rpm using a blade stirrer for pre-homogenization. Processing can be performed in continuous mode or batch mode. For the presented study only the batch mode was chosen. The pressure was varied in the range from 10 to 70 MPa by adapting the flow rate through the nozzle with a diameter of around 240 μm.
The batch mass was kept constant at 5 kg for each experiment. Graphite feed suspensions were prepared in two steps. First the desired amount of surfactant was dissolved in water to adjust the targeted surfactant concentration. 4.95 kg of the water surfactant mixture were transferred to the feed tank of Omega®60 and stirred for cooling until 18 °C was reached. In the second step the desired amount of graphite powder (50 g) was added into this tank under stirring for pre-dispersing. For each pressure the graphene production was followed over six batch runs.
Samples for subsequent analyses were taken after each batch run and centrifuged using a “Centrifuge Sigma 3-30KS” (Sigma GmbH, Germany) to remove not yet delaminated feed particles from the suspensions prior to further characterization. The used centrifugation conditions correspond to a “cut size” for sedimentation of a sphere-equivalent diameter of 400 nm (see ESI†). The cut size is calculated using the Stokes equation (ESI†). It is used instead of the commonly used time and rotational speed for centrifugation to show clearly which particle sizes are separated from the product. Post-processing is a crucial step that deserves more attention, also compare Damm et al.17 and Nacken et al.18
Product characterization
Statistical Raman spectroscopy was performed by creating a square shaped map with spacing of 1.4 μm between two adjacent data points in each x- and y-direction. In this way overlap of data points is prevented. At each point a Raman spectrum was taken. In this work Raman maps spanning a minimum square of 60 × 60 μm2 equal to 1369 points or 70 × 70 μm2 equal to 2601 individual points were recorded. For evaluation the D-, G- and 2D-Raman peaks were fitted by single Lorentz-functions using the software LabSpec 6.3.39.2 to determine height and full width at half maximum (FWHM) of the peaks. Statistical evaluation was performed by analysis of all obtained Raman spectra with G-peak intensities >500 counts. Note: only statistics containing a minimum of 200 evaluated spectra are presented in this paper.
Sedimentation velocity data was acquired at 4000 rpm and 20 °C in water. The solvent density was 998.3 kg m−3 and the viscosity was 1.003 mPa s. Intensity data was recorded for all chambers individually and was converted after the experiment to absorbance data using the region above the sample's meniscus (air-region) in the measurement cell. The absorbance data at 400 nm was fitted to the least-square based ls-g*(s) direct boundary distribution model using Sedfit 14.1. The apparent and not diffusion corrected sedimentation coefficient distribution g*(s) is obtained by fitting the data to the direct solution of the radial and temporal concentration profile in the measurement cell.42 The data were fitted with a second derivative regularization, a resolution of 100 grid points and fitting ranges of 10 to 120![[thin space (1/6-em)]](https://www.rsc.org/images/entities/char_2009.gif) 000 sved (1 sved equals 10−13 seconds) depending on the sample. Time-independent, radial invariant noise, as well as meniscus positions were fitted.
000 sved (1 sved equals 10−13 seconds) depending on the sample. Time-independent, radial invariant noise, as well as meniscus positions were fitted.
Lateral size distributions were obtained from the sedimentation coefficients applying the methodology presented previously.39 Since no exact material parameters exist or could be measured for TW80 stabilized few-layer-graphene, we estimated these values allowing for a rough approximation of the lateral sizes. A density of 2000 kg m−3 was used for the graphene layers and the density of the shell was estimated to be equal to the solvent density. The graphene layer thickness used for the calculations was 1 nm for 1-layer graphene, 2.4 nm for 3-layer graphene and 3.8 nm for 5-layer graphene. An enlarged shell thickness of 1.8 nm, taking into account the stabilizer bound to the graphene surface, was used for all calculations.
Results and discussion
Production yield vs. processing parameters
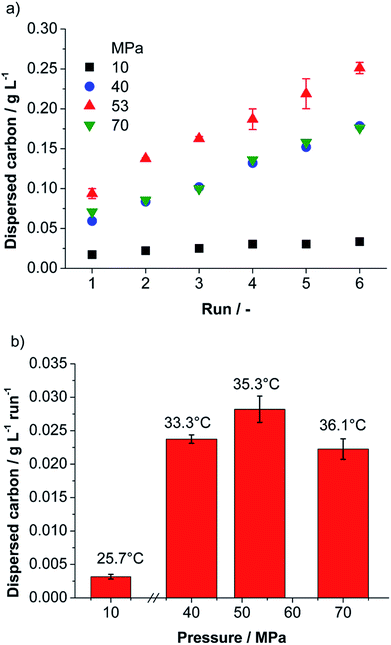
The first important information for any technically relevant production method is the obtained mass of product and the related production rate. To calculate the concentration from the UV/Vis-absorbance using the Lambert–Beer law the extinction coefficient for the material must be known. In literature (for λ = 660 nm) different values for the extinction coefficient are found, which range from 1390–6600 L g−1 m−1 dependent especially on the product post-processing by centrifugation and production method.9,43,44 Thus, we determined the extinction coefficient for our material as described in the ESI† and obtained a value of 1028 L g−1 m−1 (±83 L g−1 m−1). Applying the found extinction coefficient, the dispersed carbon concentration was determined for each processing parameter by measuring the absorbance at 660 nm. Evaluation of preliminary experiments via UV/Vis-spectroscopy showed that the non-ionic surfactant TW80 is a better stabilizer for carbon than the anionic surfactant SDS (see ESI†). Thus, TW80 was selected as stabilizing agent. The best carbon dispersing performance was observed for a suspension containing 1 wt% of graphite and 0.5 wt% of surfactant in water (total mass 5 kg). These standard suspensions were processed at different total pressures in the range from 10–70 MPa for 6 runs in batch mode. For all pressures investigated the dispersed carbon concentration increases linearly with the number of batch runs hinting for a continuous and homogenous delamination process (compare Fig. 2a).The dispersed carbon concentration increases with higher nozzle pressure and reaches a maximum at 53 MPa (see Fig. 2). The maximum dispersed carbon concentration obtained was 0.251 g L−1 after 6 runs and a related average concentration increase of 28.2 mg L−1 per run was achieved. For an increase of pressure from 53 to 70 MPa, however, a drop of concentration by roughly 20% is observed (see Fig. 2).
In the following we discuss possible delamination mechanisms to give an explanation for these results. Yi et al. investigated the delamination of hexagonal BN, graphite and other layered materials in a high pressure nozzle experimentally and by Computational Fluid Dynamics (CFD) simulations and found that Reynolds shear stress, normal forces due to pressure release, particle–particle collisions and cavitation all contribute to the delamination.34,35 In our case the basic mechanisms should be similar although their relative importance might be shifted due to different nozzle geometries. A quantitative determination of the contributions of the different mechanisms to the delamination result would require an exact fluid mechanical analysis of the suspension flow in the HPH device. This is, however, beyond the frame of this paper, because here we focus on careful analysis of the obtained delaminated products. Thus, the discussion is limited to qualitative aspects of possible delamination mechanisms. We estimated the Reynolds number as function of flow rate for a nozzle diameter of 240 μm and found that the Reynolds number is always >10![[thin space (1/6-em)]](https://www.rsc.org/images/entities/char_2009.gif) 000, i.e. a fully turbulent flow prevails. A higher nozzle pressure is directly coupled to higher flow rates and therefore to higher Reynolds numbers. The observed highly efficient delamination is in accordance with Liu et al.,21 Paton et al.19 and Varrla et al.20 who found for rotor–stator devices efficient graphite delamination for shear rates >10
000, i.e. a fully turbulent flow prevails. A higher nozzle pressure is directly coupled to higher flow rates and therefore to higher Reynolds numbers. The observed highly efficient delamination is in accordance with Liu et al.,21 Paton et al.19 and Varrla et al.20 who found for rotor–stator devices efficient graphite delamination for shear rates >10![[thin space (1/6-em)]](https://www.rsc.org/images/entities/char_2009.gif) 000 s−1.
000 s−1.
Cavitation in a high pressure microchannel flow was investigated by micro Particle Image Velocimetry (μ-PIV) and by CFD simulations.45,46 Even for a pressure of only 5 MPa cavitation was observed by μ-PIV.44 Moreover, it was observed that cavitation increases with higher pressure.46 Thus, we expect that in the whole investigated nozzle pressure range cavitation contributes to graphite delamination, if no valve pressure is applied. In HPH cavitation can be suppressed by applying counter pressure. Gothsch et al. observed complete elimination of cavitation for a counter pressure of 16 MPa and a total pressure (nozzle pressure + counter pressure) of 52 MPa.46 The pressure ratio corresponds to a Thoma number of 0.31. The Thoma number is the ratio of the counter pressure to the total pressure. We performed graphite delamination experiments with applied counter pressure by closing the valve at the end of the expansion chamber and realized Thoma numbers up to 0.67. The probability of cavitation decreases with increasing Thoma number. If the Thoma number is varied and the total pressure is kept constant, almost the same product concentration was achieved. Thus, besides cavitation also other mechanisms must contribute remarkably to graphite delamination in the used HPH device.
The probability of graphite delamination due to self-lubricating by collisions between feed particles increases with the collision kernel and with the square of the number concentration of feed particles in the suspension. In all experiments the feed concentration was the same. Thus, the collision rate increases directly proportional to the collision kernel. In the ESI† we calculated the collision kernel for particles 20 μm in diameter (mean feed particle diameter) in turbulent flow. We found that the collision kernel and therefore the contribution of graphite delamination by self-lubrication increases by the factor of 3 if the nozzle pressure increases from 10 to 70 MPa, but the obtained product concentration increases by a factor of ∼10 (Fig. 2b).
This qualitative discussion of the different mechanisms shows that the efficiency of graphite delamination should increase continuously with growing nozzle pressure. Thus, for the highest nozzle pressure (70 MPa) the highest product concentration is expected. In contrast to our expectations the maximum of the dispersed carbon concentration was not observed at the highest pressure (70 MPa), but rather at an intermediate pressure of 53 MPa (see Fig. 2). A likely explanation can be given by taking agglomeration into account. Collisions between product particles or between a product and a feed particle can lead to agglomeration. As shown in the ESI† also for that case the collision kernel and therefore the probability of collisions increases with growing nozzle pressure. Moreover, an increase in nozzle pressure is related to a rise of temperature (see Fig. 2b). Elevated temperatures may lead to destabilization of the suspension against agglomeration and re-stacking by desorption of the physical adsorbed surfactant on the graphene surface,47 or even preventing the surfactant to adsorb on the graphene surface. The argument of enhanced agglomeration for processing with a nozzle pressure of 70 MPa is supported by results obtained for a cut size of 200 nm, see ESI.† For a cut size of 200 nm the dispersed carbon concentration increases with growing nozzle pressure and the highest concentration is obtained as expected for 70 MPa. A comparison of the results in Fig. 2 and S3 (ESI†) shows that at 70 MPa indeed a higher amount of fine product particles is formed, but there is a depletion of particle sizes between 200 and 400 nm. This can be explained by agglomeration of this size fraction and formation of agglomerate sizes >400 nm. Thus, these large particles are removed from the suspension during the centrifugation step (cut size = 400 nm), finally resulting in a lower found carbon concentration in suspension.
To investigate transferability of the results to different feed materials also unmodified natural graphite was processed instead of the unmodified isostatic synthetic graphite under optimized conditions (nozzle pressure 53 MPa, no valve pressure). We found for the natural graphite feed material slightly higher production rates compared to the synthetic isostatic graphite (see ESI†). We account this to a smaller mean feed grain size of 3.5 μm of the natural graphite compared to 15–20 μm mean feed size for the synthetic graphite. The total energy required for overcoming the van-der-Waals interaction and therefore for delamination increases with the surface area and therefore with the lateral dimension of the delaminated sheet. Thus, smaller flakes are easier to delaminate than larger ones.
Evaluation of product quality by statistical Raman spectroscopy
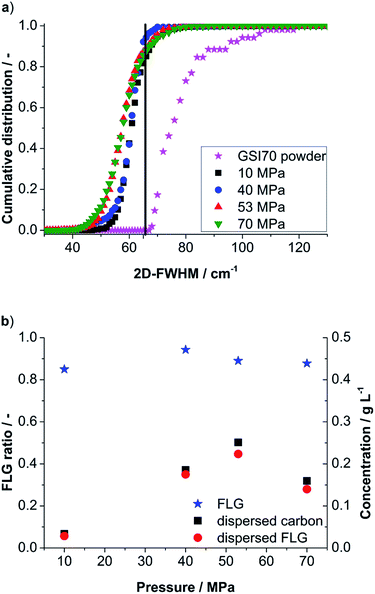
In previous studies we demonstrated for graphene production by stirred media delamination that processing parameters govern the obtained product quality and delamination behaviour. In particular, we found that the energy input influences the composition of the dispersed carbon phase, i.e. the content, layer thickness and quality of the delaminated flakes depend on the processing parameters.17,18 Therefore, FLG/SLG-yield and related defect characteristics of the samples processed by HPH have been determined by statistical Raman spectroscopy and are discussed in this section in dependence of process parameters.A typical Raman spectrum consists of three main peaks, i.e. a D-, G- and 2D-peak. For the evaluation, we focus on the intensity ratio of D/G and to the full widths at half maximum (FWHM) of the G- and 2D-peaks (G-FWHM and 2D-FWHM). The 2D-FWHM reflects the degree of delamination. Thus it can be used to distinguish between graphite (>66 cm−1, more than five layers of graphene), FLG (65–40 cm−1, 2–5 layers) and SLG (<40 cm−1, one layer of graphene).34,48–51 Note that the 2D-FWHM is enlarged by defects, edges and dopants so that the FLG and SLG contents derived from the 2D-FWHM distribution can be underestimated. However, as for graphene production large lateral dimensions and defect free product particles are of major importance, evaluation of the 2D-FWHM matches the purpose of determination of quality/degree of delamination.
The intensity ratio of the D- and G-peak (D/G ratio) increases inversely proportional to the measured graphite/graphene crystallite size La and is expressed by eqn (1) (Tuinstra–Koenig relation, Cλ is a wavelength dependent constant).52–54
 | (1) |
Cançado et al.55 have demonstrated how this ratio is also influenced by the defect density, i.e. the in-plane damage of a graphene layer, which generally leads to larger values for D/G with increasing number of defects per unit area (stage 1). For high defect densities the D/G ratio decreases, if the defect concentration is further increased (stage 2). To distinguish between the low defect region (stage 1) and the high defect region (stage 2) the G-FWHM has to be evaluated. Stage 1 is attributed to G-FWHM values of <30 cm−1 and stage 2 is attributed to G-FWHM >30 cm−1. A comprehensive picture of sample quality regarding delamination and defects is thereby based on a combined discussion of 2D-FWHM, G-FWHM and D/G ratio.
In the first step the influence of nozzle pressure (10–70 MPa) is evaluated for the final run (6) with respect to the 2D-FWHM cumulative distribution and yielded FLG-content (see Fig. 3a). Already for a nozzle pressure of 10 MPa a suspension of well delaminated particles with a FLG content of 85% was obtained. The maximum FLG content is found for 40 MPa with 94%. For 53 and 70 MPa, respectively, FLG contents of 89% and 88% are found. The 2D-FWHM distribution in Fig. 3a also demonstrates a higher content of small values of 2D-FWHM for increasing pressure indicating a higher degree of delamination up to single layer graphene. For 53 MPa ∼0.5% of the evaluated Raman spectra indicated single layer graphene (for typically graphene spectra see ESI†). Combining the FLG contents derived from 2D-FWHM distribution with the dispersed carbon concentration (see previous section Fig. 2) we obtain the FLG concentration (Fig. 3b). The highest FLG output after 6 runs was found for 53 MPa followed by 40 MPa with 0.223 g L−1 and 0.175 g L−1, respectively.
The FLG production rate is calculated from the FLG concentration achieved after 6 runs: the flow rate to generate a pressure of 53 and 40 MPa, respectively, was 48 and 40 L h−1. Thus, it requires 6.2 and 7.5 min per run, respectively, to process a batch volume of 5 L. Before each batch run the suspension was stirred in the holding tank for 15 min to cool it down to 18 °C. Therefore, one batch run at 53 and 40 MPa, respectively, takes 21.2 and 22.5 min and 6 runs require 130 and 135 min in total, respectively. Thus, the achieved FLG concentrations of 0.223 g L−1 (53 MPa) and 0.175 g L−1 (40 MPa), correspond to FLG production rates of 0.103 g L−1 h−1 (0.515 g h−1) and 0.078 g L−1 h−1 (0.390 g h−1). It is expected that the FLG production rate can be increased considerably by numbering-up. The supplier of the used HPH device also provides a machine with 4 parallel nozzles operating at the same pressures as the used device.
For ultrasound-assisted graphite exfoliation FLG concentrations of about 2 g L−1 were achieved which is about one order of magnitude higher in comparison with our method.56 However, a direct comparison is not possible as the post-processing by centrifugation has a remarkable influence on the yielded concentration for top down processing.17,18 Khan et al. centrifuged the suspension with lower relative centrifugal force than in this work and therefore more product remained dispersed.
Furthermore, because of small batch volumes and long process times for ultrasound processing, the FLG production rate of our method is at least one order of magnitude higher in comparison with ultrasound processing. The results from sonication-assisted graphite exfoliation show that the “solubility-limit” for FLG must be, however, much higher than the FLG concentration achieved in our work. Thus, we expect that we can increase the FLG concentration by either performing more batch runs or by increasing the graphite feed concentration.
The distribution of the number of graphene layers per particle can be determined from the 2D-FWHM distribution (compare Fig. 4a). According to (ref. 57–59) 2D-FWHM is inversely proportional to the number of graphene layers per particles. Thus, the number of layers per particle N can be calculated by eqn (2) from the data shown in Fig. 3a.
 | (2) |
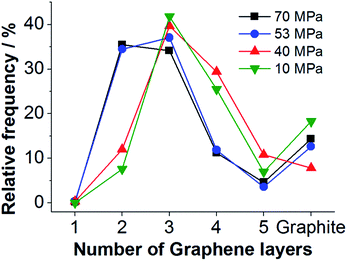 | ||
| Fig. 4 Distribution of the number of graphene layers per particle calculated from the obtained 2D-FWHM distribution for graphene suspensions processed by HPH at different nozzle pressures. | ||
Evaluation of the 2D-FWHM distributions shown in Fig. 3a by eqn (2) reveals that three-layer graphene is the main component of the FLG suspensions processed at lower pressures, see Fig. 4. In the samples processed with a nozzle pressure of 53 and 70 MPa, respectively, bilayers appear with a similar frequency as three-layers. Thus, for higher nozzle pressure a better degree of delamination is achieved.
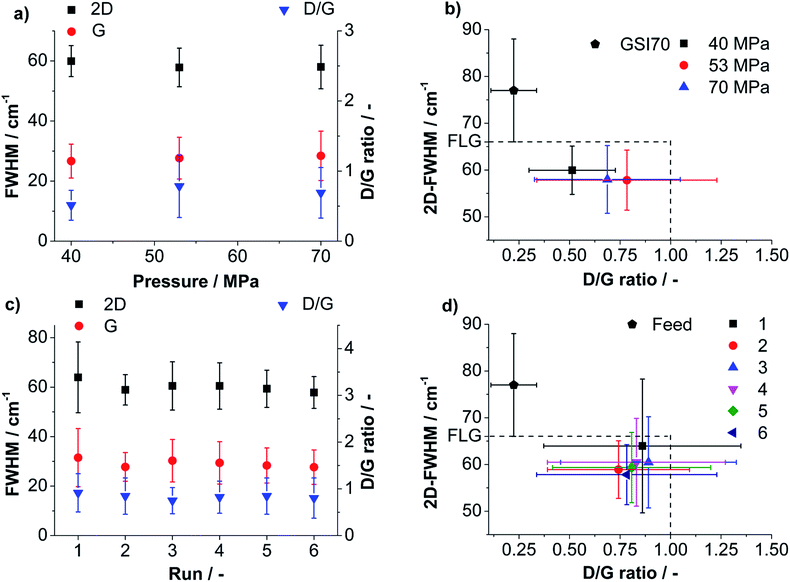
A detailed view on the influence of processing parameters on product yield and quality is provided by plotting the mean values of 2D-, G-FWHM and D/G against the pressure. For the processing conditions that lead to the highest FLG-yield (53 MPa) 2D-, G-FWHM and D/G are also plotted against the number of runs (compare Fig. 5a and c). 2D-FWHM decreases slightly for higher pressures indicating a better delamination. The mean G-FWHM is below 30 cm−1 for all applied pressures showing that the products are in the low defective region. The D/G ratio is always below 1 and reaches a maximum for 53 MPa emphasizing the lowest mean average lateral dimension, even lower than for 70 MPa (compare Fig. 5a). Note: values for D/G < 1 can be predominantly related to edge effects for G-FWHM values <30 cm−1.60,61 In Fig. 5c the development of 2D-FWHM, G-FWHM and D/G ratio over 6 runs is shown for a sample processed at 53 MPa. Fig. 5c illustrates that the values for G-FWHM and D/G ratio change only within the range of the obtained standard deviations. From the values for 2D-FWHM for higher number of runs a slight tendency for a better delamination can be seen. The process yields particles almost exclusively in the low defective regime.
For both, applied pressure and number of performed runs a property map, i.e. a plot of 2D-FWHM vs. D/G, was created to show clearly the influence of processing parameters on the yielded quality (compare Fig. 5b and d). Fluctuations of the values obtained for the six runs at 53 MPa pressure are within the standard deviations. Only a slide tendency of better delamination for a growing number of runs is observed, expressed by lower 2D-FWHM and lower D/G ratios (compare Fig. 5d). A comparison of Fig. 5b and d shows that the pressure has a larger influence on the product quality than the number of performed batch runs. Better delaminated, smaller particles are obtained for higher applied pressure as found by statistical Raman spectroscopy (also compare Fig. 3a and 4) showing a higher content of low 2D-FWHM values. Interestingly, the experiment performed with 70 MPa yielded larger particles compared to 53 MPa since Raman mapping showed a smaller D/G ratio accompanied by a similar G-FWHM. This finding corresponds well to the UV/Vis measurements. In agreement with UV/Vis measurements the process produces a high content of FLG particles whereby a slight improvement of the overall delamination with growing applied pressure is observed.
Morphology of processed particles
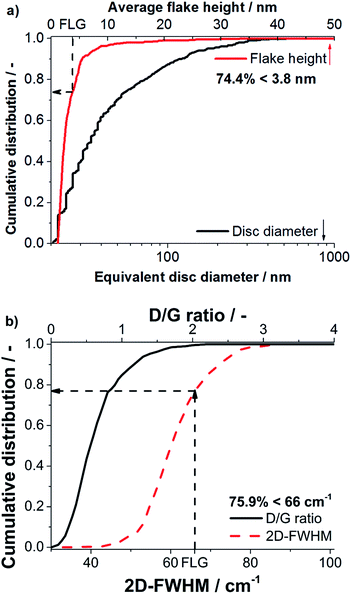
The degree of delamination derived from statistical Raman spectroscopy was validated by AFM, because it measures the flake thickness and lateral dimensions directly. As discussed in literature any residual surfactants on a graphene surface disturb AFM imaging.9,19 Only few molecules on the graphene particles can create considerable fluctuations of measured heights obtained in AFM. For this reason AFM investigation was performed on a sample processed in NMP, as good results in removal of NMP could be achieved. Processing was performed with a nozzle pressure of 53 MPa and without valve pressure at the standard concentration of 1 wt% GSI70. The obtained suspension (centrifuged to cut size = 400 nm) was analyzed by statistical Raman spectroscopy and AFM.A total of 7 AFM images, each spanning 5 × 5 μm2 were evaluated. 685 flakes were detected and a mean height of 2.4 nm was obtained over all flakes. Diameters obtained range from 20–580 nm with a mean equivalent disc diameter of 34.9 nm (see Fig. 6). The typical flake thickness for single layer graphene on an oxidized silicon wafer (300 nm SiO2-layer) is about 1 nm, the interlayer distance for 2 graphene layers is ∼0.35 nm and the intrinsic layer thickness is ∼0.34 nm yielding a step height of ∼0.69 nm per layer after the first layer.1,2 A measured height <3.8 nm thereby corresponds to FLG (≤5 layers). The FLG content was determined to be 74.4% as obtained by AFM imaging (see Fig. 6) with a mean number of three layers.
In excellent agreement to AFM, statistical Raman spectroscopy yields a FLG content of 75.9% proving that the FLG contents derived from statistical Raman spectroscopy are highly reliable. Moreover, for the sample processed in NMP statistical Raman spectroscopy yields a mean D/G ratio of 0.64 and G-FWHM of 29.3 cm−1 indicating that the flakes contain only few defects.
The obtained mean D/G ratio for the aqueous surfactant-based suspensions processed at 40–70 MPa ranged from 0.52–0.78. From the similar D/G values it can be concluded that the lateral diameter distribution of the NMP based sample should be in the same range as for the aqueous samples.
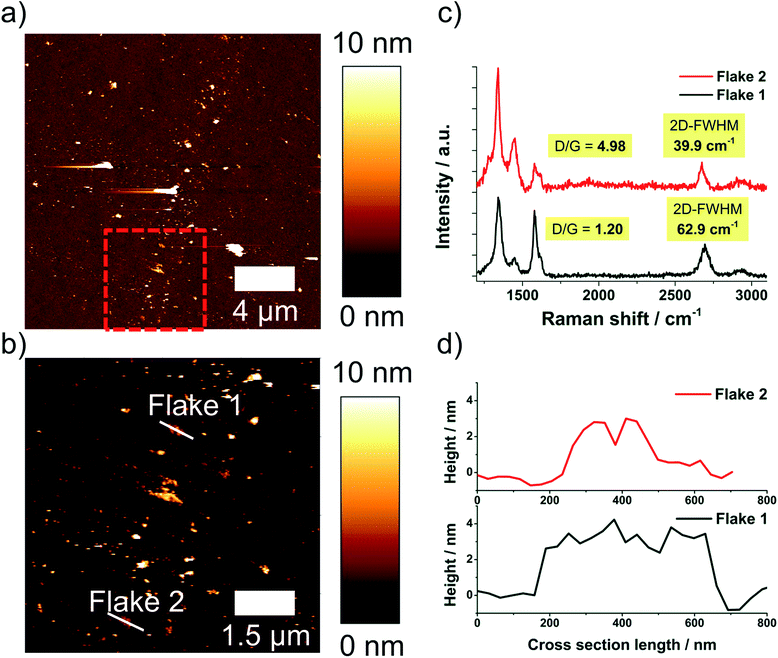
The sample processed in NMP with a nozzle pressure of 53 MPa was also investigated by AFM Raman spectroscopy co-localization, see ESI.† An advantage of this method is that height profile and Raman spectrum are measured exactly at the same position on the wafer. In Fig. 7 a survey AFM image, an enlarged section of this image and extracted height profiles and Raman spectra of selected flakes are shown.
The co-localized experiments yield an even higher FLG content (86.3%) in comparison to the independent AFM and Raman spectroscopic investigations (about 75% FLG), see ESI.† This result shows that Raman spectroscopy indeed gives a worst-case scenario regarding the FLG-content, e.g. the real product quality regarding delamination degree is even better than indicated by Raman spectroscopy alone.
Analytical ultracentrifugation
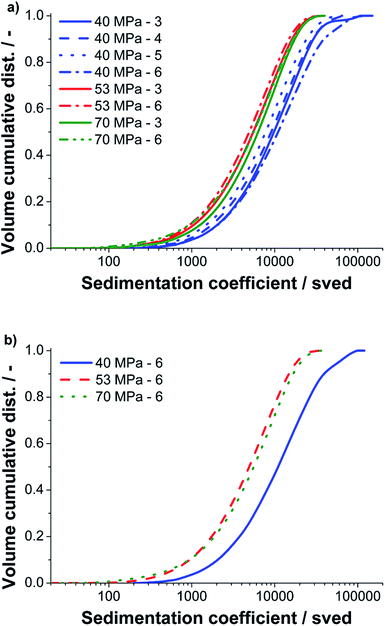
AUC-SV experiments were performed with supernatants of samples centrifuged to the standard cut size value of 400 nm to study their hydrodynamic properties. Due to its absolute measurement and fractioning principle, AUC provides highly accurate and quantitative information on the size of particles and is therefore perfectly suited to study complex and polydisperse samples in liquid media. As shown previously in a work on graphene oxide monolayers, the sedimentation coefficient distribution can be converted to a lateral size distribution in case of a constant sheet thickness.39 The major advantage of AUC is that the particle size is analyzed directly in solution. Therefore, no wafer preparation and potential related problems as drying/size exclusion effects are witnessed. For a first comparison of the different pressures and batch runs, we did not pursue such a conversion because a distribution of the number of graphene layers per particle is present in each sample. Instead we use the sedimentation coefficient distribution, which is the primary quantity of an AUC experiment to assess the morphology of the graphite structures. The sedimentation coefficient scales linearly with the lateral diameter and sheet thickness.We investigated samples processed at three different nozzle pressures (40, 50 and 70 MPa) and different run counts. The results of the AUC analysis are presented in Fig. 8.
As it can be seen in Fig. 8a, structures with sedimentation coefficients between 100 and 90![[thin space (1/6-em)]](https://www.rsc.org/images/entities/char_2009.gif) 000 sved were found by AUC. The upper boundary is equivalent to a sedimentation equivalent spherical particle size of 399 nm, which agrees perfectly to the adjusted cut size of 400 nm. For all pressures the sedimentation coefficient and thus the particle size decreases with the number of runs. However, for run six at 40 MPa larger structures are again detected, an effect which may be attributed to minor fluctuations during processing (compare Fig. 5c and d). We further compared the final batch run six at three pressures, see Fig. 8b. For 40 MPa by far the largest structures were found. The samples produced at 53 and 70 MPa have a similar distribution but the sample processed at 70 MPa contains some more fines and also more course particles compared to the sample processed at 53 MPa. This result is again in good agreement to the data obtained by the statistical Raman spectroscopy and UV-Vis measurements.
000 sved were found by AUC. The upper boundary is equivalent to a sedimentation equivalent spherical particle size of 399 nm, which agrees perfectly to the adjusted cut size of 400 nm. For all pressures the sedimentation coefficient and thus the particle size decreases with the number of runs. However, for run six at 40 MPa larger structures are again detected, an effect which may be attributed to minor fluctuations during processing (compare Fig. 5c and d). We further compared the final batch run six at three pressures, see Fig. 8b. For 40 MPa by far the largest structures were found. The samples produced at 53 and 70 MPa have a similar distribution but the sample processed at 70 MPa contains some more fines and also more course particles compared to the sample processed at 53 MPa. This result is again in good agreement to the data obtained by the statistical Raman spectroscopy and UV-Vis measurements.
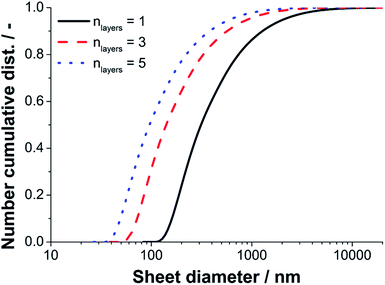
Since a near quantitative yield of FLG (>94%) was found for the 40 MPa sample, we converted the sedimentation coefficient distribution of run five to a lateral diameter distribution according to the methodology described previously in detail by Walter and Nacken et al.39 The results of the diameter analysis are shown in Fig. 9. The maximum and minimum sheet diameters depend on the number of layers used for the calculation. We used sheet thicknesses of one, three and five layers to estimate the boundary values for the lateral sizes. The true lateral diameter distribution of the sample processed with 40 MPa is expected to range from 60–4000 nm as the main fraction of product particles consists of three layers (n = 3) as found by statistical Raman spectroscopy.
Conclusions
FLG suspensions of good quality with respect to degree of delamination and few in-plane defects can be prepared on large scale by graphite delamination in an industrial high pressure homogenizer. The overall adjusted pressure was found as the dominant processing parameter. Turbulent shear stress, cavitation and collisions between the feed particles contribute to delamination and all contributions are expected to increase with growing nozzle pressure.The maximum achieved FLG concentration is 0.223 g L−1 corresponding to a production rate of 0.106 g L−1 h−1 (about 0.5 g h−1) and was obtained for 53 MPa. Moreover, for 53 MPa up to ∼0.5% single layer graphene was found. For all investigated pressures the FLG content in the centrifuged samples is at least 76%. Up to 94% of FLG were detected for 40 MPa and 6 batch runs. Two- and three-layer graphene were found as the main components of the FLG suspensions processed at pressures of 53 and 70 MPa, whereas for lower pressure three-layer graphene is the dominant species. This result clearly demonstrates that a better degree of delamination is achieved with higher nozzle pressure. A homogenous delamination process was demonstrated by the intensive analytical study of six batch runs processed in sequence with a nozzle pressure of 53 MPa. Particles with lateral dimensions ranging from 40–1000 nm (disc equivalent diameter) were detected by AFM analysis of an NMP processed sample. The obtained FLG-content from statistical Raman spectroscopy showed high reliability and matched the content determined by AFM. Co-localized AFM and Raman spectroscopic investigations reveal that the real FLG content can even be higher than indicated by Raman spectroscopy alone. Thus, the FLG contents derived from statistical Raman spectroscopy have to be regarded as lower limit values. We further demonstrated the potential of analytical ultracentrifugation for the evaluation of lateral particle size directly in solution.
Acknowledgements
This work was supported financially by the German Science Foundation (DFG), Collaborative Research Centre SFB953: “Synthetic Carbon Allotropes”. The authors would like to thank Netzsch Feinmahltechnik GmbH, Germany for offering the possibility on conducting this research on a high pressure homogenizer Omega®60. Many thanks go to the student helpers Yusra Hambal and Maximilian Uttinger for support in AFM and experimental work and our colleagues C. Konnerth and S. Romeis for scientific discussions.References
- K. S. Novoselov, A. K. Geim, S. V. Morozov, D. Jiang, Y. Zhang and S. V. Dubonos, et al., Science, 2004, 5696, 666 CrossRef PubMed.
- K. S. Novoselov, D. Jiang, F. Schedin, T. J. Booth, V. V. Khotkevich and S. V. Morozov, et al., Proc. Natl. Acad. Sci. U. S. A., 2005, 30, 10451 CrossRef PubMed.
- A. K. Geim and K. S. Novoselov, Nat. Mater., 2007, 3, 183 CrossRef PubMed.
- S. V. Morozov, K. S. Novoselov, M. I. Katsnelson, F. Schedin, D. C. Elias and J. A. Jaszczak, et al., Phys. Rev. Lett., 2008, 1, 16602 CrossRef.
- K. I. Bolotin, K. J. Sikes, Z. Jiang, M. Klima, G. Fudenberg and J. Hone, et al., Solid State Commun., 2008, 9–10, 351 CrossRef PubMed.
- R. R. Nair, P. Blake, A. N. Grigorenko, K. S. Novoselov, T. J. Booth and T. Stauber, et al., Science, 2008, 5881, 1308 CrossRef PubMed.
- M. J. Allen, V. C. Tung and R. B. Kaner, Chem. Rev., 2009, 1, 132 Search PubMed.
- Y. Zhu, S. Murali, W. Cai, X. Li, J. W. Suk and J. R. Potts, et al., Adv. Mater., 2010, 35, 3906 CrossRef PubMed.
- Y. Hernandez, V. Nicolosi, M. Lotya, F. M. Blighe, Z. Sun and S. De, et al., Nat. Nanotechnol., 2008, 9, 563 CrossRef PubMed.
- M. Lotya, P. J. King, U. Khan, S. De and J. N. Coleman, ACS Nano, 2010, 6, 3155 CrossRef PubMed.
- L. Guardia, M. J. Fernández-Merino, J. I. Paredes, P. Solís-Fernández, S. Villar-Rodil and A. Martínez-Alonso, et al., Carbon, 2011, 5, 1653 CrossRef PubMed.
- I. Jeon, H. Choi, S. Jung, J. Seo, M. Kim and L. Dai, et al., J. Am. Chem. Soc., 2013, 135, 1386 CrossRef CAS PubMed.
- Y. Lv, L. Yu, C. Jiang, S. Chen and Z. Nie, RSC Adv., 2014, 26, 13350 RSC.
- Y. Yao, Z. Lin, Z. Li, X. Song, K. Moon and C. Wong, J. Mater. Chem., 2012, 27, 13494 RSC.
- W. Zhao, M. Fang, F. Wu, H. Wu, L. Wang and G. Chen, J. Mater. Chem., 2010, 28, 5817 RSC.
- C. Knieke, A. Berger, M. Voigt, R. N. K. Taylor, J. Röhrl and W. Peukert, Carbon, 2010, 11, 3196 CrossRef PubMed.
- C. Damm, T. J. Nacken and W. Peukert, Carbon, 2015, 81, 284 CrossRef CAS PubMed.
- T. J. Nacken, C. Damm, H. Xing, A. Rüger and W. Peukert, Nano Res., 2015 DOI:10.1007/s12274-014-0694-6.
- K. R. Paton, E. Varrla, C. Backes, R. J. Smith, U. Khan and A. O'Neill, et al., Nat. Mater., 2014, 6, 624 CrossRef PubMed.
- E. Varrla, K. R. Paton, C. Backes, A. Harvey, R. J. Smith and J. McCauley, et al., Nanoscale, 2014, 20, 11810 RSC.
- L. Liu, Z. Shen, M. Yi, X. Zhang and S. Ma, RSC Adv., 2014, 69, 36464 RSC.
- Z. Wang, J. Liu, W. Wang, H. Chen, Z. Liu, Q. Yu, H. Zeng and L. Sun, Chem. Commun., 2013, 49, 10835 RSC.
- K. Parvez, Z.-S. Wu, R. Li, X. Liu, R. Graf, X. Feng and K. Müllen, J. Am. Chem. Soc., 2014, 136, 6083 CrossRef CAS PubMed.
- G. Brookman, Biotechnol. Bioeng., 1974, 3, 371 CrossRef PubMed.
- G. Narsimhan and P. Goel, J. Colloid Interface Sci., 2001, 2, 420 CrossRef PubMed.
- S. Mohan and G. Narsimhan, J. Colloid Interface Sci., 1997, 1, 1 CrossRef.
- P. R. Mishra, L. A. Shaal, R. H. Müller and C. M. Keck, Int. J. Pharm., 2009, 1–2, 182 CrossRef PubMed.
- J. Salazar, A. Ghanem, R. H. Müller and J. P. Möschwitzer, Eur. J. Pharm. Biopharm., 2012, 1, 82 CrossRef PubMed.
- F. J. Tölle, M. Fabritius and R. Mülhaupt, Adv. Funct. Mater., 2012, 6, 1136 CrossRef PubMed.
- A. Appel, R. Thomann and R. Mülhaupt, Polymer, 2012, 22, 4931 CrossRef PubMed.
- B. Schlüter, R. Mülhaupt and A. Kailer, Tribol. Lett., 2014, 1, 353 CrossRef.
- M. Yi, Z. Shen, X. Zhang and S. Ma, Appl. Phys. Lett., 2011, 99, 123112 CrossRef PubMed.
- J. Li, Z. Shen, S. Ma, X. Zhang and Y. Xing, Sci. China: Technol. Sci., 2012, 55, 2815 CrossRef CAS.
- M. Yi, Z. Shen, W. Zhang, J. Zhu, L. Liu, S. Liang, X. Zhang and S. Ma, Nanoscale, 2013, 5, 10660 RSC.
- M. Yi, Z. Shen and J. Zhu, Chin. Sci. Bull., 2014, 59, 1794 CrossRef CAS PubMed.
- S. Liang, Z. Shen, M. Yi, L. Liu, X. Zhang, C. Cai and S. Ma, J. Nanosci. Nanotechnol., 2015, 15, 2686 CrossRef CAS PubMed.
- S. Eigler, F. Hof, M. Enzelberger-Heim, S. Grimm, P. Müller and A. Hirsch, J. Phys. Chem. C, 2014, 14, 7698 Search PubMed.
- J. M. Englert, P. Vecera, K. C. Knirsch, R. A. Schäfer, F. Hauke and A. Hirsch, ACS Nano, 2013, 6, 5472 CrossRef PubMed.
- J. Walter, T. J. Nacken, C. Damm, T. Thajudeen, S. Eigler and W. Peukert, Small, 2015, 11, 814 CrossRef CAS PubMed.
- S. Bhattacharyya, P. Maciejewska, L. Börger, M. Stadler, A. Gülsün and H. Cicek, et al., Prog. Colloid Polym. Sci., 2006, 131, 9 CAS.
- J. Walter, K. Löhr, E. Karabudak, W. Reis, J. Mikhael and W. Peukert, et al., ACS Nano, 2014, 9, 8871 CrossRef PubMed.
- P. Schuck and P. Rossmanith, Biopolymers, 2000, 5, 328 CrossRef.
- M. Lotya, Y. Hernandez, P. J. King, R. J. Smith, V. Nicolosi and L. S. Karlsson, et al., J. Am. Chem. Soc., 2009, 10, 3611 CrossRef PubMed.
- M. Yi, Z. Shen, X. Zhang and S. Ma, J. Phys. D: Appl. Phys., 2013, 2, 25301 CrossRef.
- S. Beinert, T. Gothsch and A. Kwade, Chem. Eng. Sci., 2015, 123, 197 CrossRef CAS PubMed.
- T. Gothsch, C. Schilcher, C. Richter, S. Beinert, A. Dietzel, S. Büttgenbach and A. Kwade, Microfluid. Nanofluid., 2015, 18, 121 CrossRef CAS.
- Z. Sun, S. Pöller, X. Huang, D. Guschin, C. Taetz and P. Ebbinghaus, et al., Carbon, 2013, 64, 288 CrossRef CAS PubMed.
- J. M. Englert, J. Röhrl, C. D. Schmidt, R. Graupner, M. Hundhausen and F. Hauke, et al., Adv. Mater., 2009, 42, 4265 CrossRef PubMed.
- S. Lee, K. Lee and Z. Zhong, Nano Lett., 2010, 11, 4702 CrossRef PubMed.
- Y. Hao, Y. Wang, L. Wang, Z. Ni, Z. Wang and R. Wang, et al., Small, 2010, 2, 195 CrossRef PubMed.
- S. Chen, W. Cai, R. D. Piner, J. W. Suk, Y. Wu and Y. Ren, et al., Nano Lett., 2011, 9, 3519 CrossRef PubMed.
- F. Tuinstra and J. Koenig, J. Compos. Mater., 1970, 4, 494 Search PubMed.
- F. Tuinstra and L. Koenig, J. Chem. Phys., 1970, 3, 1126 CrossRef PubMed.
- A. Jorio, E. H. Martins Ferreira, M. V. O. Moutinho, F. Stavale, C. A. Achete and R. B. Capaz, Phys. Status Solidi B, 2010, 247, 2980 CrossRef CAS PubMed.
- L. G. Cançado, A. Jorio, E. H. M. Ferreira, F. Stavale, C. A. Achete and R. B. Capaz, et al., Nano Lett., 2011, 8, 3190 CrossRef PubMed.
- U. Khan, H. Porwal, A. O'Neill, K. Nawaz, P. May and J. N. Coleman, Langmuir, 2011, 27, 9077 CrossRef CAS PubMed.
- D. S. Lee, C. Riedl, B. Krauss, K. von Klitzing, U. Starke and H. J. Smet, Nano Lett., 2008, 8, 4320 CrossRef CAS PubMed.
- A. C. Ferrari, J. C. Meyer, V. Scardaci, C. Casiraghi, M. Lazzeri, F. Mauri, S. Piscanec, D. Jiang, K. S. Novoselov, S. Roth and A. K. Geim, Phys. Rev. Lett., 2006, 97, 187401 CrossRef CAS.
- D. Graf, F. Molitor, K. Ensslin, C. Stampfer, A. Jungen, C. Hierold and L. Wirtz, Nano Lett., 2007, 7, 238 CrossRef CAS PubMed.
- A. K. Gupta, T. J. Russin, H. R. Gutiérrez and P. C. Eklund, ACS Nano, 2008, 1, 45 Search PubMed.
- C. Casiraghi, A. Hartschuh, H. Qian, S. Piscanec, C. Georgi and A. Fasoli, et al., Nano Lett., 2009, 4, 1433 CrossRef PubMed.
Footnote |
| † Electronic supplementary information (ESI) available. See DOI: 10.1039/c5ra08643d |
| This journal is © The Royal Society of Chemistry 2015 |

