Functional quasi-solid-state electrolytes for dye sensitized solar cells prepared by amine alkylation reactions
Andigoni Apostolopoulouab,
Antonis Margaliasa and
Elias Stathatos*a
aDepartment of Electrical Engineering, Technological-Educational Institute of Western Greece, GR-26334 Patras, Greece. E-mail: estathatos@teiwest.gr; Fax: +30-2610-369193; Tel: +30-2610-369242
bPhysics Dept., University of Patras, 26500 Patras, Greece
First published on 17th June 2015
Abstract
Novel quasi-solid state electrolytes for dye-sensitized solar cells (QSS-DSCs) are prepared by the amine alkylation reaction. In particular two oligomers of poly(propylene oxide) and one block oligomer of poly(ethylene oxide)/poly(propylene oxide) with two amino groups grafted at both edges of the oligomers were used as amine sources with iodoethane as the alkyl halide for substitution reactions. The nucleophilic aliphatic substitution (of the halide) reaction gives a higher substituted amine product and an iodide ion which is essential for QSS-DSC operation. Fourier transform infrared and UV-Vis spectroscopy, differential scanning calorimetry as well as electrochemical impedance spectroscopy were employed to characterize the resulting material after the alkylation reaction. The sequential quasi-solid state electrolytes only containing the new quasi-solid materials after mixing amino ended oligomers with iodoethane and iodine without any plasticizer and additional iodide sources were examined as gel electrolytes in QSS-DSCs consisting of thin and transparent TiO2 photoelectrodes sensitized with a N-719 ruthenium complex. The cells were found to be durable to thermal and light soaking exposure while a maximum overall efficiency of 3.7% was recorded without the presence of any solvent or additive for voltage and current enhancement.
Introduction
Almost twenty five years ago, dye-sensitized photoelectrochemical solar cells (DSCs) were proposed as alternative structures with competitive performances with respect to amorphous silicon photovoltaic cells.1–4 The simple fabrication process, transparency and relatively low cost were the main advantages over the conventional photovoltaic materials while new and smart applications employing DSCs continuously appeared after the first demonstration of this technology.5,6 Since then, the components of a DSC have more or less been established and they are: a TiO2 nanocrystalline film deposited on a SnO2:F transparent conductive electrode (negative electrode), a ruthenium bipyridyl derivative adsorbed and chemically anchored on TiO2 films, an electrolyte bearing the I−/I3− redox mediator and a platinized SnO2:F electrode (positive electrode). However, liquid electrolytes cause several problems to the cell fabrication steps. The leakage and volatilization issues of solvents in combination with poor long term stability of liquid based electrolytes are serious obstacles to the commercialization of DSCs.7,8 In order to overcome the aforementioned problems, several approaches have been proposed to replace liquid electrolytes with solid alternatives.9 Somehow, the solid electrolytes should allow a successful contact with the TiO2 particles at the mesoporous electrode and enhance the values of the conductivities.10 A large number of published works refer to the use of small molecules,11 inorganic particles12 and conducting polymers13,14 as solid electrolytes in DSCs. Unfortunately, solar cells with solid electrolytes exhibit relatively low efficiencies because of high recombination rates at the TiO2/solid electrolyte interface in addition to the low conductivity of the solid electrolyte itself.15 One main reason for this low performance is the imperfect wetting of the porous TiO2 film and the lack of sufficient electric contact between the working electrode and the solid-state electrolyte. As an alternative to the application of materials in the solid state, many researchers have chosen to introduce gelifiers into the electrolyte, thus making the so-called quasi-solid state DSCs (QSS-DSCs).16–18 QSS-DSCs have lower efficiencies than liquid cells, mainly due to lower ionic conductivity, but the efficiency values are still kept at satisfactory levels. This is usually due to the presence of solvents which are prevented from leaking and volatilizing by the presence of a polymer or oligomer network with or without inorganic particles and fillers.19 Quasi-solid state electrolytes are roughly distinguished into three categories: (1) gel electrolytes can be formed after the addition of organic or inorganic (or both) thickeners20 – such materials may be long-chain polymers like poly(ethylene oxide) or inorganic nanoparticles like titania or silica;21 (2) by the in situ polymerization of a polymerizable precursor into the electrolyte solution;22 (3) finally, a third route is to produce a gel incorporating the I−/I3− redox couple into the sol–gel process by using a sol–gel precursor, like a titanium or silicon alkoxide.23,24 The basic advantage of the quasi-solid state over the solid state electrolyte is that it is applied at an early stage of the preparation when it is still fluid, so it penetrates into the titania nanoporous structure and ensures the electrical conduction between the titania nanocrystallites and the electrolyte. However, the solar cell cannot function without a sufficiently expanded organic subphase mainly due to the reasonably good values for ionic conductivity which are only made possible by the organic subphase.In the present work, we explore for the first time the usage of novel quasi-solid state electrolytes prepared by the amine alkylation reaction in QSS-DSCs. In particular, we explore the substitution reaction among two oligomers of poly(propylene oxide) and one block oligomer of poly(ethylene oxide)/poly(propylene oxide) with two amino groups grafted at both edges as amine sources with iodoethane as the alkyl halide. The iodide ion as a product of the amine alkylation reaction is one of the main species for the I−/I3− redox mediator avoiding the use of expensive ionic liquids or/and inorganic iodide salts which usually crystallize in the electrolyte, diminishing the efficiency of the cells with time. The presence of poly(ethylene oxide) and/or poly(propylene oxide) chains are necessary as ionic conductive media for functional QSS-DSCs. Furthermore, the importance of the proposed method is that we do not use any solvent usually employed in QSS-DSCs, eliminating the case of solvent leakage with time of operation or finally any additive for voltage and current improvement.
Experimental
Materials
For the electrolyte fabrication step, we used iodoethane (IoE, >99%, Aldrich), poly(propylene glycol)-bis(2-aminopropyl ether) of average molecular weight 230 (APPG230, Aldrich), poly(propylene glycol)-bis(2-aminopropyl ether) of average molecular weight 400 (APPG400, Aldrich), O,O′-bis(2-aminopropyl)-polypropylene glycol-block-polyethylene glycol-block-polypropylene glycol 500 (Jeffamine ED-600, Aldrich), and iodine (>99.8%, Fisher Scientific) which were used as received. Titanium(IV)butoxide (TBO, 97%, Aldrich), poly(ethylene glycol)-block-poly(propylene glycol)-block-poly(ethylene glycol) (MW ≈ 5800, Pluronic P123, Aldrich), and glacial acetic acid (AcOH, 99–100%, Aldrich) were used to make the precursor TiO2 sols. Chloroplatinic acid hexahydrate (H2PtCl6, reagent grade) and all solvents were of analytical grade and purchased from Sigma-Aldrich. cis-Diisothiocyanato-bis(2,2′-bipyridyl-4,4′-dicarboxylato)-ruthenium(II)-bis(tetrabutylammonium) N719 was purchased from Solaronix S.A, Switzerland. SnO2:F transparent conductive electrodes (FTO, TEC™ A8) 8 Ohm square−1 were purchased from Pilkington NSG Group.Methods
FT-IR spectra for all electrolytes in gel morphology were monitored with a Jasco 4100 spectrophotometer (4000–350 cm−1, resolution 0.7 cm−1) by forming thin films on silicon wafers. The absorption spectra of the compounds in films were obtained using a Hitachi U-2900 UV-Vis spectrophotometer. Differential scanning calorimetry-thermogravimetric analyses (DSC-TGA) were performed for all electrolytes with a Perkin Elmer, STA6000 instrument. The transition temperature from gel to liquid state (Tgel) of the electrolyte was determined with DSC using 10–15 mg of each sample which was sealed in an aluminium pan and heated at a rate of 10 °C min−1 from room temperature to 160 °C.For the I–V curves of the solar cells, the samples were illuminated with Xe light using a Solar Light Co. solar simulator (model 16S-300) equipped with AM 0 and AM 1.5 direct Air Mass filters to simulate the solar radiation at the surface of the Earth. The light intensity was kept constant at 1000 W m−2 measured with a Newport power meter (843-R). Finally, the I–V curves were recorded by connecting the cells to a Keithley Source Meter (model 2601A) which was controlled by a Keithley computer software (LabTracer). The cell active area was constant to 2 cm2 while a 0.3 cm2 black mask was used in all measurements. Cell performance parameters, including short-circuit current density (Jsc), open circuit voltage (Voc), maximum power (Pmax), fill factor (FF) and overall cell conversion efficiency, were measured and calculated from each J–V characteristic curve. In each case, we made three devices which were tested under the same conditions in order to avoid any misleading estimation of their efficiency and the mean values of every measured parameter for each case appear in all the presented tables. The incident photon-to-current conversion efficiency (IPCE) was measured for all cells after illumination with a Xe light source using a filter monochromator (IQE 200TM, Newport).
Complex impedance measurements were performed on square shaped samples with a thickness of ∼80 micrometers sandwiched between two copper electrodes with a 1 cm2 effective area. Besides, electrochemical impedance spectroscopy (EIS) characterization was carried out in the dark and under illumination using the same Xe light source that was used for monitoring the J–V curves. EIS measurements were performed without the use of a mask with a Metrohm Autolab 3.v potentiostat galvanostat (Model PGSTAT 128N) through a frequency range from 100 kHz to 0.1 Hz using a perturbation of ±10 mV over the open circuit potential. Experimental data are presented by scattering symbols while lines represent the fitted plots obtained using the Nova 1.10 software.
Fabrication and characterization of quasi-solid dye-sensitized cells
Results and discussion
One of the main problems in the operation of DSCs with time is the electrolyte. The electrolytes in liquid phase, as referred before, are not the choice of many research groups because of their leakage and difficulties in the sealing of the cells. However, even in the case of quasi-solid electrolytes, several solvents are routinely used as basic components. Moreover, inorganic iodide salts such as LiI are also necessary in order to create the necessary redox mediator or for conductivity enhancement of the electrolyte. This usually causes unexpected problems such as the crystallization of the inorganic salts in the organic phase of the quasi-solid electrolytes reducing the cells’ performance with time.27,28 In this work we propose a new idea for the formation of iodide ions in the quasi-solid state electrolyte by the amine alkylation reaction between an alkyl halide such as iodoethane and amine species which could be present for instance, in an oligomer with double amine ends (i.e. NH2–PEGx–NH2) as presented in Scheme 2. In this scheme, for reasons of simplicity, we present only one amine group at one end of the oligomers where R is PEGx in this case. This nucleophilic aliphatic substitution of the iodide may finally result in the necessary iodide species for the creation of the I−/I3− redox couple in combination with the coexistence of I2 in the mixture. The amine N acts as the nucleophile and attacks the electrophilic C of the alkyl iodide displacing the iodide and creating the new C–N bond.29It is obvious that the resulting material with the iodide counterion could have the same functionality as common ionic liquids with iodide counterions and inorganic iodide salts used in DSCs.
We examined the progress of the reaction in respect to Fourier transform infrared spectra (FTIR) for the three oligomers we used as amine sources. The results appear in Fig. 1. The band at 2890 cm−1 arises from –CH2– stretching vibrations and the weak bands at ca. 1344 and 1471 cm−1 are ascribed to –CH2– wagging vibrations which are characteristic of a molten and amorphous state of polyethylene glycol, while bands at about 1965 and 1801 cm−1 which could be characteristic vibrations of crystallized polyethylene glycol are finally not present. The initial evidence for the formation of the secondary amine is proven by the bands in the region between 1278 and 960 cm−1, which are assigned to C–O vibrations while there is no evidence of a peak at 500 cm−1 referring to the C–I stretching mode characteristic of iodoethane. Furthermore, N–H stretching occurs at 3500–3300 cm−1 and two bands appear for primary amines such as those that exist in APPG 230/400 and ED-600. In the case of the alkylation reaction, a new peak at 3447 cm−1 appears which is characteristic of the creation of a secondary amine. Finally, the N–H bending band at 1640–1560 cm−1 for primary amine is strongly perturbed after the reaction which is finally a further evidence for the product described in Scheme 2.30
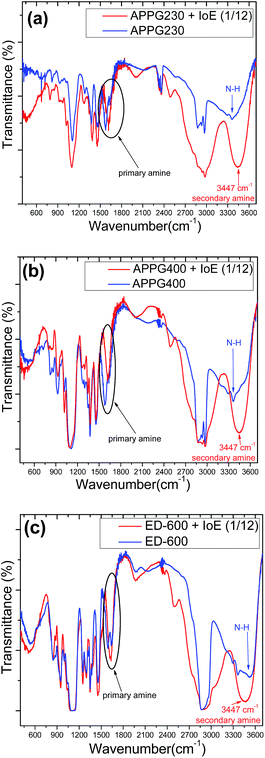 | ||
| Fig. 1 FTIR spectra of (a) APPG230, (b) APPG400 and (c) ED-600 before and after reaction with iodoethane. | ||
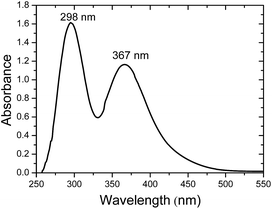
In the above experiments the maximum quantity of iodoethane is used as a result of the better electrical performance achieved for the solar cells at this ratio and it will be shown in a following paragraph. The presence of iodide ions after the reaction of iodoethane with the amine groups of the oligomers could be also spectroscopically proven. It is well known that the co-presence of iodine with iodide may form triiodide in the equilibrium reaction I2 + I− → I3−. The presence of the triiodide ion in the electrolyte is very important for the functioning of the cell since it is the main ionic conductivity vehicle through the cathodic dark reaction I3− + 2e− → 3I−. The presence of triiodide could be spectroscopically determined by the peaks at 300 and 360 nm in the absorption spectrum of the electrolyte.31 Indeed, measuring the absorbance of all prepared electrolytes with iodoethane and three different oligomers in the presence of iodine the peaks at the two wavelengths are obvious. As an example we present in Fig. 2 the absorption spectrum of the electrolyte based on ED-600. However, the absorbance for the other two oligomers is quite similar. As it can be seen, the formation of the triiodide in the electrolyte is clear with two characteristic peaks located at 298 and 367 nm.
Differential scanning calorimetry was then used to determine the gel to liquid phase transition of the gel product in Scheme 2. Tgel from the gel to liquid state is very important since it reflects the stability of the new electrolyte in the cell to the external temperature. In general, higher values for Tgel are useful in order to achieve long term stability for the solar cells. The obtained thermograms and the Tgel values for the three gels depending on the different oligomer used each time are presented in Fig. 3. The phase transition temperature for all samples is ranged between 104 and 110 °C.
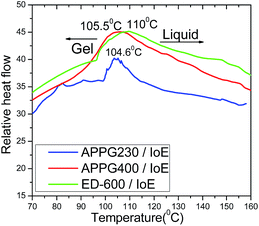 | ||
| Fig. 3 Differential scanning calorimetric thermograms of the APPG230, APPG400 and ED-600/iodoethane gels. | ||
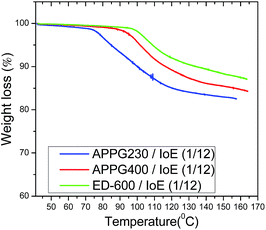
However, the small increase from 104.6 to 110 °C in Tgel among the three samples can be explained by the difference of the oligomer chain length where an increased intermolecular interaction of the carbon chain by van der Waals forces could happen. Additionally, the percentage of mass loss during the thermal treatment of the aforementioned samples appears in Fig. 4. It is obvious that the thermogravimetric analysis of the samples showed that there is a similar behaviour with that observed in the thermograms in Fig. 3 where a mass loss first appears for the APPG230/iodoethane sample at a relatively lower temperature than for the APPG400 and ED-600/iodoethane samples.
The ionic conductivity for the as-prepared electrolytes with three oligomers was calculated by examining the electrochemical properties of the materials. Fig. 5 shows the complex impedance curves obtained for the three electrolytes. All spectra contain two different regions: incomplete semicircles in the high frequency and a spike in the low frequency. The semicircle part of the impedance spectra is related to the ionic conduction of the bulk material.
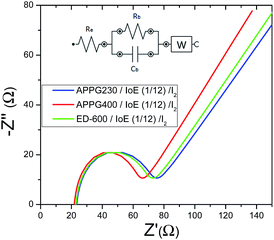 | ||
| Fig. 5 Complex impedance plot of the APPG230, APPG400 and ED-600/iodoethane/I2 gels measured in the dark. | ||
The presence of the semicircle is explained in terms of an equivalent circuit composed of a parallel combination of a resistor (bulk resistance Rb) and a geometry capacitor (Cb) as appears in the inset in Fig. 5. The resistor refers to the migration of ions in the volume of the organic matrix while the capacitor represents the immobile oligomers’ chains. The use of symmetrical electrodes in the impedance analysis (the resistance of which is referred to as Re) allows the interface between the electrolyte/electrode to be considered as capacitance.32 The spike is represented by a Warburg impedance element (W).
The ionic conductivities (σ) for the three samples at room temperature were deduced according to the basic equation  after fitting the data with the equivalent circuit, where Rb is the resistance appearing in parallel with the capacitor (Cb) in the inset image of Fig. 5.33 In the equation, L is the thickness of the gel electrolyte and A is the contact area between the two electrodes. The calculated values are presented in Table 1. The values for each of the three electrolytes seem to be very close but a relatively higher value was calculated for APPG400. However, the existence of a resistor connected in series (Re) with the parallel system in the equivalent circuit presented in the inset of Fig. 5 can be explained by the intersection of the graphs with the x-axis.
| Electrolyte | Conductivity (S cm−1 × 10⁻⁴) |
|---|---|
| APPG230 + IoE (1/12)/I2 | 1.15 |
| APPG400 + IoE (1/12)/I2 | 1.37 |
| ED-600 + IoE (1/12)/I2 | 1.25 |
To further characterize the electron transport in the new electrolytes, we studied the kinetic process at the TiO2/dye electrode/electrolyte interfaces of the DSCs using electrochemical impedance spectroscopy in the dark as appears in Fig. 6a. In the dark, when a forward bias is applied to the cells, the electrons move through the TiO2 electrode and primarily react with triiodide, as iodide is oxidized to triiodide ions at the counter electrode.34,35 The experimental data obtained for the three electrolytes were fitted in terms of an equivalent circuit which is depicted in Fig. 6b. The order in which each parallel combination of a resistance and the corresponding capacitance appear is not always the same. The identification of which resistance represents which capacitance in each case depends on the values of each capacitance respectively. In the Nyquist plot the first semicircle corresponds to the Pt/electrolyte interface, Rpt.36
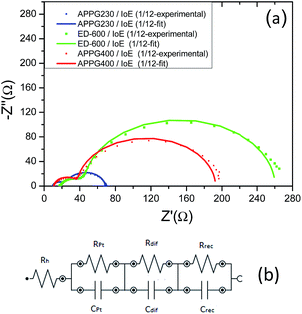 | ||
| Fig. 6 Nyquist plots (a) and the equivalent circuit (b) for the three electrolytes obtained from electrochemical impedance spectroscopy in the dark. | ||
In particular, the charge transfer resistance at the counter electrode (Rpt) is represented as a semicircle in the impedance spectra. The resistance element related to the response in the intermediate frequency represents the charge transport at the TiO2/dye/electrolyte interface (Rrec). The semicircle at the low frequency, which is attributed to the diffusion in the electrolyte (Rdif), was very small and not well formed indicating a fast diffusion. Finally, the intercept with the horizontal axis stands for the sheet resistance of the FTO substrate and the contact resistance of the FTO/TiO2 (Rh). The total series resistance of the cell can be calculated using eqn (1).
| Rs = Rh + Rpt + Rdif | (1) |
Furthermore, the Rrec resistance related to electron recombination processes occurring at the TiO2/dye/electrolyte interfaces and Crec (capacitance of the same interface) can be used to calculate the electron recombination lifetime at this interface according to the relation τn = RrecCrec.34 In general, the electron recombination at the TiO2/dye/electrolyte interface is slightly lower when the values of Rrec and τn are larger. As it can be seen in Table 2 in the case of ED-600 the Rrec and τn values are the highest among the three electrolytes. This is probably due to the faster diffusion of triiodide ions in the electrolyte allowing better photovoltaic performance of the cells with this electrolyte. However, the chemical capacitance Crec also corresponds to the trap energy distribution below the conduction band edge and is related to the energy difference between EF − EF,redox according to eqn (2):35
 | (2) |
EF is the quasi Fermi level which determines the electron occupation of the trap and conduction band states while EF,redox is the energy difference between the quasi-Fermi level and the redox Fermi level, Co is the pre-factor of the exponential, KB is the Boltzmann constant and a = T/To where To is the characteristic temperature of the distribution and T is the temperature. Lower values for Crec show an upward displacement of the TiO2 conduction band edge. In our case the TiO2 conduction band edge of the cells based on previous reasonings are finally more negative for the electrolytes based on ED-600 than those based on APPG230 and APPG400, leading to a better behaviour in terms of the open circuit voltage of the cells with ED-600 in the electrolyte.
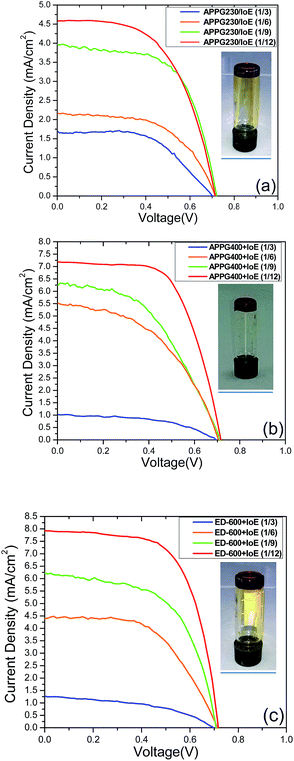
The prepared redox electrolytes with oligomer/iodoethane/I2 were incorporated in the solar cells using thin nanocrystalline TiO2 films sensitized with the N719 dye as photoanodes and their performances were monitored. The current density–voltage measurements for each oligomer/iodoethane ratio appear in Fig. 7, obtained under 1 sun (AM 1.5G) illumination conditions while the electrical parameters are presented in Table 3. It is obvious that the oligomer/iodoethane ratio equal to 1/12 gave the most efficient performance of all the solar cells we prepared. By increasing the quantity of iodoethane, an increase in the performance is also observed for any of the three oligomers in the electrolyte. However, the differences in the maximum overall performance among cells with different oligomers in the electrolyte are also evident. The obvious reason for this behaviour is the quantity of iodide ions in the electrolyte. The iodide ion leakage in the electrolyte is very critical to the overall performance of the cells, therefore a 12 times higher molar ratio with regards to each oligomer finally leads to the necessary concentration of iodoethane in the electrolyte. However, larger quantities of iodoethane in the electrolyte did not cause any additional improvement to the cell performance. The presence of ED-600 gave better performance with the cells exhibiting an overall performance of 3.7%.
| Electrolyte | Voc (mV) | Jsc (mA cm−2) | FF | n (%) |
|---|---|---|---|---|
| APPG230 + IoE (1/3)/I2 | 700 | 1.7 | 0.56 | 0.7 |
| APPG230 + IoE (1/6)/I2 | 713 | 2.2 | 0.60 | 1.0 |
| APPG230 + IoE (1/9)/I2 | 714 | 4.0 | 0.60 | 1.7 |
| APPG230 + IoE (1/12)/I2 | 705 | 4.6 | 0.59 | 1.9 |
| APPG400 + IoE (1/3)/I2 | 690 | 1.1 | 0.60 | 0.5 |
| APPG400 + IoE (1/6)/I2 | 694 | 5.5 | 0.56 | 2.2 |
| APPG400 + IoE (1/9)/I2 | 702 | 6.3 | 0.58 | 2.6 |
| APPG400 + IoE (1/12)/I2 | 705 | 7.3 | 0.62 | 3.2 |
| ED-600 + IoE (1/3)/I2 | 695 | 1.3 | 0.48 | 0.5 |
| ED-600 + IoE (1/6)/I2 | 710 | 4.4 | 0.58 | 1.8 |
| ED-600 + IoE (1/9)/I2 | 706 | 6.3 | 0.55 | 2.5 |
| ED-600 + IoE (1/12)/I2 | 712 | 8.0 | 0.64 | 3.7 |
The presence of APPG230 gave the worst performance among the three electrolytes. This oligomer has also the shortest chain length among the three oligomers. It is worth noting that the open circuit voltage of all cells was around 0.7 volts which is a remarkable value in the absence of any electrolyte additive for voltage enhancement such as 4-tert-butylpyridine usually employed in DSC technology. The photocurrent action spectra for the cells with optimized electrolytes were also examined and presented in Fig. 8. The maximum IPCE value of 65% at 512 nm was obtained for the cell made with the ED-600 oligomer while 53% was obtained in the case of APPG-230. These results are quite consistent with the current density values obtained for the cells. The dark current suppression was also examined to perceive the extent of the back electron transfer.
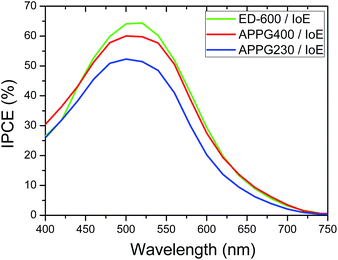 | ||
| Fig. 8 Photocurrent action spectra of the DSCs based on (a) APPG230, (b) APPG400 and (c) ED-600 and iodoethane. | ||
Fig. 9 shows the dark current density in the cells made with the different electrolytes. The onset of the dark current for the DSCs fabricated with the APPG230 and 400 electrolytes occurred at a lower voltage compared with ED-600 which may be attributed to the slower transport of triiodide ions from the negative photoelectrode/electrolyte interface to the counter electrode.37
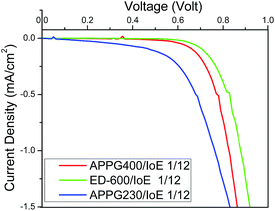 | ||
| Fig. 9 J–V curves of the DSCs based on (a) APPG230, (b) APPG400 and (c) ED-600 and iodoethane in dark. | ||
The effect on the electron transport of the interfaces in the DSCs under simulated solar light can be investigated by electrochemical impedance spectroscopy (EIS).
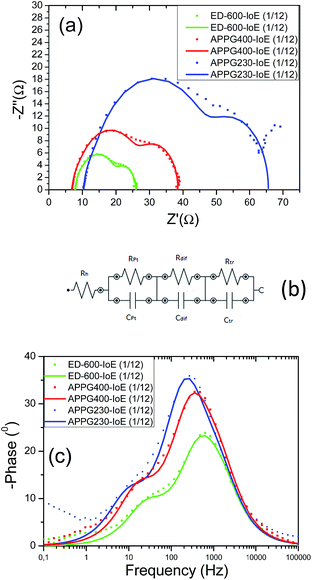
Fig. 10a and Fig. 10c show the Nyquist and Bode plots obtained from the cells with optimized concentrations of iodoethane, respectively. The charge transfer resistance at the counter electrode (Rpt) is represented as a semicircle in the impedance spectrum and as a peak in the Bode phase angle plot. The resistance element related to the response in the intermediate frequency represents the charge transport at the TiO2/dye/electrolyte interface (Rtr) and shows a diode like behaviour. The semicircle at the low frequency is attributed to the diffusion in the electrolyte (Rdif). The fitted parameters for the three cells are presented in Table 4 while the equivalent circuit which was used to fit the experimental data is presented in Fig. 10b. The Jsc values shown in Table 3 are in general qualitatively consistent with the Rpt and Rtr values of the cells in Table 4. Two factors that limit the short-circuit photocurrent are the efficiency of collecting the injected electrons at the transparent back contact and the catalytic ability of the counter electrode for the reduction of I3− ions to I− ions.38 If Rtr is low, the efficiency of collecting the injected electrons at the transparent back contact increases, which results in an increase in the rate of electron transfer in the circuit and thereby the short circuit photocurrent of the pertinent DSC. Besides, if Rpt is also low, the rate of reduction of the I3− ions and creation of the I− ions increases resulting in an increase in the rate of regeneration of the oxidized dye, the injection of electrons from the regenerated dye and thereby the Jsc. Finally, Rdif concerning the diffusion rate of the I3− and I− ions in the gel electrolyte is also consistent with Jsc. Smaller measured values for Rdif have a beneficial effect to the Jsc and overall efficiency values. The mid-frequency shift to lower values in the Bode diagram may correspond to an increase in the electron lifetime for the APPG230 based electrolyte. Indeed, the electron lifetime can be determined by the equation τn = RtrCtr where Rtr and Ctr are the resistance and capacitance of the TiO2/dye/electrolyte interface.39,40 The values for the electron lifetime calculated from the above equation are presented in Table 4. It is then obvious that in the case of the APPG230 electrolyte an increase in the electron lifetime is measured, which means a more effective suppression of the back reaction of the injected electrons with I3− in the electrolyte. However, the obtained values in each case are comparable. The low and high frequency peaks observed in the Bode plots correspond to triiodide diffusion in the electrolyte and charge transfer at the counter electrode, respectively. There are no significant changes in the low and high frequency peaks implying that no unexpected reactions within the electrolyte and the counter electrode happened for the three electrolytes.
Conclusions
For the first time, a novel quasi-solid state electrolyte for dye sensitized solar cells was prepared through an amine alkylation reaction. Two oligomers of poly(propylene oxide) (APPG230/400) and one block oligomer of poly(ethylene oxide)/poly(propylene oxide) (ED-600) as amine sources reacted with iodoethane resulting in a gel material and iodide as counter ion. The new quasi-solid materials were thermally stable up to 110 °C which is advantageous for their long term stability. The use of different oligomers for the alkylation reaction showed also differences in the electron recombination and conduction band shift of the TiO2 photoelectrodes after examination with EIS in the dark. The as-presented electrolytes which finally do not contain any plasticizers, solvents or other additives were applied in the DSCs where competitive efficiencies were obtained with a 3.7% maximum overall efficiency recorded in the case of ED-600. The highest value for overall efficiency can be attributed to the lowest value of in series resistance of the cells as well as the lowest values of Rtr and Rpt measured with EIS under 1000 W m−2 illumination.Acknowledgements
The authors would like to acknowledge financial support for the present work from “Grant no. 11-ΣYN-7-298, COOPERATION 2011” – Partnerships of Production and Research Institutions in Focused Research and Technology Sectors co-financed by the European Fund regional Development Fund (ERDF) of the European Union and National Resources.Notes and references
- A. Hagfeldt, G. Boschloo, L. Sun, L. Kloo and H. Pettersson, Chem. Rev., 2010, 110, 6595 CrossRef CAS PubMed.
- M. Grätzel, J. Photochem. Photobiol., C, 2003, 4, 145 CrossRef.
- N. Sharifi, F. Tajabadi and N. Taghavinia, ChemPhysChem, 2014, 15, 3902 CrossRef CAS PubMed.
- A. Jena, S. P. Mohanty, P. Kumar, J. Naduvath, V. Gondane, P. Lekha, J. Das, H. K. Narula, S. Mallick and P. Bhargava, Trans. Indian Ceram. Soc., 2012, 71, 1 CrossRef CAS PubMed.
- U. Mehmood, S. Rahman, K. Harrabi, I. A. Hussein and B. V. S. Reddy, Adv. Mater. Sci. Eng., 2014, 974782 Search PubMed.
- Z. Lan and J. Wu, Prog. Chem., 2010, 22, 2248 CAS.
- S. Y. Shen, R. X. Dong, P. T. Shih, V. Ramamurthy, J. J. Lin and K. C. Ho, ACS Appl. Mater. Interfaces, 2014, 6, 18489 CAS.
- S. Lee, Y. Jeon, Y. Lim, M. A. Hossain, S. Lee, Y. Cho, H. Ju and W. Kim, Electrochim. Acta, 2013, 107, 675 CrossRef CAS PubMed.
- J. Wu, Z. Lan, J. Lin, M. Huang, Y. Huang, L. Fan and G. Luo, Chem. Rev., 2015, 115, 2136 CrossRef CAS PubMed.
- C. Wu, L. Jia, S. Guo, S. Han, B. Chi, J. Pu and L. Jian, ACS Appl. Mater. Interfaces, 2013, 5, 7886 CAS.
- P. Wang, S. M. Zakeeruddin, P. Comte, I. Exnar and M. Grätzel, J. Am. Chem. Soc., 2003, 125, 1166 CrossRef CAS PubMed.
- A. Konno, G. R. A. Kumara, R. Hata and K. Tennakone, Electrochemistry, 2002, 70, 432 CAS.
- J. Shi, L. Wang, Y. Liang, S. Peng, F. Cheng and J. Chen, J. Phys. Chem. C, 2010, 114, 6814 CAS.
- L. Jin, Z. Wu, T. Wei, J. Zhai and X. Zhang, Chem. Commun., 2011, 47, 997 RSC.
- M. N. Amalina and M. R. Mahmood, Adv. Mater. Res., 2013, 667, 317 CrossRef.
- T. M. W. J. Bandara, W. J. M. J. S. R. Jayasundara, M. A. K. L. Dissanayake, H. D. N. S. Fernado, M. Furlani, I. Albinsson and B.-E. Mellander, Int. J. Hydrogen Energy, 2014, 39, 2997 CrossRef CAS PubMed.
- M. A. K. L. Dissanayake, R. Jayathissa, V. A. Senevirante, C. A. Thotawatthage, G. K. R. Senadeera and B.-E. Mellander, Solid State Ionics, 2014, 265, 85 CrossRef CAS PubMed.
- N. Manfredi, A. Bianchi, V. Causin, R. Ruffo, R. Simonutti and A. Abbotto, J. Polym. Sci., Part A: Polym. Chem., 2014, 52, 719 CrossRef CAS PubMed.
- S. Ibrahim, S. M. M. Yasin, N. M. Nee, R. Ahmad and M. R. Johan, J. Non-Cryst. Solids, 2012, 358, 210 CrossRef CAS PubMed.
- O. A. IIeperuma, Mater. Technol., 2013, 28, 65 CrossRef PubMed.
- Y. Huang, W. Xiang, X. Zhou, S. Fang and Y. Lin, Electrochim. Acta, 2013, 89, 29 CrossRef CAS PubMed.
- S.-H. Park, J. Lim, I. Y. Song, J.-R. Lee and T. Park, Adv. Energy Mater., 2014, 4, 1300489 Search PubMed.
- E. Stathatos, P. Lianos, U. Lavrencic-Stangar and B. Orel, Adv. Mater., 2002, 14, 354 CrossRef CAS.
- E. Stathatos, P. Lianos and C. Krontiras, J. Phys. Chem. B, 2001, 105, 3486 CrossRef CAS.
- E. Stathatos, P. Lianos and C. Tsakiroglou, Microporous Mesoporous Mater., 2004, 75, 255 CrossRef CAS PubMed.
- T. Makris, V. Dracopoulos, T. Stergiopoulos and P. Lianos, Electrochim. Acta, 2011, 56, 2004 CrossRef CAS PubMed.
- E. Stathatos, P. Lianos, A. S. Vuk and B. Orel, Adv. Funct. Mater., 2004, 14, 45 CrossRef CAS PubMed.
- B. Orel, A. S. Vuk, R. Jese, P. Lianos, E. Stathatos, P. Judeinstein and P. Colomban, Solid State Ionics, 2003, 165, 235 CrossRef CAS PubMed.
- J. March, Advanced Organic Chemistry: Reactions, Mechanisms and Structure, Wiley, New York, 3rd edn, 1985, ISBN 0-471-85472-7 Search PubMed.
- J. Mijovic and S. Andjelic, Macromolecules, 1995, 28, 2787 CrossRef CAS.
- V. Jovanovski, B. Orel, R. Jese, A. S. Vuk, G. Mali, S. B. Hocevar, J. Grdadolnik, E. Stathatos and P. Lianos, J. Phys. Chem. B, 2005, 109, 14387 CrossRef CAS PubMed.
- N. N. Mobarak, A. Ahmad, M. P. Abdullah, N. Ramali and M. Y. A. Rahman, Electrochim. Acta, 2013, 92, 161 CrossRef CAS PubMed.
- X. Qian, N. Gu, Z. Cheng, X. Yang, E. Wang and S. Dong, J. Solid State Electrochem., 2001, 6, 8 CrossRef CAS.
- J. Bisquert, Phys. Chem. Chem. Phys., 2003, 5, 5360 RSC.
- L. Tao, Z. Huo, S. Dai, Y. Ding, J. Zhu, C. Zhang, B. Zhang, J. Yao, M. K. Nazeeruddin and M. Grätzel, J. Phys. Chem. C, 2014, 118, 16718 CAS.
- K. Xia, Z. Peng, Z. Hu, J. Zhang, Z. Hu and Y. Zhu, Electrochim. Acta, 2015, 153, 28 CrossRef CAS PubMed.
- L. Tao, Z. Huo, S. Dai, J. Zhu, C. Zhang, Y. Huang, B. Zhang and J. Yao, J. Power Sources, 2014, 262, 444 CrossRef CAS PubMed.
- S.-Y. Shen, R.-X. Dong, P.-T. Shih, V. Ramamurthy, J.-J. Lin and K.-C. Ho, ACS Appl. Mater. Interfaces, 2014, 6, 18489 CAS.
- J. Bisquert, F. Fabregat-Santiago, I. Mora-Sero, G. Garcia-Belmonte and S. Gimenez, J. Phys. Chem. C, 2009, 113, 17278 CAS.
- H. Chen, L. Zhu, H. Liu and W. Li, Electrochim. Acta, 2013, 105, 289 CrossRef CAS PubMed.
| This journal is © The Royal Society of Chemistry 2015 |

