Adsorption performance of low-cost gelatin–montmorillonite nanocomposite for Cr(III) ions
Jinghong Qiu†
,
Shihua Dong†,
Haibo Wang ,
Xu Cheng* and
Zongliang Du*
Textile Institute, College of Light Industry, Textile and Food Science Engineering, Sichuan University, Chengdu, 610065, China. E-mail: scuchx@163.com; dzl407@163.com; Tel: +86-28-85401296
First published on 18th June 2015
Abstract
A gelatin–montmorillonite (G–MMT) nanocomposite was prepared by Na–montmorillonite (Na–MMT) and a biomaterial gelatin through an intercalation method. Samples were studied by XRD and FTIR and the results indicated that gelatin has been successfully intercalated into the interlayers of MMT. The effect of G–MMT nanocomposite adsorbed Cr(III) from aqueous solution was investigated in terms of the initial concentration of Cr(III), adsorption temperature and solution pH. The maximum adsorption capacity was 52.91 mg g−1 for an initial Cr(III) concentration of 300 mg L−1, temperature of 343 K and pH value of 5.5. Furthermore, kinetic and isotherm models were used for the description of the adsorption process. The results demonstrated that the adsorption process was fitted to a pseudo-second-order kinetic model and the equilibrium data gave good fits with both Freundlich and Langmuir equations. The thermodynamic study revealed the endothermic and non-spontaneous nature of the adsorption process, and the increased randomness at the solid–solution interface.
Introduction
The presence of heavy metals in aquatic environment is of great harm to the environment and human health due to their high toxicity, non-degradation and accumulation in food chain.1,2 Trivalent chromium is one of the toxic elements which is generated from leather tanning, textile dying, metal finishing, electroplating, ceramic and glass manufacturing.3 Especially in the leather tanning industry, chromium is not fully utilized, resulting in the accumulation of Cr(III) ions higher than the maximum allowable levels. Therefore, it is desirable that wastewater should be treated for the removal of Cr(III) ions before being discharged into the environment. The majority of Cr(III) in wastewater can be removed by chemical precipitation, however, it is very hard to eliminate trace Cr(III) in wastewater.4 More importantly, the trace amount of Cr(III) can be further oxidized to its hexavalent form which is carcinogenic and teratogenic, and 500 times more toxic than the trivalent form.5,6 Therefore, it is of great importance to seek effective ways to remove trace Cr(III) from wastewater.Various methods have been used for removing chromium from wastewater such as chemical precipitation, ion exchange, membrane separation, biosorption and adsorption.4,7–10 Among these techniques, adsorption or biosorption, has been considered as the most feasible method in eliminating heavy metals to a lower level over a wide pH range. Activated carbon is widely used as adsorbent with excellent adsorption properties.11 However, high cost limited the large scale application of activated carbon. Therefore, development of adsorbent materials which are both efficient and economic is desirable.
Gelatin is a typical protein hydrolyzed form collagen, and is abundant and inexpensive.12 Gelatin molecules contain a variety of functional groups such as carboxyl and amine groups, which could connect with Cr(III) ions via coordination bonds.13,14 However, the water-soluble property and low molecular weight of gelatin limit its application in removing Cr(III) from wastewater. Montmorillonite (MMT) is a natural, abundant and inexpensive clay with a unique layered structure, pocessing excellent chemical and mechanical stability and large exchange capacity.15 The adsorption performance of MMT and modified MMT has been investigated, and it turned out to be a potential material for heavy metal adsorption.2,16–18
Herein, an effective adsorbent G–MMT nanocomposite was prepared by intercalation of gelatin into MMT, it was expected to make use of the advantages of both gelatin and MMT. Furthermore, the adsorption performance of the novel adsorbent G–MMT nanocomposite for Cr(III) was investigated, including the parameters affecting the adsorption and the mechanism of the adsorption process.
Experiments
Materials
Pristine Na–MMT with a cation exchange capacity (CEC) of 800 mmol/100 g was obtained from Xingda Industry and Trade Co., Sichuan, China. Other reagents used were all analytical grade and purchased form Kelong Chemistry Industry Co., Chengdu, China. The molecular weight of gelatin is less than 100 kDa, and the isoelectric point is about 4.8. All the solutions were prepared with deionized water made in laboratory. The stock solution of Cr(III) was prepared from Cr2(SO4)3·6H2O and serially diluted to working solutions of varying initial concentrations for experimental purposes.Preparation and characterization of the G–MMT nanocomposite
The gelatin solution was prepared by dissolving 2.4 g of gelatin in 100 mL distilled water and its pH was adjusted to 5.0, the MMT suspension was prepared by dispersing 8.0 g of MMT in 100 mL distilled water and its pH was adjusted to 5.0, too. The gelatin solution and MMT suspension were mixed at 343 K under constant stirring for 2 hours. The studied temperatures for G–MMT nanocomposite preparation included 303, 313, 323, 333, 343, and 353 K, and the change of crystallographic spacing (Δd) was 0.30, 0.31, 0.28, 0.33, 0.38, and 0.37 nm, respectively, and from these the optimum temperature was chosen at 343 K. Then, the suspension was centrifuged at 4000 rpm, the supernatant liquid was discarded and the residue was washed with distilled water until the supernatant was free of gelatin. The residue was dried at 313 K and ground, the powder between 200 and 300 mesh was reserved. The G–MMT nanocomposite was kept in the refrigerator before use.The powder was directly used to determine the changes of interlayer spacing via X-ray diffractometry (DX-1000 instrument, Dandong, Fangyuan Instrument Co. Ltd., Liaoning, China) using Cu/Kα radiation (25 mA and 40 kV). The scan range was 2.5–10° and the incident wavelength was 0.154 nm. The crystallographic spacing (d) was calculated by the Bragg’s equation (2d![[thin space (1/6-em)]](https://www.rsc.org/images/entities/char_2009.gif) sin
sin![[thin space (1/6-em)]](https://www.rsc.org/images/entities/char_2009.gif) θ = nλ). The G–MMT nanocomposite along with Na–MMT was also characterized by infrared spectroscopy (Nicolet560) in KBr disks, the spectra were scanned in the range from 4000 to 400 cm−1. The surface morphology of the Na–MMT and G–MMT nanocomposite were characterized by SEM (SPA400, Japan), the samples were coated with gold to improve the quality of the micrographs.
θ = nλ). The G–MMT nanocomposite along with Na–MMT was also characterized by infrared spectroscopy (Nicolet560) in KBr disks, the spectra were scanned in the range from 4000 to 400 cm−1. The surface morphology of the Na–MMT and G–MMT nanocomposite were characterized by SEM (SPA400, Japan), the samples were coated with gold to improve the quality of the micrographs.
Adsorption procedure
All batch experiments were conducted in 250 mL Erlenmeyer flasks with 200 mL of the Cr(III) solution. The initial concentration used in the tests ranged from 25 to 300 mg L−1. 1 M NaOH or 1 M HCl was used to adjust the pH of the solution. The Cr(III) solution was agitated in a thermostatic water bath until the temperature was stable, then 200 mg of the adsorbent was added to the solutions. An aliquot of the suspension was taken from the conical flask at different time intervals and then centrifuged. The supernatant was analyzed for the concentration of Cr(III).In order to estimate, Cr(III) was first oxidized to its hexavalent form by KMnO4 in acid conditions. The Cr(VI) concentration was determined by the diphenyl carbazide method19 by adding a solution of 1,5-diphenyl carbazide in acetone and measuring the absorbance using a UV/Vis spectrophotometer (721, APL, Shanghai), at λmax 540 nm.
The adsorption capacity at equilibrium (Qe, mg g−1) and removal rate (η, %) of Cr(III) was calculated from eqn (1) and (2), respectively.
 | (1) |
 | (2) |
Results and discussion
Characterization of G–MMT nanocomposite
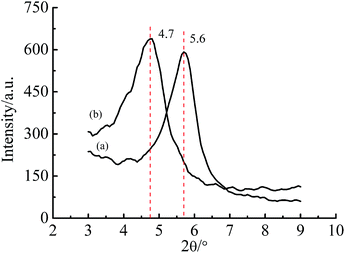
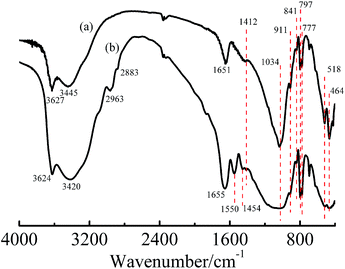
XRD patterns are shown in Fig. 1. The interlayer spacing of Na–MMT was 1.5 nm (2θ = 5.6°), and G–MMT 1.9 nm (2θ = 4.7°). The results demonstrated that the interlayer spacing of MMT had increased due to the intercalation of gelatin.The FTIR spectra are shown in Fig. 2. The characteristic peaks of Na–MMT (Fig. 2(a)) are illustrated as follows. The absorption peaks at 1034 and 797 cm−1 corresponded to Si–O stretching vibration, peaks at 911, 841 and 777 cm−1 corresponded to Al–O, Fe–O and Mg–O bonds’ stretching vibration, and peaks at 517 and 464 cm−1 indicated the angle deformation of Si–O–M bond, where M could be Mg, Al or Fe, stretching vibration peaks of –OH at 3627 and 3445 cm−1 related to hydration water, the vibration absorption peak at 1651 cm−1 could be attributed to the H–O–H of water molecules held in the interlayer.17,20 All the peaks above were also shown in the spectrum of G–MMT, therefore, the skeleton of the layered silicate including the water held in the interlayer remained unchanged. However, there were several shifts and new peaks in the spectrum of G–MMT. The shifted band to 3420 cm−1 corresponded to the stretching vibration of –NH2. New peaks at 1550 cm−1 correspond to the –C![[double bond, length as m-dash]](https://www.rsc.org/images/entities/char_e001.gif) O stretching vibration, and 1454 cm−1 corresponded to the –C–O and –O–H stretching vibrations, respectively, which proved the existence of –COOH.21 Peaks at 2963, 2883, and 1454 cm−1 related to the –C–H stretching and bending vibration peaks which exist in the molecules of gelatin. The results of FTIR also indicated that gelatin has intercalated into MMT.
O stretching vibration, and 1454 cm−1 corresponded to the –C–O and –O–H stretching vibrations, respectively, which proved the existence of –COOH.21 Peaks at 2963, 2883, and 1454 cm−1 related to the –C–H stretching and bending vibration peaks which exist in the molecules of gelatin. The results of FTIR also indicated that gelatin has intercalated into MMT.
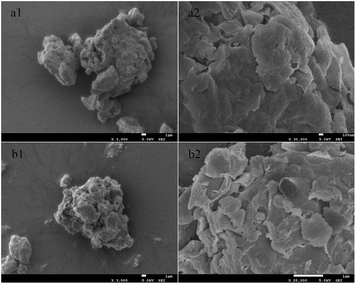
The morphology of Na–MMT and G–MMT nanocomposite is illustrated in Fig. 3, with rough surface, the coating of gelatin on the surface of MMT was clearly visible.
Effect of contact time and initial pH on Cr(III) adsorption
The effects of contact time and initial pH at 293 K are presented in Fig. 4 and 5. As shown in Fig. 4, 180 minutes was enough for the adsorption to reach an equilibrium, and more than 80% of the total Cr(III) was adsorbed in 60 minutes.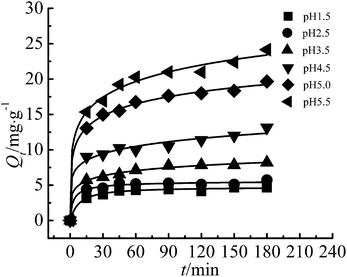 | ||
| Fig. 4 Effect of contact time on adsorption of Cr(III) (adsorbent dose: 200 mg, T: 293 K, C0: 50 mg L−1). | ||
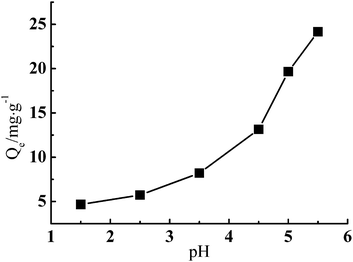
Fig. 5 shows that the adsorption of Cr(III) by G–MMT nanocomposite was highly pH-dependent and increased with an increase of pH value. The adsorption capacity at equilibrium (Qe, mg g−1) was 24.16 mg g−1 at a pH of 5.5, and higher pH values would precipitate Cr(III) as the Cr(OH)3 form.
The pH value affects both the form of the metal ions in solution and the species of the functional groups on the adsorbent,22 thus has a significant influence on the adsorption capacity. Gelatin is a typical ampholytic polyelectrolyte with an isoelectric point of about 4.8. As the pH increases, the number of protons decreases, and the number of negatively charged carboxylic groups increases, which provides more active sites for Cr(III) and minimizes the competition of protons with Cr(III).3,23 The common forms of Cr(III) in aqueous solution are Cr3+, Cr(OH)2+ and Cr(OH)2+. Below pH 2.0, the predominant species is Cr3+, at pH 5.0, Cr(OH)2+ species dominates, accounting for 70% of the total Cr(III).24 It can be concluded that Cr(III) was principally adsorbed in the form of Cr(OH)2+ on the G–MMT nanocomposite, while the form Cr3+ was weakly adsorbed.
Effect of temperature on Cr(III) adsorption
Fig. 6 shows that in the temperature range of the experiment, adsorption of Cr(III) was highly temperature-dependent and increased with increase of temperature. The Qe increased from 24.16 mg g−1 at 293 K to 38.27 mg g−1 at 343 K. The increase of Qe with higher temperature indicated the endothermic nature of the adsorption process. The temperature influenced the adsorption capacity in two way: first, the diffusion rate for the adsorbate to across the external boundary layer and within the pores, and second, the equilibrium capacity of the adsorbent for a particular adsorbate.25,26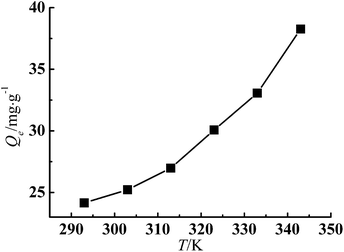 | ||
| Fig. 6 Effect of temperature on adsorption of Cr(III) (adsorbent dose: 200 mg, pH: 5.5, C0: 50 mg L−1). | ||
Effect of initial ion concentration of Cr(III)
The initial concentration provides the force to overcome the mass transfer resistance of metal ions between the adsorbent and aqueous solution.27 As is shown in Fig. 7, Qe increased with increase of the initial concentration while the removal rate (η, %) decreased. The reason is that when the initial concentration is high, more Cr(III) ions in the system could be adsorbed, as long as the active sites on the adsorbent were saturated. However, with the increase of the Cr(III) initial concentration, the relative adsorbent dose decreased, which attributed to insufficient active sites and a lower η. At lower initial concentration (C0: 25 mg g−1), η was 96.17%, which is of great significance for the practical removal of Cr(III) from wastewater.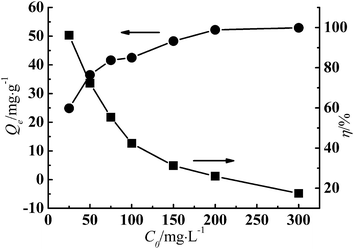 | ||
| Fig. 7 Effect of initial concentration on adsorption of Cr(III) (adsorbent dose: 200 mg, pH: 5.5, T: 343 K). | ||
Adsorption kinetics
It can be seen from Fig. 8 that the adsorption rate of Cr(III) on G–MMT nanocomposite was quite rapid, showing that in the first 5 minutes more than 50% of the total Cr(III) was adsorbed. At the start of the process, there were enough active sites on the G–MMT nanocomposite, therefore, Cr(III) ions are adsorbed at a fast rate. As the adsorption progresses, there were fewer unoccupied active sites on the adsorbent, and the adsorption needs to overcome greater transmission resistance, resulting in the mass transfer rate gradually slowing down, and it then tends to reach an equilibrium.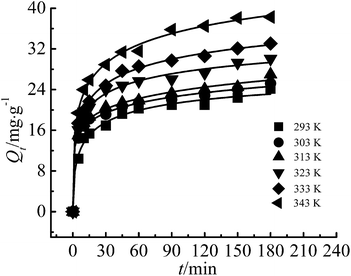 | ||
| Fig. 8 Adsorption kinetic curves of the adsorption of Cr(III) (adsorbent dose: 200 mg, pH: 5.5, C0: 50 mg L−1). | ||
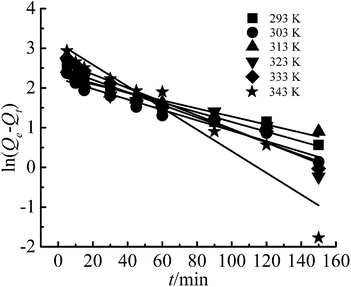
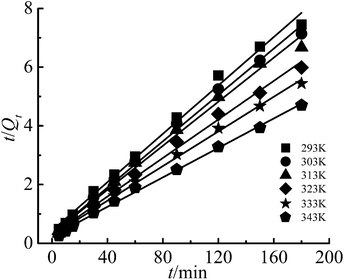
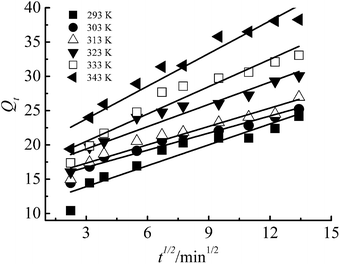
In this study, the Lagergren pseudo-first-order, pseudo-second-order, and intra-particle diffusion models were applied to analyze the adsorption process.
The linear form of Lagergren pseudo-first-order kinetic equation:28
 | (3) |
The linear form of pseudo-second-order kinetic equation:29
 | (4) |
The equation of intra-particle diffusion model:30
| Qt = kdift1/2 + C | (5) |
The pseudo-first-order and pseudo-second-order kinetic model indicate that the adsorption was determined by the chemical reaction step, while the intra-particle diffusion model is determined by the diffusion rate of Cr(III) ions inside the particle. The fitting figures of the kinetics models are shown in Fig. 9–11, and relevant data are listed in Table 1.
| T (K) | Qe,exp (mg g−1) | Pseudo-first-order model | Pseudo-second-order model | Intra-particle diffusion model | |||||
|---|---|---|---|---|---|---|---|---|---|
| Qe,cal (mg g−1) | k1 (min−1) | R2 | Qe,cal (mg g−1) | k2 × 103 (g mg−1 min−1) | R2 | kdif (mg g−1 min−1/2) | R2 | ||
| 293 | 24.16 | 10.65 | 0.028 | 0.900 | 24.27 | 3.929 | 0.993 | 1.017 | 0.892 |
| 303 | 25.22 | 9.39 | 0.030 | 0.954 | 25.35 | 4.822 | 0.995 | 0.832 | 0.942 |
| 313 | 26.98 | 9.94 | 0.023 | 0.941 | 26.66 | 4.380 | 0.992 | 0.894 | 0.940 |
| 323 | 30.07 | 12.48 | 0.036 | 0.895 | 30.47 | 3.860 | 0.995 | 1.084 | 0.909 |
| 333 | 33.07 | 14.69 | 0.040 | 0.963 | 33.88 | 3.255 | 0.997 | 1.331 | 0.926 |
| 343 | 38.27 | 22.89 | 0.063 | 0.903 | 39.87 | 2.637 | 0.997 | 1.590 | 0.932 |
The results showed that only the pseudo-second-order kinetic model had high correlation coefficients (R2) all above 0.99, and the calculated values of adsorption capacity (Qe,cal) were in good agreement with the experimental values (Qe,exp). Therefore, the pseudo-second-order kinetic model was a good fit for Cr(III) adsorption on G–MMT nanocomposite, which indicated that the adsorption process was the rate-determining step.21
Adsorption isotherm
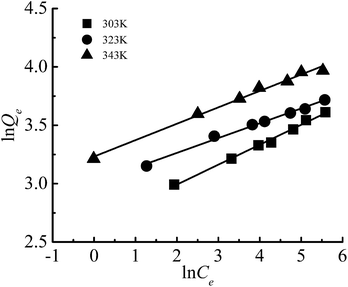
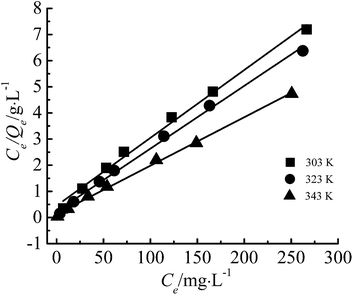
The adsorption isotherm is shown in Fig. 12. In this study, Freundlich and Langmuir isotherm models were employed to investigate the equilibrium of the adsorption.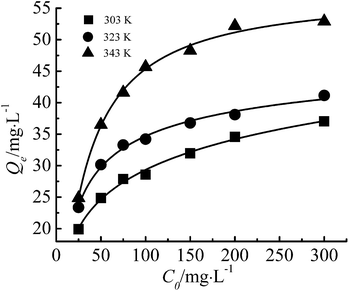 | ||
| Fig. 12 The adsorption isotherm curves of the adsorbent toward Cr(III) (adsorbent dose: 200 mg, pH: 5.5). | ||
The linear form of Freundlich isotherm:31
 | (6) |
![[thin space (1/6-em)]](https://www.rsc.org/images/entities/char_2009.gif) Qe versus ln
Qe versus ln![[thin space (1/6-em)]](https://www.rsc.org/images/entities/char_2009.gif) Ce.
Ce.
The linear form of Langmuir isotherm:32
 | (7) |
 | (8) |
The value of RL indicates the shape of the isotherm to be unfavorable (RL > 1), linear (RL = 1), favorable (0 < RL < 1), or irreversible (RL = 0).
Fig. 13 and 14 show the fitting figure of Freundlich, and Langmuir equations, and relevant data were listed in Table 2.
| T (K) | Freundlich | Langmuir | ||||||
|---|---|---|---|---|---|---|---|---|
| kF | n | R2 | 1/n | Qm | kL × 102 | R2 | RL | |
| 303 | 14.20 | 5.86 | 0.994 | 0.1–0.5 | 38.52 | 5.76 | 0.993 | 0–1 |
| 323 | 20.29 | 7.89 | 0.991 | 0.1–0.5 | 41.63 | 10.34 | 0.996 | 0–1 |
| 343 | 25.34 | 7.12 | 0.990 | 0.1–0.5 | 53.97 | 14.20 | 0.998 | 0–1 |
The R2 of Freundlich and Langmuir were all above 0.99, values of other parameters also denoted favorable adsorption and strong affinity towards Cr(III). Besides, the Qm (cal.) values from the Langmuir equation were extremely close to the experimental data. It can be concluded that the adsorption of Cr(III) on G–MMT nanocomposite followed both the Freundlich and Langmuir models. The Freundlich isotherm is applicable to non-specific adsorption on heterogeneous solid surfaces, while the Langmuir model is chemisorptive in nature with chemical forces of metal ions to the surface of the adsorbent. Following both of the models suggests the formation of a homogenous monolayer of Cr(III) ions at the outer surface of the adsorbent.34,35 This supports the assumption that the binding of Cr(III) ions may be caused by interactions with functional groups such as carboxyl groups of gelatin.36
Thermodynamics
The thermodynamic parameters were estimated to evaluate the feasibility and nature of the adsorption process. The enthalpy change (ΔH, kJ mol−1), free energy change (ΔG, kJ mol−1) and entropy change (ΔS, J mol−1 K−1) for the adsorption were calculated using the following equations:
 | (9) |
ΔG = −RT![[thin space (1/6-em)]](https://www.rsc.org/images/entities/char_2009.gif) ln ln![[thin space (1/6-em)]](https://www.rsc.org/images/entities/char_2009.gif) Kd Kd
| (10) |
 | (11) |
![[thin space (1/6-em)]](https://www.rsc.org/images/entities/char_2009.gif) Kd versus 1/T. The relevant values are given in Table 3.
Kd versus 1/T. The relevant values are given in Table 3.
| T (K) | Kd | ΔG (kJ mol−1) | ΔH (kJ mol−1) | ΔS (J mol−1 K−1) |
|---|---|---|---|---|
| 303 | 0.14 | 4.97 | 8.94 | 12.84 |
| 323 | 0.16 | 4.97 | ||
| 343 | 0.21 | 4.43 |
Positive values of ΔH and ΔS suggested the endothermic nature of the adsorption and the increased randomness at the solid–solution interface, respectively. And positive values of ΔG indicated the non-spontaneous nature of the reaction.
Analysis of the adsorption mechanism
It has been reported36,37 that the carboxyl groups had strong complexation with Cr(III), and Fig. 15 showed the model of protein and Cr(III) complex proposed by Oliveira.38 The adsorption of Cr(VI) on G–MMT nanocomposite was also carried out, but the adsorption capacity was very limited. The reason may be that there was no complex between Cr(VI) and gelatin, therefore, the process was only supported by electrostatic attraction. Gelatin is rich in carboxyl groups, and from all above results, it can be concluded that the adsorption of Cr(III) on G–MMT nanocomposite was mainly due to the complex of the carboxyl groups of gelatin with Cr(III), and electrostatic attraction plays little role in the process.As for the long chain of gelatin molecule, most of the carboxyl groups are exposed, while a small part of them were intercalated into the interlayers of MMT. As for whether the carboxyl groups in the interlayer of MMT took part in the adsorption of Cr(III), we assume they did. Because they didn’t react with MMT, and Cr(III) ions were small enough to enter the interlayer of MMT. Therefore, it could be inferred that the carboxyl groups of gelatin, both in and outside of MMT interlayers, were contributing in adsorbtion of Cr(III) mainly due to complexation.
Conclusion
In this study, a G–MMT nanocomposite was prepared by intercalation of gelatin into MMT. The adsorption performance of Cr(III) on the nanocomposite was investigated in terms of the initial concentration of Cr(III), adsorption temperature and solution pH. When the temperature was 343 K, the initial concentration of Cr(III) was 300 mg L−1 and the pH value was 5.5, the maximum adsorption capacity was 52.91 mg g−1, which is much larger than when montmorillonite alone is used as the adsorbent.2Further analysis gave information about the kinetics, isotherm and thermodynamics. Due to the high values of R2 and close data of Qe (cal.) with Qe (exp.), the adsorption was defined to be well fitted by the pseudo-second-order kinetic model. The parameters obtained from Langmuir and Freundlich models suggested both models could be regarded as sufficient to describe the adsorption of Cr(III) on G–MMT nanocomposite, and the nanocomposite had a large affinity for Cr(III).
ΔH > 0 and ΔS > 0 suggested the endothermic nature of the adsorption and the increased randomness at the solid–solution interface, respectively. ΔG > 0 indicated a non-spontaneous nature of the adsorption.
Hence, this study proved that G–MMT nanocomposite was an alternative and effective adsorbent for Cr(III) ions. The low-cost and high adsorption capacity demonstrated that G–MMT nanocomposite has great potential to be an economical and efficient adsorbent for the removal of Cr(III) from waste water.
Acknowledgements
This work was funded by the National Natural Science Foundation of China (no. 51073101) and support plan of Science and Technology Department of Sichuan Province, China (no. 2010GZ0177).Notes and references
- S. J. Park and W. Y. Jung, J. Colloid Interface Sci., 2001, 243, 316–320 CrossRef CAS.
- J. Zhu, V. Cozzolino, M. Pigna, Q. Huang, A. G. Caporale and A. Violante, Chemosphere, 2011, 84, 484–489 CrossRef CAS PubMed.
- Z. H. Yang, S. Xiong, B. Wang, Q. Li and W. C. Yang, J. Cent. South Univ., 2013, 20, 1319–1325 CrossRef CAS PubMed.
- M. A. Almeida and R. A. R. Boaventura, Waste Manage., 1997, 17, 201–209 CrossRef CAS.
- V. Sarin and K. K. Pant, Bioresour. Technol., 2006, 97, 15–20 CrossRef CAS PubMed.
- J. Li, C. Yao, Y. Liu, D. Li, B. Zhou and W. Cai, J. Hazard. Mater., 2012, 221, 56–61 CrossRef PubMed.
- F. Gode and E. Pehlivan, J. Hazard. Mater., 2003, 100, 231–243 CrossRef CAS.
- J. Konczyk, C. Kozlowski and W. Walkowiak, Desalination, 2010, 263, 211–216 CrossRef CAS PubMed.
- R. Aravindhan, A. Fathima, M. Selvamurugan, J. R. Rao and U. N. Balachandran, Clean Technol. Environ., 2012, 14, 727–735 CrossRef CAS.
- S. S. Tahir and R. Naseem, Sep. Purif. Technol., 2007, 53, 312–321 CrossRef CAS PubMed.
- R. Leyvaramos, L. Fuentesrubio, R. M. Guerrerocoronado and J. Mendozabarron, J. Chem. Technol. Biotechnol., 1995, 62, 64–67 CrossRef CAS PubMed.
- M. C. Gomez-Guillen, B. Gimenez, M. E. Lopez-Caballero and M. P. Montero, Food Hydrocolloids, 2011, 25, 1813–1827 CrossRef CAS PubMed.
- I. G. Vinichenko and E. A. Chernushenko, Russ. J. Inorg. Chem., 2005, 50, 187–190 Search PubMed.
- C. Tkaczyk, O. L. Huk, F. Mwale, J. Antoniou, D. J. Zukor, A. Petit and M. Tabrizian, J. Biomed. Mater. Res., Part A, 2010, 94, 214–222 CrossRef PubMed.
- J. Chen, X. Hong, Y. Zhao, Y. Xia, D. Li and Q. Zhang, J. Mater. Sci., 2013, 48, 7708–7717 CrossRef CAS.
- K. G. Bhattacharyya and S. Sen Gupta, Adv. Colloid Interface Sci., 2008, 140, 114–131 CrossRef CAS PubMed.
- A. Bakhti, Z. Derrice, A. Iddou and M. Larid, Eur. J. Soil Sci., 2001, 52, 683–692 CrossRef CAS.
- Z. Qin, P. Gang and S. Wei, Adsorption, 2013, 19, 709–715 CrossRef.
- APHA, AWWA, WPCF, Standard Methods for the Examination of Water and Wastewater, American Public Health Association, Washington DC, 20th edn, 1998 Search PubMed.
- W. Li, Y. K. Tang, Y. T. Zeng, Z. F. Tang, D. W. Liang and W. W. Cui, Chem. Eng. J., 2012, 193–194, 88–95 CAS.
- D. Mohan, K. P. Singh and V. K. Singh, J. Hazard. Mater., 2006, 135, 280–295 CrossRef CAS PubMed.
- H. Esfandian, M. Jafari, M. Alizadeh, H. T. Rahmati and R. Katal, J. Vinyl Addit. Technol., 2012, 18, 250–260 CrossRef CAS PubMed.
- Y. Wu, S. Zhang, X. Guo and H. Huang, Bioresour. Technol., 2008, 99, 7709–7715 CrossRef CAS PubMed.
- R. Fonseca-Correa, L. Giraldo and J. Carlos Moreno-Pirajan, J. Anal. Appl. Pyrolysis, 2013, 101, 132–141 CrossRef CAS PubMed.
- J. H. Chen, H. T. Xing, H. X. Guo, G. P. Li, W. Weng and S. R. Hu, J. Hazard. Mater., 2013, 248, 285–294 CrossRef PubMed.
- L. Khezami and R. Capart, J. Hazard. Mater., 2005, 123, 223–231 CrossRef CAS PubMed.
- G. Donmez and Z. Aksu, Process Biochem., 2002, 38, 751–762 CrossRef CAS.
- Y. S. Ho and G. McKay, Water Res., 1999, 33, 578–584 CrossRef CAS.
- Y. S. Ho and G. McKay, Process Saf. Environ. Prot., 1998, 76, 183–191 CrossRef CAS.
- W. J. Webber Jr and J. C. Morris, J. Sanit. Eng. Div., Am. Soc. Civ. Eng., 1963, 89, 31–60 Search PubMed.
- H. M. F. Freundlich, Z. Phys. Chem., 1906, 57, 385–470 CAS.
- I. Langmuir, J. Am. Chem. Soc., 1918, 40, 1361–1403 CrossRef CAS.
- K. R. Hall, L. C. Eaglaton, A. Acrivos and T. Vermeulan, Ind. Eng. Chem. Fundam., 1966, 5, 212–223 CAS.
- Q. Li, J. Zhai, W. Zhang, M. Wang and J. Zhou, J. Hazard. Mater., 2007, 141, 163–167 CrossRef CAS PubMed.
- D. D. Das, R. Mahapatra, J. Pradhan, S. N. Das and R. S. Thakur, J. Colloid Interface Sci., 2000, 232, 235–240 CrossRef CAS PubMed.
- J. Romero-Gonzalez, J. R. Peralta-Videa, E. Rodriguez, M. Delgado and J. L. Gardea-Torresdey, Bioresour. Technol., 2006, 97, 178–182 CrossRef CAS PubMed.
- P. Lodeiro, A. Fuentes, R. Herrero and M. E. Sastre de Vicente, Environ. Chem., 2008, 5, 355–365 CrossRef CAS.
- D. Q. L. Oliveira, M. Goncalves, L. C. A. Oliveira and L. R. G. Guilherme, J. Hazard. Mater., 2008, 151, 280–284 CrossRef CAS PubMed.
Footnote |
| † These authors contributed equally to this paper. |
| This journal is © The Royal Society of Chemistry 2015 |

