DOI:
10.1039/C5RA09515H
(Paper)
RSC Adv., 2015,
5, 58393-58402
Cobalt(III) acetylacetonate initiated RAFT polymerization of acrylonitrile and its application in removal of methyl orange after electrospinning†
Received
21st May 2015
, Accepted 22nd June 2015
First published on 23rd June 2015
Abstract
This study describes reversible addition–fragmentation chain-transfer (RAFT) polymerization initiated by cobalt(III) acetylacetonate (Co(acac)3). With Co(acac)3 as the initiator, RAFT polymerization of acrylonitrile was achieved at 90 °C mediated by 2-cyanoprop-2-yl dithionaphthalenoate. The polymerization exhibited “living”/controlled characteristics with a molar mass distribution as low as 1.25. Homogeneous polyacrylonitrile nanofibers (PAN-nFs) were produced via the electrospinning technique. FTIR, SEM and TGA analyses revealed aminated-PAN-nFs (APAN-nFs) were successfully obtained via ethylenediamine grafting onto the surface of PAN-nFs. The adsorption interaction between methyl orange (MO) dye and APAN-nFs is discussed in detail. The maximum saturation adsorption capacity was 102 mg g−1. The adsorption kinetics followed a pseudo-second-order model. The Langmuir model was better for interpreting the isothermal process for MO and APAN-nFs. The Dubinin–Radushkevich isothermal model indicated that the adsorption proceeded chemically. Intraparticle diffusion was not the only rate-limiting step. The thermodynamics properties indicated the adsorption process was exothermic and spontaneous in nature. The MO dye adsorbed by APAN-nFs could be reversibly desorbed by an aqueous solution of pH = 1. APAN-nFs could be recycled efficiently.
Introduction
With the development of textile and printing industries, more attention has been paid to the discharge of an enormous amount of anionic dyes into rivers and lakes.1 This has caused severely bad effects on human beings, aquatic flora and aquatic micro-organisms owing to the anionic dyes themselves being highly toxic and inhibiting the re-oxygenation in water.2 Consequently, it is extremely urgent to remove or drive down anionic dyes until their emissions conform to the standard level. Nowadays filtration, reverse osmosis, flocculation, precipitation, evaporation, degradation and adsorption technologies3–9 have been explored to deal with anionic dyes. Among them, the adsorption method, in which fibrous chelating polymers are used as the novel adsorbent, has proved to be a reliable and effective technique due to its flexibility, easy operation, low operation cost, and minimum sludge production.10 Many researchers11,12 have tried to introduce amino groups into polymers as the anionic dyes can form chelate complexes with these groups. From the viewpoint of supramolecular chemistry, anion-chelated complexes are similar to but different from host–guest complexes, in which two or more molecules are held together in unique structural relationships by electrostatic forces. Generally, chelate compounds are classified into three categories: corands, cryptands and podands.13,14 Corands and cryptands are dominated by chelate/macrocyclic effects and chelate/macrobicyclic effects, respectively, whereas podands are dominated by the chelate effect only. Recently, as one typical chelate fiber of the podand type, polyacrylonitrile (PAN)-based nanofibers (PAN-nFs) have emerged as a superior polymer for introducing amino groups. The modified PAN-nFs have attracted attention for their high porosity, high gas permeability, and most importantly large surface area per unit mass.15,16
Generally, nFs can be easily produced by the electrospinning technique since electrical forces were first applied to polymeric filaments by A. Formhals.17 Compared with conventional physical-chemical methods (molecule self-assemblies, physical vapor deposition, etc.), the electrospinning technique distinguishes itself due to its simple devices, and its ability to manufacture one-dimensional nanomaterials with high slenderness ratio.18–21 To the best of our knowledge, the commercially available PAN-nFs are prone to looseness, tangle and fracture, and are prepared by traditional radical polymerization (RP) methods with relatively low molecular weights (MW) and poorly controlled molecular weight distributions (MWDs).22 Theoretically, PAN with relatively broad MWDs usually has a wide distribution of hydrodynamic radii and relaxation times of chains in solution. During the process of PAN stretching, the presence of the relatively small PAN chains, which have a smaller hydrodynamic volume and consequently a lower local chain entanglement density, acts as a weak link that causes a premature break-up of local ‘chain–chain coupling’ within the jet resulting in the formation of PAN droplets.23 Compared with synthesis by RP techniques, electrospinning of polymers based upon reversible-deactivation radical polymerization (RDRP) techniques can produce continuous nFs that are exceptionally long and uniform in diameter with inherent excellent control over MW and MWDs. Providing that PAN is monodisperse, all the PAN chains in solution have nearly the same hydrodynamic volume that results in a very sharp spectrum of the relaxation times. This is a key element for the PAN stretching process induced by the electrically driven bending instabilities during electrospun fiber formation process.24
Among RDRP systems, transition metal salts, especially cobalt compounds,25–29 have played “living”/controlled roles in the polymerization of reactive vinyl monomers. Greatly different from cobalt(II) acetylacetonate (Co(acac)2)-capped chains with C–Co σ bonds, cobalt(III) acetylacetonate (Co(acac)3) can act as an initiator due to the generation of acetylacetone group (acac).30 Actually, transition metal acetylacetonate (Mt(acac)x) has successfully initiated the polymerization of styrene (St) in combination with organic halides (R–X).31 Of particular note is that the MWD of polystyrene mediated by Co(acac)3/benzyl bromide was as high as 1.63 due to the occurrence of chain transfer reaction and bi-radical termination.30 However, unlike reactive monomers (MMA, St, etc.), acrylonitrile (AN) is special for its strong polarity of cyano groups, causing a negative effect on the conjugated structure. As a result, it is more challenging to synthesize well-defined PAN mediated by Mt(acac)x. On the other hand, with the addition of chain transfer agents (CTAs) into the RP method one can obtain well-defined polymers, namely the use of the reversible addition–fragmentation chain-transfer (RAFT) polymerization technique.32–35 Several kinds of RAFT agents have been appropriately applied to the synthesis of PAN and its copolymers in the presence of azo-initiators.36–38 However, only manganese acetylacetonate (Mn(acac)3) has been reported as an initiator in polymerization of AN with RAFT agents by our research group until now.39 In this work, we first synthesized PAN with Co(acac)3 as the initiator instead of azo compounds and 2-cyanoprop-2-yl dithionaphthalenoate (CPDN) as the RAFT agent. PAN-nFs were produced using the electrospinning technique. The adsorbent APAN-nFs was obtained after amination of PAN-nFs. The material possessed good chelating ability with dyes and methyl orange (MO) adsorption and desorption are discussed in detail.
Results and discussion
Preparation of the adsorbent APAN-nFs
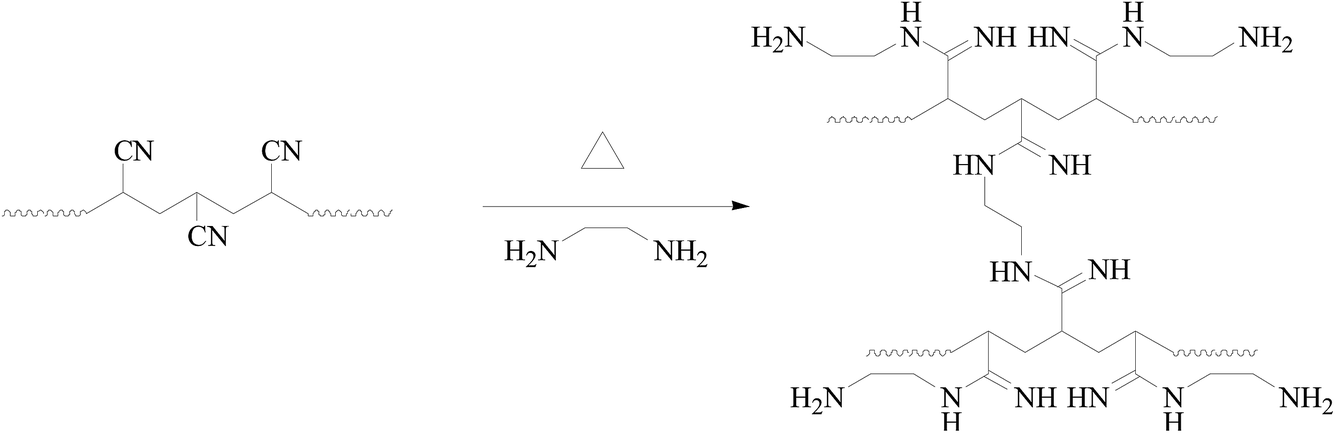
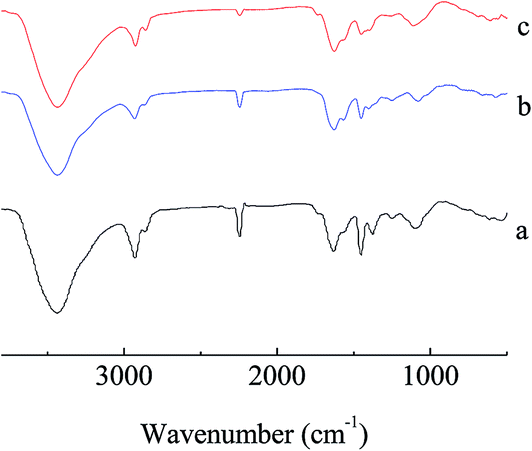
The details of the polymerization of AN can be found in Tables TS1–TS2, and Fig. S1–S4, ESI.† For homogeneous PAN-nFs, the PAN polymer with the narrowest molecular weight distribution (Mw/Mn = 1.25) was selected to be the electrospinning precursor. The concentration of PAN in DMF was set to be 10%. The homogeneous solution was spun on an electrospinning apparatus. The ideal synthetic route of the adsorbent APAN-nFs that was aminated by ethylenediamine (EDA) onto the surface of PAN-nFs is illustrated in Scheme 1. The nitrogen content was observed as 28%, 42%, and 56% at 5 h when the temperature was 90 °C, 100 °C, and 110 °C, respectively. The conversion of nitrile groups in PAN-nFs increased with increasing temperature, which was attributed to the endothermic nature of the reaction. The result was the same as that of Mehdi Rafizadeh's research group.40 The presence of functional groups was confirmed by FTIR spectroscopy, as illustrated in Fig. 1. The intensity of distinctive stretching vibration of C![[triple bond, length as m-dash]](https://www.rsc.org/images/entities/char_e002.gif) N at 2241 cm−1 became weaker in the spectra of APAN-nFs (Fig. 1(b) and (c)) than in that of PAN-nFs (Fig. 1(a)). Furthermore, the stretching vibration of CN became much weaker (Fig. 1(b) vs. (c)) when the modification was carried out at higher temperature, indicating that the reaction was quantitative at 110 °C. The peak at 3550 cm−1, which was attributed to N–H stretching vibration, increased in intensity for APAN-nFs (Fig. 1(b) and (c)) compared with PAN-nFs (Fig. 1(a)). Besides, the intensity of the absorption band at 1650 cm−1 increased, comparing Fig. 1(a)–(c), attributed to the formation of amidine group N–C
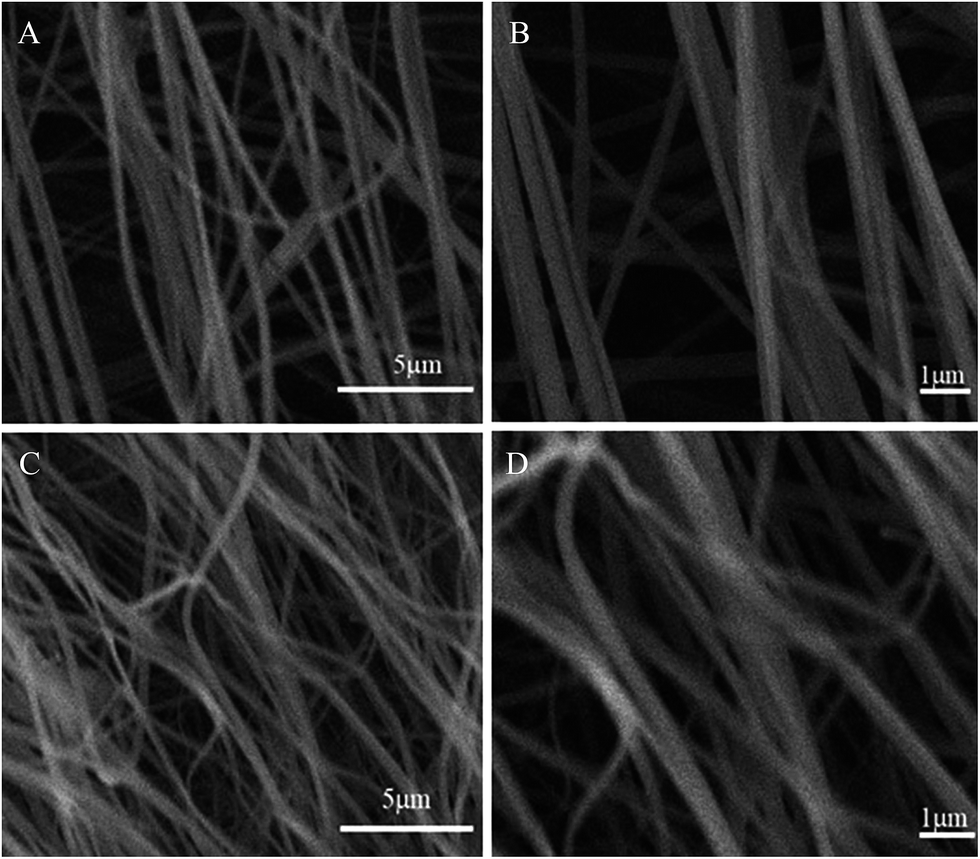
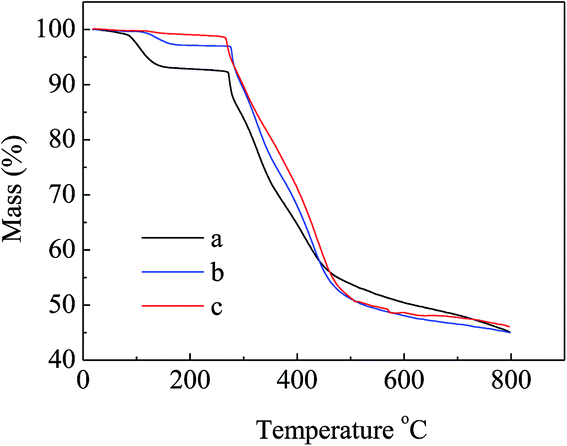
N at 2241 cm−1 became weaker in the spectra of APAN-nFs (Fig. 1(b) and (c)) than in that of PAN-nFs (Fig. 1(a)). Furthermore, the stretching vibration of CN became much weaker (Fig. 1(b) vs. (c)) when the modification was carried out at higher temperature, indicating that the reaction was quantitative at 110 °C. The peak at 3550 cm−1, which was attributed to N–H stretching vibration, increased in intensity for APAN-nFs (Fig. 1(b) and (c)) compared with PAN-nFs (Fig. 1(a)). Besides, the intensity of the absorption band at 1650 cm−1 increased, comparing Fig. 1(a)–(c), attributed to the formation of amidine group N–C![[double bond, length as m-dash]](https://www.rsc.org/images/entities/char_e001.gif) N. This suggests that the nitrile group of PAN-nFs was modified successfully and the higher temperature was more feasible in terms of modification. At first, PAN-nFs appeared to be flexible and white in color. However, their appearance changed with increasing modification temperature. The color of fibers was observed to change from white to light yellow to pale orange when the grafting process was conducted at 90 °C, 100 °C, and 110 °C, respectively. Furthermore, APAN-nFs became fragile with higher temperature. A solid foundation was laid for adsorption of MO in that large amounts of chelating sites were present in the APAN-nFs. SEM images depict the appearance of PAN-nFs and APAN-nFs obtained at high and low magnification, as shown in Fig. 2. Though the micrograph and diameter distributions of APAN-nFs modified at 110 °C (Fig. 2(C) and (D)) were similar to those of PAN-nFs (Fig. 2(A) and (B)), the nanofiber mats were observed to slightly contract in size. This effect was based on the physical nature of the thread and fibers which make up the thread. In order to manufacture an elongated form, the fibers were produced by a hot extrusion process via the electrospinning technique. PAN-nFs were known to be in a high-energy metastable state. While subjected to a wet heating process, PAN-nFs relaxed to a lower energy state. Consequently, the fibers would contract.40 On the other hand, APAN-nFs were insoluble in DMF even after 15 days while a comparable amount of PAN-nFs possessed excellent solubility after 0.5 h under the same conditions. This indicates that the interior of APAN-nFs was cross-linked to some extent. As was reported,41 PAN-nFs segments in low-order area started relaxing at 90 °C, rendering solution into an amorphous region, hence increasing contact between EDA and PAN-nFs. When the temperature reached 105 °C or even higher, sequence chain segment in the amorphous region began to move and PAN-nFs exhibited obvious swelling property. EDA could easily pass into the interior of PAN-nFs, resulting in formation of crosslinking structure. This was consistent with the results reported by Abdouss' research group and the patent of Borrell's research group.42–44 Thermal stabilities of PAN-nFs and their aminated derivative APAN-nFs at different temperatures were determined under nitrogen atmosphere at a heating rate of 10 K min−1 (Fig. 3). PAN-nFs showed multistage thermogravimetric profiles as shown in Fig. 3(a). The first weight loss was slight due to the production of ammonia gas and hydrogen cyanide during the cyclization process below 150 °C, while the second was more severe due to amounts of hydrogen and methane volatilization in the course of cyclic structure decomposition from 280 °C to 500 °C. Compared with Fig. 3(a), though the peaks weakened, there were still two weight loss peaks in Fig. 3(b) owning to the incomplete modification at 90 °C. When the modification proceeded below 110 °C, as shown in Fig. 3(c), only one weight loss peak was present between 270 °C and 500 °C. This may be caused by damage of nitrile groups after amination, leading to failure of cyclization.
N. This suggests that the nitrile group of PAN-nFs was modified successfully and the higher temperature was more feasible in terms of modification. At first, PAN-nFs appeared to be flexible and white in color. However, their appearance changed with increasing modification temperature. The color of fibers was observed to change from white to light yellow to pale orange when the grafting process was conducted at 90 °C, 100 °C, and 110 °C, respectively. Furthermore, APAN-nFs became fragile with higher temperature. A solid foundation was laid for adsorption of MO in that large amounts of chelating sites were present in the APAN-nFs. SEM images depict the appearance of PAN-nFs and APAN-nFs obtained at high and low magnification, as shown in Fig. 2. Though the micrograph and diameter distributions of APAN-nFs modified at 110 °C (Fig. 2(C) and (D)) were similar to those of PAN-nFs (Fig. 2(A) and (B)), the nanofiber mats were observed to slightly contract in size. This effect was based on the physical nature of the thread and fibers which make up the thread. In order to manufacture an elongated form, the fibers were produced by a hot extrusion process via the electrospinning technique. PAN-nFs were known to be in a high-energy metastable state. While subjected to a wet heating process, PAN-nFs relaxed to a lower energy state. Consequently, the fibers would contract.40 On the other hand, APAN-nFs were insoluble in DMF even after 15 days while a comparable amount of PAN-nFs possessed excellent solubility after 0.5 h under the same conditions. This indicates that the interior of APAN-nFs was cross-linked to some extent. As was reported,41 PAN-nFs segments in low-order area started relaxing at 90 °C, rendering solution into an amorphous region, hence increasing contact between EDA and PAN-nFs. When the temperature reached 105 °C or even higher, sequence chain segment in the amorphous region began to move and PAN-nFs exhibited obvious swelling property. EDA could easily pass into the interior of PAN-nFs, resulting in formation of crosslinking structure. This was consistent with the results reported by Abdouss' research group and the patent of Borrell's research group.42–44 Thermal stabilities of PAN-nFs and their aminated derivative APAN-nFs at different temperatures were determined under nitrogen atmosphere at a heating rate of 10 K min−1 (Fig. 3). PAN-nFs showed multistage thermogravimetric profiles as shown in Fig. 3(a). The first weight loss was slight due to the production of ammonia gas and hydrogen cyanide during the cyclization process below 150 °C, while the second was more severe due to amounts of hydrogen and methane volatilization in the course of cyclic structure decomposition from 280 °C to 500 °C. Compared with Fig. 3(a), though the peaks weakened, there were still two weight loss peaks in Fig. 3(b) owning to the incomplete modification at 90 °C. When the modification proceeded below 110 °C, as shown in Fig. 3(c), only one weight loss peak was present between 270 °C and 500 °C. This may be caused by damage of nitrile groups after amination, leading to failure of cyclization.
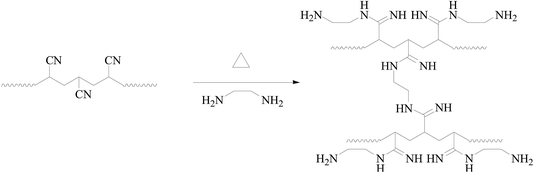 |
| | Scheme 1 The ideal synthesis of APAN-nFs. | |
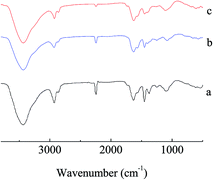 |
| | Fig. 1 FTIR spectra of the raw PAN-nFs and modified PAN-nFs at various reaction temperatures: (a) raw PAN-nFs and raw PAN-nFs after reaction at (b) 90 °C and (c) 110 °C. | |
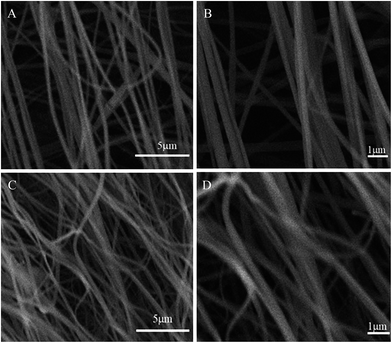 |
| | Fig. 2 SEM images of (A), (B) raw PAN-nFs and (C), (D) APAN-nFs. | |
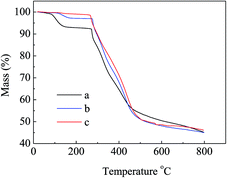 |
| | Fig. 3 Thermogravimetric curves for (a) raw PAN-nFs, and modified PAN-nFs at various reaction temperatures of (b) 90 °C and (c) 110 °C. | |
Adsorption capacity
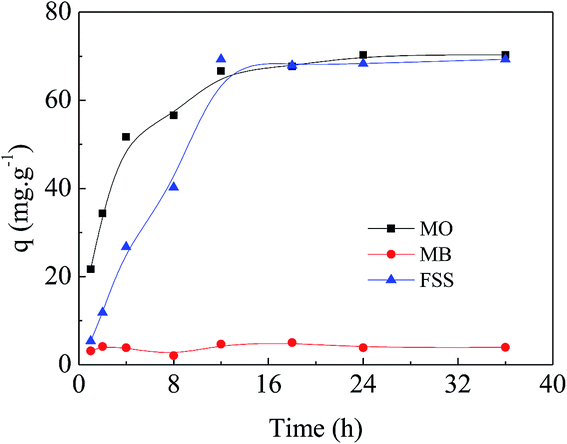
Investigation of the adsorption interaction in solutions of various pH. Firstly, adsorption experiments of the selected three dyes, i.e. MO, methylene blue (MB) and fluorescein sodium (FSS), were conducted with the same concentration of 4 × 10⁻⁴ mmol mL−1 at 20 °C in aqueous solution. As exhibited in Fig. 4, APAN-nFs showed the maximum adsorption capacity towards MO compared with MB and FSS. The minimum adsorption capacity of FSS is attributed to itself being a cationic dye. As a result, MO was the optimal candidate in the following experiments.
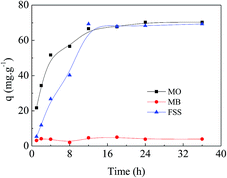 |
| | Fig. 4 Adsorption of different dyes onto APAN-nFs for the same concentration of 4 × 10⁻⁴ mmol mL−1 at 20 °C in aqueous solution. | |
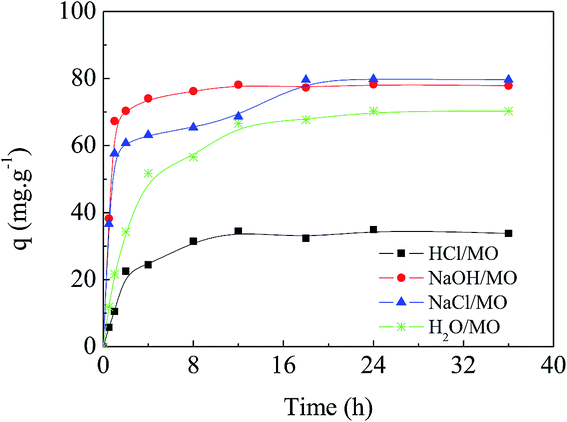
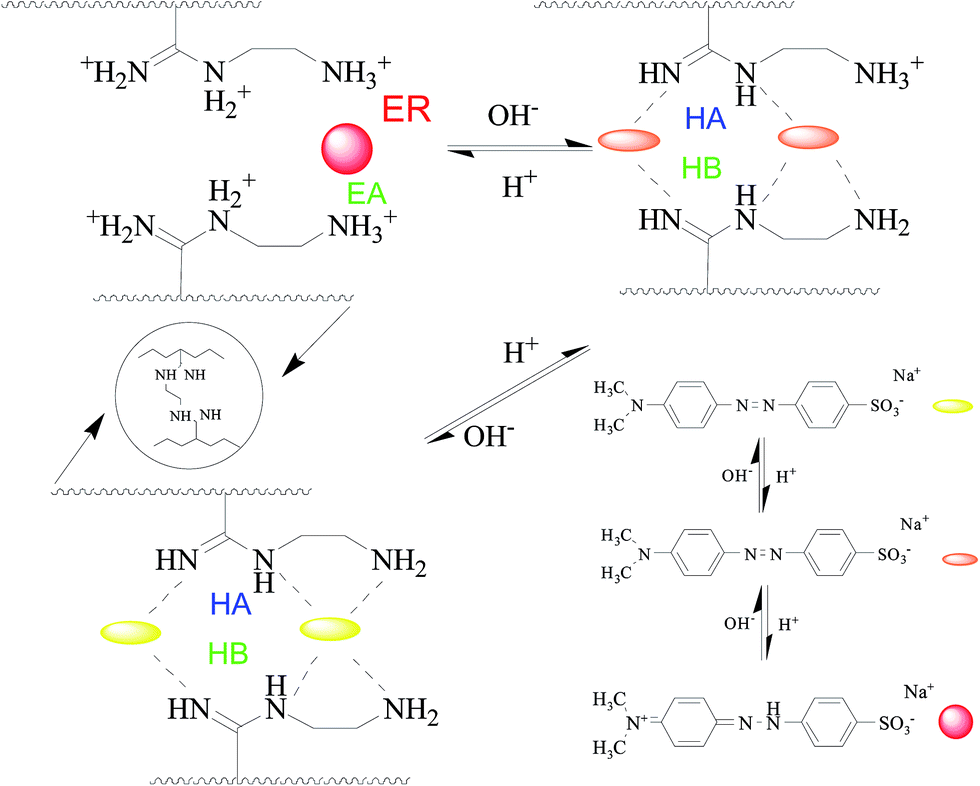
Fig. 5 shows the adsorption kinetics of MO onto APAN-nFs in solutions of different pH at 20 °C. It can be seen from Fig. 5 that the adsorption capacity was the lowest in 1 mol L−1 HCl solution. The loading ability reached the optimal level when the experiments were conducted in 1 mol L−1 NaOH solution and NaCl solution. The adsorption capacity was moderate in aqueous solution. It has been reported1,14,45 that electrostatic force, hydrogen bond (HB) and hydrophobic force are the predominant interactions during the adsorption process. The suppression of electrostatic attraction and enhancement of hydrophobic attraction (HA) will occur when the ionic strength increases, whereas the ionic strength slightly affects the HB. When the experiment was conducted in 1 mol L−1 HCl solution, most of the functional groups such as –NH– were protonated and present in the positively charged form and MO existed in quinone form, meaning that the electrostatic repulsion (ER) far exceeded the electrostatic attraction (EA). Furthermore, acidifying APAN-nFs reduced the number of active binding sites. Hence there was minimum adsorption capacity for MO onto APAN-nFs at low pH. Therefore, the adsorption of MO in acidic solution was unfavorable. The HA increased with the enhancement of ionic strength in a higher pH solution. The presence of HB, as another important factor, increased the adsorption capacity in NaCl solution as well. As a result, the enhancement of HA, weakening of ER and existence of HB boosted the loading ability of MO onto APAN-nFs. Therefore, the probable interaction between adsorbate MO and adsorbent APAN-nFs is proposed, as illustrated in Scheme 2.
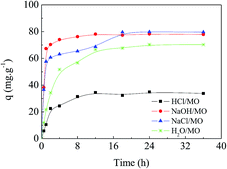 |
| | Fig. 5 Effect of ionic strength and solutions of various pH on the adsorption capacity of MO onto APAN-nFs. | |
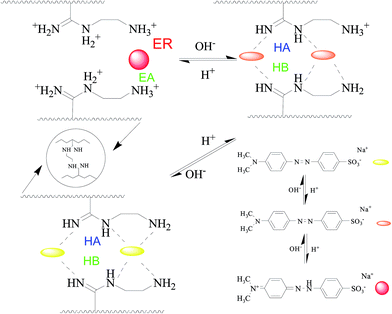 |
| | Scheme 2 The proposed interaction mechanism between APAN-nFs and dyes in solutions of various pH. | |
Adsorption kinetics
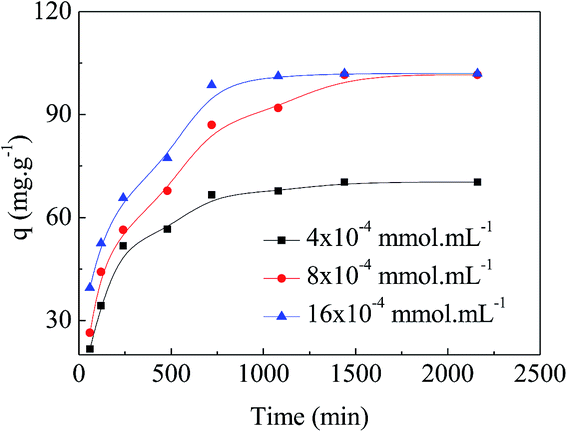
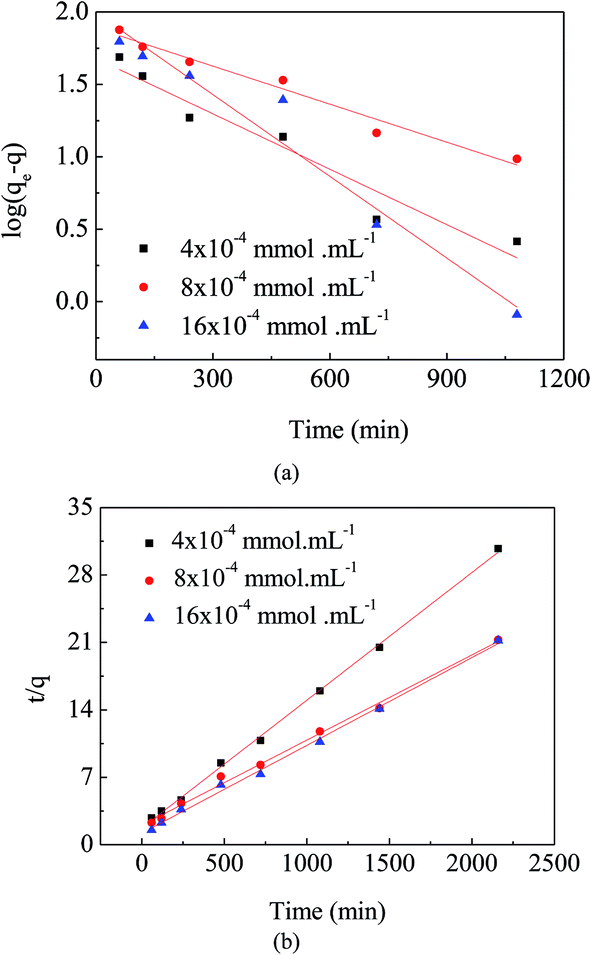
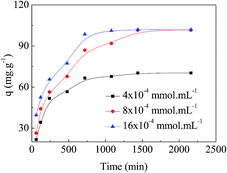
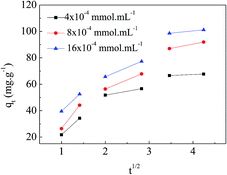
Adsorption kinetics is one of the important factors for adsorbents' practical application due to its affecting of the uptake rate and contact time for dyes. Fig. 6 shows the results of different concentrations of MO (4 × 10⁻⁴ mmol mL−1, 8 × 10⁻⁴ mmol mL−1, and 16 × 10−4 mmol mL−1) adsorbing onto the APAN-nFs as a function of time at 20 °C. Changes in contact time exhibited approximately the same effect on various concentrations of MO. The amount of MO adsorbed onto the APAN-nFs increased rapidly at the first 12 h and then levelled off. As a result of the adequately available active adsorption sites because of the high specific surface area, the adsorption rates were rapid initially for different concentrations of MO. Thereafter adsorption continued at a much slower rate and finally reached equilibrium due to saturation of APAN-nFs surface sites. Thus the kinetics of adsorption provided a powerful basis to define the optimum contact time.
 |
| | Fig. 6 Adsorption kinetics of APAN-nFs for MO for various concentrations at 20 °C. | |
The adsorption mechanism of APAN-nFs with MO was evaluated by utilizing commonly used kinetics models, i.e. the pseudo-first-order model and pseudo-second-order model. The equations are expressed as follows:46,47
| |
 | (1) |
| |
 | (2) |
where
qe (mmol g
−1) and
qt (mmol g
−1) represent the amounts of MO adsorbed on the APAN-nFs at equilibrium and at any time
t, respectively, and
k1 (min
−1) and
k2 (g (mmol min)
−1) are the rate constants of pseudo-first-order and pseudo-second-order models, respectively.
Comparing Fig. 7(a) and (b), the linear graphs indicate that the kinetics data are fitted better to the pseudo-second-order model. The result was further confirmed by the finding that (Table 1) correlation coefficients for the pseudo-second-order model (R2 > 0.99) were much closer to 1.0 than those for the pseudo-first-order model. These results suggest that the adsorption of MO onto the surface of APAN-nFs followed the pseudo-second-order kinetic model.
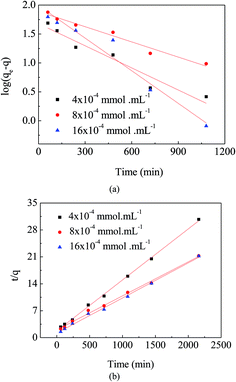 |
| | Fig. 7 (a) Pseudo-first-order kinetic plots for adsorption of MO. (b) Pseudo-second-order kinetic plots for adsorption of MO. | |
Table 1 Maximum adsorption capacity (qe (cal)) and parameters (k, R2) of pseudo-first-order and pseudo-second-order kinetics at various initial MO concentrations
| C (mol L−1) |
Pseudo-first-order kinetics |
Pseudo-second-order kinetics |
| k1 |
qe (cal) (mg g−1) |
R2 |
k2 |
qe (cal) (mg g−1) |
R2 |
| 4 × 10⁻⁴ |
0.00292 |
47.75 |
0.9309 |
1.019 × 10⁻⁴ |
75.41 |
0.9986 |
| 8 × 10⁻⁴ |
0.00202 |
77.36 |
0.9651 |
3.899 × 10⁻⁵ |
113.12 |
0.9949 |
| 16 × 10−4 |
0.00433 |
98.48 |
0.9482 |
6.973 × 10⁻⁵ |
109.65 |
0.9963 |
Adsorption isotherms
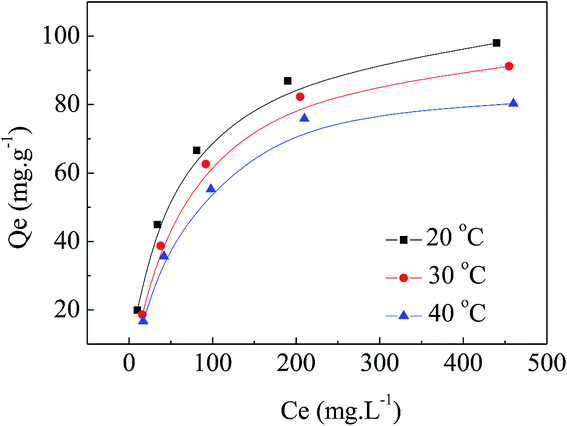
Adsorption isotherms are important for the interpretation of the interactive behavior between adsorbate and adsorbent. They are critical in optimizing the application of an adsorbent as well. Fig. 8 presents amounts of MO adsorbed onto APAN-nFs after the equilibrium time as a function of equilibrium concentrations at different temperatures. Adsorption showed a rapid increase initially; as the concentration of MO increased, the adsorption capacity levelled off. The initial increase was related to the large number of chelating amine sites that were present on APAN-nFs, as well as to the high specific surface area of the nFs. The adsorption equilibrium can be constructed as a relation between the adsorbate concentration on the surface of APAN-nFs and in the solution at a given temperature. It can be seen from Fig. 8 that the adsorption capacity of APAN-nFs for MO was lowered as the temperature increased. This indicates that the adsorption process was exothermic. Furthermore, the loading capacity of APAN-nFs for MO increased with increasing initial MO concentrations as a result of greater driving force by a higher concentration gradient pressure.
 |
| | Fig. 8 Isotherms of APAN-nFs for the adsorption of MO at different temperatures. | |
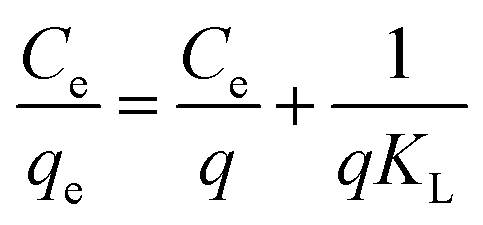
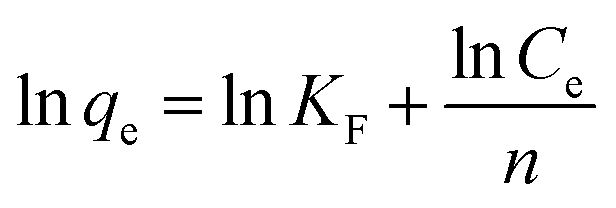
In order to further interpret the adsorption mechanism and assess the adsorption characteristics, the isotherm data were analyzed by Langmuir and Freundlich models. The equations are as follows:48,49
| |
 | (3) |
| |
 | (4) |
where
qe (mmol g
−1) and
Ce (mmol mL
−1) stand for adsorption capacity and concentration of dyes in a state of equilibrium, respectively,
q (mmol g
−1) is maximum adsorption amount,
KL (mL mmol
−1) is an empirical constant which is related to the binding energy,
n ((mL mmol
−1)
n) is the Freundlich constant which corresponds to adsorption intensity, and
KF (mmol g
−1) is the combination ability of chemical bond between adsorbent and dye.
As shown in Fig. 9(a) and (b), the Langmuir model was better able to describe the adsorption isotherm results for MO on APAN-nFs than the Freundlich model. The important parameters were calculated and are listed in Table 2. Among them, the correlation coefficients of the Langmuir model (R2 > 0.99) were closer to 1.0 than those of the Freundlich model. According to Langmuir model theory, adsorption occurs at specific homogeneous sites. In other words, no further adsorption can occur at a site once a sorbate occupies that chelate site. Therefore, the adsorption of MO took place via the formation of a monolayer.
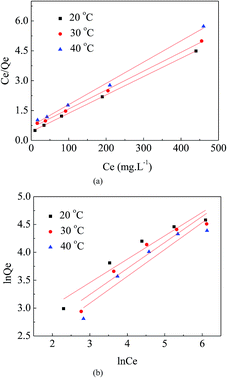 |
| | Fig. 9 (a) Langmuir isotherms of APAN-nFs for the adsorption of MO at different temperatures. (b) Freundlich isotherms of APAN-nFs for the adsorption of MO at different temperatures. | |
Table 2 Langmuir parameters and Freundlich parameters at different temperatures
| T (°C) |
Langmuir parameters |
Freundlich parameters |
| q0 (mg g−1) |
KL (L mg−1) |
RL2 |
KF |
n |
RF2 |
| 20 |
108.46 |
0.0209 |
0.9997 |
8.988 |
2.380 |
0.9139 |
| 30 |
105.26 |
0.0151 |
0.9981 |
6.308 |
2.141 |
0.8956 |
| 40 |
93.55 |
0.0147 |
0.9946 |
5.153 |
2.074 |
0.8947 |
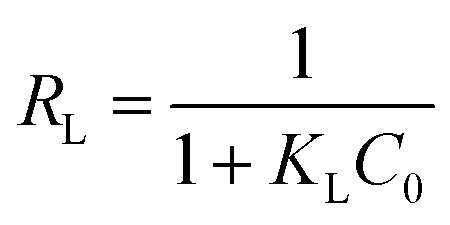
Moreover, the favorability of adsorption for MO in the case of the Langmuir model is determined by the dimensionless separation factor RL. It was calculated based on the equation as follows:15
| |
 | (5) |
where
KL (mL mmol
−1) is an empirical constant of the Langmuir model and
C0 (mmol mL
−1) represents the initial concentration of dye.
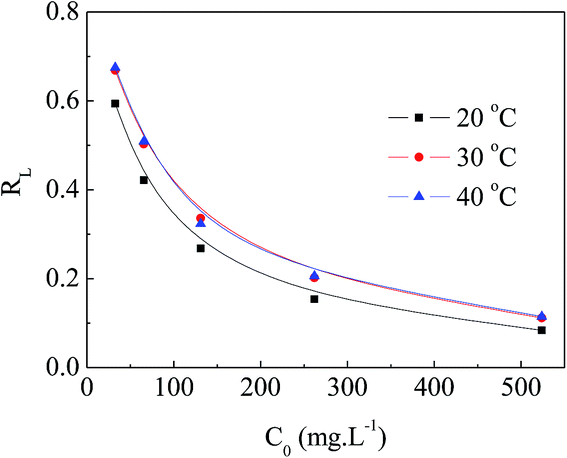
The values of RL can be classified into three categories: (I) RL > 1, (II) 0 < RL < 1, (III) RL = 0, suggesting that adsorption is unfavorable, favorable, and irreversible, respectively. The RL values decreased from approximately 0.70 to 0.10 with increasing initial concentration of MO at various temperatures, as presented in Fig. 10. This indicates that MO adsorption was more favorable at higher initial concentration of MO.
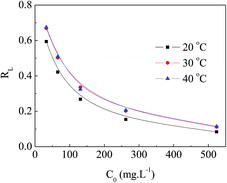 |
| | Fig. 10 RL of APAN-nFs for the adsorption of MO. | |
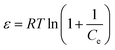
The equilibrium data were also fitted by the Dubinin–Radushkevich (D–R) isothermal model to determine the nature of the adsorption process as physical or chemical. The linear form of the D–R isotherm equation is as follows:50,51
| |
ln![[thin space (1/6-em)]](https://www.rsc.org/images/entities/char_2009.gif) qe = lnqm − βε2 qe = lnqm − βε2
| (6) |
where
β (mol
2 J
−2) is the activity coefficient corresponding to adsorption mean free energy and
ε is the Polanyi potential which can be expressed as
eqn (7):
| |
 | (7) |
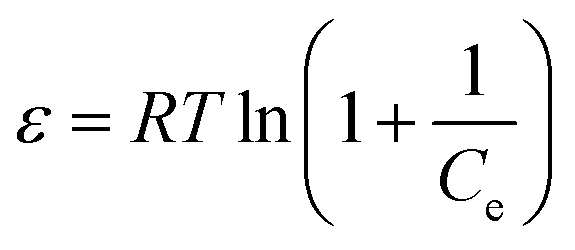
The mean free energy E (kJ mol−1) is calculated by using the value of β according to the following equation:
| |
 | (8) |
The value of E is a judgment standard to assess the adsorption mechanism as being physical or chemical. If the E value is below 8 kJ mol−1, the adsorption proceeds physically. If it lies between 8 and 16 kJ mol−1, the adsorption takes place chemically. The fitting parameters of the D–R model and the calculated E values are listed in Table 3. As is shown in Table 3, all the E values were about 10.00 kJ mol−1, suggesting the adsorption of MO occurred by a chemical mechanism.
Table 3 D–R isotherm linear equations and parameters for the adsorption of MO onto APAN at different temperatures
| T (K) |
Liner equation |
k (mol2 J−2) |
E (kJ mol−1) |
R2 |
| 293.15 |
y = −4.229 × 10⁻⁹x + 0.02923 |
4.229 × 10⁻⁹ |
10.87 |
0.9557 |
| 303.15 |
y = −4.565 × 10⁻⁹x + 0.14136 |
4.565 × 10⁻⁹ |
10.47 |
0.9304 |
| 313.15 |
y = −4.240 × 10⁻⁹x − 0.01532 |
4.240 × 10⁻⁹ |
10.86 |
0.9263 |
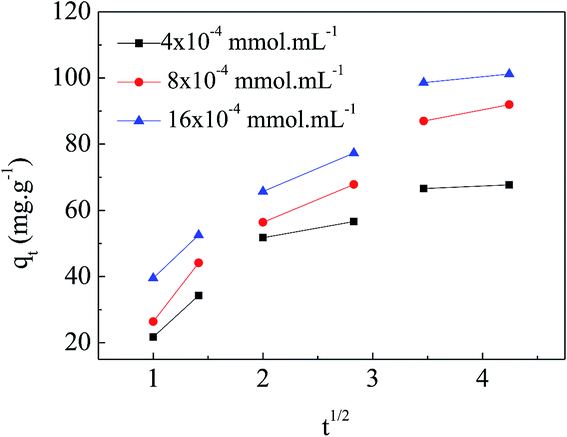
A typical liquid/solid adsorption generally involves film diffusion, intraparticle diffusion and mass action. For physical adsorption, mass action is a very swift process. As demonstrated above, the adsorption mainly proceeded with a chemical mechanism. Consequently, mass action could be neglected and the adsorption diffusion models in this study are mainly based on film diffusion and/or intraparticle diffusion. The diffusion mechanism is studied by the intraparticle diffusion model, as shown in eqn (9):52
where
Kd is the diffusion coefficient.
This model assumes that a plot of qt versus t1/2 should yield a straight line through the origin provided that the intraparticle diffusion is the only rate-controlling step. Fig. 11 shows non-linear plots of qt versus t1/2 for MO, indicating that intraparticle transport is not the only diffusion mechanism. The plot of the whole range is divided into three distinct parts. The first sharp region shows adsorption. However, in the second region, besides adsorption, diffusion occurs attributed to layers between fibers. The third part represents the equilibrium phase because of the rate decrease of saturation intraparticle diffusion.
 |
| | Fig. 11 Intraparticle diffusion plot of APAN-nFs for the adsorption of MO. | |
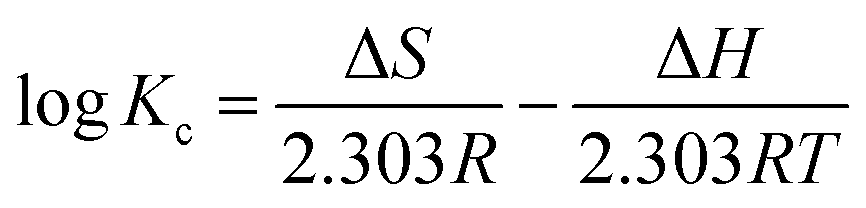
In order to evaluate the thermodynamic feasibility and spontaneous nature for the MO adsorption onto APAN-nFs, the thermodynamic parameters for the adsorption process such as Gibbs free energy change (ΔG), enthalpy change (ΔH) and entropy change (ΔS) were calculated according to the following equations:53,54
| |
 | (10) |
where
Kc represents the distribution coefficient which is calculated as the ratio of MO equilibrium concentration in the adsorbents and aqueous phases,
T (K) is the absolute temperature and
R (8.314 J mol
−1 K
−1) is the gas constant. Δ
H and Δ
S can be obtained
via the slope and intercept of a linear plot of log
Kc versus 1/
T.
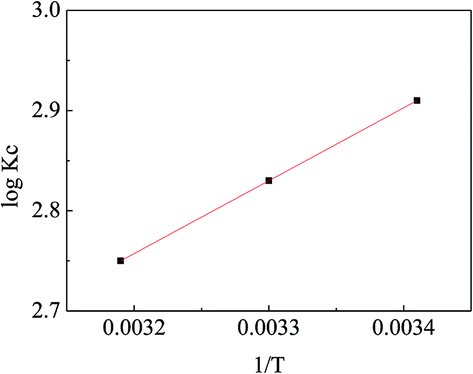
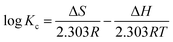
Fig. 12 exhibits the linear relationship between log
Kc and 1/
T and the calculated thermodynamic parameters are listed in
Table 4. The negative value of Δ
H demonstrates that the adsorption process was exothermic, implying that increasing the temperature may inhibit the adsorption of MO onto APAN-nFs. The phenomenon was consistent with that of the adsorption isotherms. The positive value of Δ
S reveals that randomness was increased at the solid-solution interface during the MO adsorption process. The negative values of Δ
G implied that the adsorption process was spontaneous at different temperatures. The values of Δ
G decreased with increasing temperature, indicating that the adsorption process was more feasible at lower temperature. In conclusion, the thermodynamic data imply the adsorption process of MO onto APAN was spontaneous and can be promoted by decreasing the temperature.
 |
| | Fig. 12 The variation of logKc with 1/T. | |
Table 4 Thermodynamic parameters for the adsorption of MO onto APAN at different temperatures
| T (K) |
ΔG (kJ mol−1) |
ΔH (kJ mol−1) |
ΔS (J mol−1 K−1) |
| 293.15 |
−16.33 |
−13.92 |
8.23 |
| 303.15 |
−16.41 |
|
|
| 313.15 |
−16.50 |
|
|
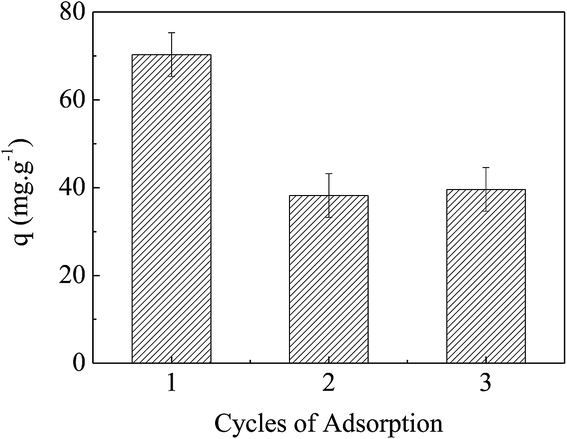
Dye desorption and reuse of the fibers
From the discussion above, it is known that electrostatic force, HB and hydrophobic force were the main interactions of MO adsorption by APAN-nFs. The numbers of positive and negative charges of APAN-nFs can be controlled through contacting with solutions of different pH. It is rational that the adsorbed MO can be released simply through contacting with solutions of different pH. When the adsorption process was conducted under strongly acid conditions, acidifying APAN-nFs were present in the positively charged form and MO existed as quinone form, enhancing ER between MO and APAN-nFs. Therefore, the desorption and adsorption experiments for MO were mainly performed using low pH and high pH solution. Fig. 13 shows that the dye adsorption performances of APAN-nFs exhibited a certain degree of loss after the first reuse, and then it levelled off. A conclusion can be drawn that the adsorbent APAN-nFs showed reusability.
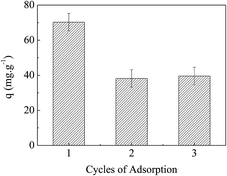 |
| | Fig. 13 The reusability of the adsorbent APAN-nFs. | |
Experimental section
Materials
Acrylonitrile (AN, >98.5%, Tianjin Fuchen Chemical Reagent Co., Tianjin, China) was purified via atmospheric distillation prior to being kept at 5 °C. Cobalt(III) acetylacetonate (Co(acac)3, >98.0%, Aladdin) was used without further purification. 2-Cyanoprop-2-yl dithionaphthalenoate (CPDN) was synthesized according to the literature reported elsewhere.55 N,N-dimethylformamide (DMF, >99.5%, Tianjin Bodi Chemical Reagents Co., Tianjin, China) was treated with molecular sieves to eliminate water. Methyl orange (MO, AR grade, Tianjin Damao Chemical Reagent Co., Tianjin, China), ethylenediamine (EDA, AR grade, Tianjin Fuyu Fine Chemical Co., Tianjin, China), ethanol (AR grade, Laiyang Economic and Technological Development Fine Chemical Co., Yantai, China), methanol (AR grade, Tianjin Damao Chemical Reagent Co., Tianjin, China), and lithium bromide (LiBr, >98.0%, Tianjin Guangfu Fine Chemical Institute, Tianjin, China) were used as received.
Apparatus and instrumentation
The number-average molecular weights (Mn) and molecular weight distributions (Mw/Mn) of obtained polymers were determined by a Waters 1515 gel permeation chromatograph assembled with a refractive-index detector (Waters 2414) using an HR column (7.8 × 300 mm). DMF with 0.1 M LiBr was used as the eluent at a flow rate of 1.0 mL min−1 at 35 °C. The concentration of MO was measured by UV-visible spectral analyses, using a Shimadzu UV 2550 spectrophotometer over the wavelength range of 350–550 cm−1, according to the Lambert–Beer law. The PAN-nFs were obtained by electrospinning apparatus (Beijing Fuyouma Science and Technology Ltd, Beijing, China), mainly composed of a 10 mL glass syringe, needle tips with different sizes, a high-voltage power supply, and a stainless steel drum as the collector. The thermostabilities of the PAN-nFs and APAN-nFs were measured based on thermogravimetric analysis (TGA, Netzsch TG 209, Germany). The chemical or physical interactions were analyzed by infrared spectra obtained with a Perkin-Elmer Spectrum 2000 FTIR (MAGAN550, Nicolet, America) using the KBr pellet technique. The surface morphologies of samples were characterized by high- and low-vacuum scanning electron microscopy (SEM, JSM-5610LV, Tokyo, Japan), operating at 20 kV.
Preparation of the adsorptive membrane
PAN polymer with the narrowest Mw/Mn was the optimal candidate for electrospinning. PAN/DMF solution, with concentration of 10 wt%, was put into a vacuum drying oven until a homogeneous solution was obtained at room temperature. To produce a web, a voltage of 18 kV was applied to the tip of needle and collector, and the distance between them was 15 cm. The feeding rate of the PAN solution was 190 μL h−1. The electrospinning procedures were conducted under ambient temperature. The PAN-nFs were collected on a stainless steel drum in the form of a non-woven mat. Afterwards, 2 g of PAN was immersed in a mixture of 100 mL EDA at 90–110 °C for 5 h. The resulting material (APAN-nFs) was extracted by ethanol for 12 h until the pH reached 7. It was dried at 60 °C under vacuum for 24 h until a constant weight was recorded at room temperature.
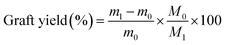
The degree of –CN group conversion to amine group was calculated by gravimetry. The conversion percent was calculated as follows:
| |
 | (12) |
where
m0 (g) and
m1 (g) represent the weight of PAN-nFs and APAN-nFs, respectively.
M1 and
M0 are the molar mass of EDA (60.10 g mol
−1) and AN monomer (53.06 g mol
−1), respectively.
Adsorption dynamics experiments
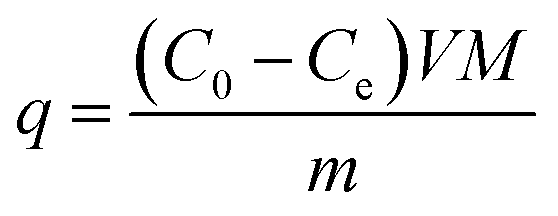
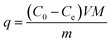
The adsorption kinetics was investigated using a batch method. The equivalent amount of APAN-nFs and MO, MB, FSS were mixed, respectively, with the same concentration of 4 × 10⁻⁴ mmol mL−1 aqueous solution at 20 °C. Subsequently, to investigate the adsorption mechanism, the adsorption kinetics of MO were investigated using each of 1 mol L−1 hydrochloric acid (HCl) solution, 1 mol L−1 sodium hydroxide (NaOH) solution, and 1 mol L−1 sodium chloride (NaCl) solution. Furthermore, appropriate amount of APAN-nFs and different concentrations of MO solution (4 × 10⁻⁴ mmol mL−1, 8 × 10⁻⁴ mmol mL−1, and 16 × 10−4 mmol mL−1) were mixed together to perform the kinetics experiments at 20 °C. After certain time intervals, some solution was withdrawn and the concentration of MO in each solution was determined with UV spectrometry. The adsorption capacity of APAN-nFs for MO was calculated based on the following equation:| |
 | (13) |
where q (mg g−1) is the amount of MO adsorbed per unit mass of APAN-nFs, C0 (mmol mL−1) and Ce (mmol mL−1) are the initial and equilibrium concentration of MO, respectively, M (327.33 g mol−1) is the relative molecular mass of MO, V (mL) is the solution volume and m (g) stands for the weight of APAN-nFs.
Adsorption thermodynamics experiments
In order to investigate the thermodynamics, appropriate amounts of APAN-nFs and various concentrations of MO solution from 1 × 10⁻⁴ mmol mL−1 to 16 × 10−4 mmol mL−1 were mixed. A certain volume of supernatant at different temperatures was collected to evaluate concentrations of MO by UV spectrometry. The calculation of adsorption capacity was based on eqn (13).
Desorption and reuse of the APAN-nFs
Into 100 mL of MO solution (pH = 7) a certain amount of fibers was added. When the adsorption equilibrium was reached, the adsorbent, APAN-nFs, was taken out and put into 10 mL of deionized water with pH 1. The mixture was stirred gently. After a certain time to allow for MO desorption, APAN-nFs were taken out and washed several times with water until pH = 7. Then APAN-nFs were immersed into the MO solution again for re-adsorption.
Conclusions
In this work, PAN was first successfully synthesized utilizing Co(acac)3 in combination with CPDN. The polymerization proceeded in a good “living”/controlled manner. Co(acac)3 and CPDN proved to be highly efficient initiator and CTA, respectively. The MWD of the obtained PAN was as low as 1.25. The diameter of PAN-nFs was evenly distributed at 300 nm. EAD was successfully grafted onto the surface of PAN-nFs without reduction in sample (APAN-nFs) flexibility. The maximum adsorption capacity for MO of APAN-nFs was 102 mg g−1. As for the adsorption interaction between MO and APAN-nFs, EA and ER played dominant roles at relatively low pH. HA and HB were the key factors that affected the adsorption capacity of MO with addition of NaCl or NaOH. The adsorption kinetics followed the pseudo-second-order model. The Langmuir model was better able to interpret the isothermal process for adsorption of MO onto APAN-nFs. The E values calculated from the D–R model implied that the adsorption took place by a chemical mechanism. Negative ΔG and ΔH suggested the spontaneous and exothermic nature of the adsorption process. MO adsorbed by APAN-nFs could be reversibly desorbed in a solution of pH = 1. The adsorbent showed reusability as well. The results showed that APAN-nFs, with PAN synthesized via the RAFT technique as the precursor, are promising candidate materials for the removal of MO dyes.
Acknowledgements
The authors are grateful for the financial support by the Program for New Century Excellent Talents in University (no. NCET-11-1028), the Natural Science Foundation for Distinguished Young Scholars of Shandong province (no. JQ201203), and the Program for Scientific Research Innovation Team in Universities of Shandong Province.
References
- Y. Hu, T. Guo, X. Ye, Q. Li, M. Guo, H. Liu and Z. Wu, Chem. Eng. J., 2013, 228, 392 CrossRef CAS PubMed.
- Y. Zhang, R. Qu, C. Sun, C. Ji, H. Chen and P. Yin, Chem. Eng. J., 2015, 270, 110 CrossRef CAS PubMed.
- N. Saffaj, H. Loukili, S. A. Younssi, A. Albizane, M. Bouhria, M. Persin and A. Larbot, Desalination, 2014, 168, 301 CrossRef PubMed.
- S. K. Nataraj, K. M. Hosamani and T. M. Aminabhavi, Desalination, 2009, 249, 12 CrossRef CAS PubMed.
- E. Guibal and J. Roussy, React. Funct. Polym., 2007, 67, 33 CrossRef CAS PubMed.
- A. Martinez-de la Cruz and S. O. Alfaro, J. Mol. Catal. A: Chem., 2010, 320, 85 CrossRef CAS PubMed.
- S. Yang, L. Zhang, Q. Yang, Z. Zhang, B. Chen, P. Lv, W. Zhu and G. Wang, J. Mater. Chem. A, 2015, 3, 7950 CAS.
- J. Zhang, Z. Xiong and X. S. Zhao, J. Mater. Chem., 2011, 21, 3634 RSC.
- W. W. Ngah, L. C. Teong and M. A. Hanafiah, Carbohydr. Polym., 2011, 83, 1446 CrossRef PubMed.
- G. Crini and P. M. Badot, Prog. Polym. Sci., 2008, 33, 399 CrossRef CAS PubMed.
- N. Sakkayawong, P. Thiravetyan and W. Nakbanpote, J. Colloid Interface Sci., 2005, 286, 36–42 CrossRef CAS PubMed.
- M. S. Chiou and H. Y. Li, Chemosphere, 2003, 50, 1095 CrossRef CAS.
- J. W. Steed and J. L. Atwood, Supramolecular Chemistry, John Wiley & Sons, Chichester, 1st edn, 2000 Search PubMed.
- Y. G. Ko, U. S. Choi, T. Y. Kim, D. J. Ahn and Y. J. Chun, Macromol. Rapid Commun., 2002, 23, 535 CrossRef CAS.
- P. K. Neghlani, M. Rafizadeh and F. A. Taromi, J. Hazard. Mater., 2011, 186, 182 CrossRef CAS PubMed.
- K. Saeed, S. Haider, T. J. Oh and S. Y. Park, J. Membr. Sci., 2008, 322, 400 CrossRef CAS PubMed.
- A. Formhals, Process and apparatus for preparing artificial threads, US pat. No. 1,975,504, 1934.
- D. H. Reneker and I. Chun, Nanotechnology, 1996, 7, 216 CrossRef CAS.
- B. Ortaç, F. Kayaci, H. A. Vural, A. E. Deniz and T. Uyar, React. Funct. Polym., 2013, 73, 1262 CrossRef PubMed.
- J. A. Matthews, G. E. Wnek, D. G. Simpson and G. L. Bowlin, Biomacromolecules, 2002, 3, 232 CrossRef CAS PubMed.
- S. Niu, L. Zhang, N. Wang, J. Zhu, W. Zhang, Z. Cheng and X. Zhu, React. Funct. Polym., 2013, 73, 1447 CrossRef CAS PubMed.
- S. Niu, L. Zhang, J. Zhu, W. Zhang, Z. Cheng and X. Zhu, J. Polym. Sci., Part A: Polym. Chem., 2013, 51, 1197 CrossRef CAS PubMed.
- L. Tan, J. Pan and A. Wan, Colloid Polym. Sci., 2012, 290, 289 CAS.
- P. Gupta, C. Elkins, T. E. Long and G. L. Wilkes, Polymer, 2005, 46, 4799 CrossRef CAS PubMed.
- Y. Piette, A. Debuigne, C. Jérôme, V. Bodart, R. Poli and C. Detrembleur, Polym. Chem., 2012, 3, 2880 RSC.
- C. M. Liao, C. C. Hsu, F. S. Wang, B. B. Wayland and C. H. Peng, Polym. Chem., 2013, 4, 3098 RSC.
- I. Allaoua, B. E. Goi, M. M. Obadia, A. Debuigne, C. Detrembleur and E. Drockenmuller, Polym. Chem., 2014, 5, 2973 RSC.
- A. Debuigne, C. Michaux, C. Jérôme, R. Jérôme, R. Poli and C. Detrembleur, Chem.–Eur. J., 2008, 14, 7623 CrossRef CAS PubMed.
- A. Debuigne, R. Poli, C. Jérôme, R. Jérôme and C. Detrembleur, Prog. Polym. Sci., 2009, 34, 211 CrossRef CAS PubMed.
- K. Endo and A. Yachi, Polym. Bull., 2001, 46, 363 CrossRef CAS.
- M. A. Tasdelen, Y. Yagci, A. L. Demirel, T. Biedron and P. Kubisa, Polym. Bull., 2007, 58, 653 CrossRef CAS.
- J. Chiefari, Y. K. Chong, F. Ercole, J. Krstina, J. Jeffery, T. P. Le, R. Mayadunne, G. F. Meijs, C. Moad, G. Moad, E. Rizzardo and S. H. Thang, Macromolecules, 1988, 31, 5559 CrossRef.
- S. T. Hemp, A. E. Smith, W. C. Bunyard, M. H. Rubinstein and T. E. Long, Polymer, 2014, 55, 2325 CrossRef CAS PubMed.
- S. Chen and W. H. Binder, Polym. Chem., 2015, 6, 448 RSC.
- D. J. Keddie, Chem. Soc. Rev., 2014, 43, 496 RSC.
- Q. An, J. Qian, L. Yu, Y. Luo and X. Liu, J. Polym. Sci., Part A: Polym. Chem., 2005, 43, 1973 CrossRef CAS PubMed.
- X. H. Liu, G. B. Zhang, B. X. Li, Y. G. Bai, D. Pan and Y. S. Li, Eur. Polym. J., 2008, 44, 1200 CrossRef CAS PubMed.
- Z. Yue, D. X. Wang, J. Q. Liu, J. Zhang and S. Y. Feng, Chin. Chem. Lett., 2012, 23, 989 CrossRef CAS PubMed.
- Y. Xu, J. Sun, H. Chen, L. Bai, Q. Tao, L. Yu and Y. Wang, J. Polym. Sci., Part A: Polym. Chem., 2015, 53, 1305 CrossRef CAS PubMed.
- P. K. Neghlani, M. Rafizadeh and F. A. Taromi, J. Hazard. Mater., 2011, 186, 182 CrossRef CAS PubMed.
- Y. Fan, H. J. Liu, Y. Zhang and Y. Chen, J. Hazard. Mater., 2015, 283, 321 CrossRef CAS PubMed.
- P. Tahaei, M. Abdouss, M. Edrissi, A. M. Shoushtari and M. Zargaran, Materialwiss. Werkstofftech., 2008, 39, 839 CrossRef CAS PubMed.
- A. M. Shoushtari, M. Zargaran and M. Abdouss, J. Appl. Polym. Sci., 2006, 101, 2202 CrossRef CAS PubMed.
- P. Borrell, P. D. Harrison, and J. C. Marriott, Cationic Fibers Suitable for Ion-exchange Materials and their Production, Eur. Pat., 0,194,766, A1, 1986.
- M. Meot-Ner, Chem. Rev., 2005, 105, 213 CrossRef CAS.
- F. Ma, R. Qu, C. Sun, C. Wang, C. Ji, Y. Zhang and P. Yin, J. Hazard. Mater., 2009, 172, 792 CrossRef CAS PubMed.
- R. Qu, Y. Niu, J. Liu, C. Sun, Y. Zhang, H. Chen and C. Ji, React. Funct. Polym., 2008, 68, 1272 CrossRef CAS PubMed.
- Y. C. Chang, S. W. Chang and D. H. Chen, React. Funct. Polym., 2006, 66, 335 CrossRef CAS PubMed.
- M. Jain, V. K. Garg and K. Kadirvelu, Bioresour. Technol., 2011, 102, 600 CrossRef CAS PubMed.
- M. Tuzen, A. Sari, D. Mendil and M. Soylak, J. Hazard. Mater., 2009, 169, 263 CrossRef CAS PubMed.
- Y. Z. Niu, R. J. Qu, C. M. Sun, C. H. Wang, H. Chen, C. N. Ji, Y. Zhang, X. Shao and F. L. Bu, J. Hazard. Mater., 2013, 244–45, 276 CrossRef PubMed.
- J. P. Chen, S. N. Wu and K. H. Chong, Carbon, 2003, 41, 1979 CrossRef CAS.
- R. J. Qu, C. M. Sun, F. Ma, Y. Zhang, C. N. Ji, Q. Xu, C. H. Wang and H. Chen, J. Hazard. Mater., 2009, 167, 717 CrossRef CAS PubMed.
- Y. Niu, R. Qu, H. Chen, L. Mu, X. Liu, T. Wang, Y. Zhang and C. Sun, J. Hazard. Mater., 2014, 278, 267 CrossRef CAS PubMed.
- J. Zhu, X. Zhu, Z. Cheng, F. Liu and J. Lu, Polymer, 2002, 43, 7037 CrossRef CAS.
Footnote |
| † Electronic supplementary information (ESI) available. See DOI: 10.1039/c5ra09515h |
|
| This journal is © The Royal Society of Chemistry 2015 |
Click here to see how this site uses Cookies. View our privacy policy here.