Remarkable hydrogen storage properties at low temperature of Mg–Ni composites prepared by hydriding combustion synthesis and mechanical milling†
Yajun Tan,
Qifeng Mao,
Wei Su,
Yunfeng Zhu and
Liquan Li*
College of Materials Science and Engineering, Nanjing Tech University, China. E-mail: lilq@njtech.edu.cn
First published on 17th July 2015
Abstract
Mg100−xNix (x = 0, 5, 10 and 20) composites with the main particle size below 400 nm were synthesized by hydriding combustion synthesis followed by mechanical milling (HCS + MM). XRD and TEM results of Mg100−xNix revealed that the products had the phases of MgH2, Mg2NiH4, Mg2NiH0.3 and Mg (Mg just for x = 0 and 5), with Mg–Ni hydrides distributing uniformly in the composites. DSC results of Mg100−xNix composites demonstrated that the hydrogen desorption peak for MgH2 in the Mg80Ni20 composite was decreased to 223.9/247.3 °C. With 5 at% Ni added, the Mg95Ni5 reached its saturated hydrogen absorption capacity of 5.80 wt% within 100 s at 473 K. As for Mg80Ni20, a hydrogen absorption of 3.70 wt% at 313 K and a desorption capacity of 1.84 wt% at 473 K could be obtained. The Mg2Ni distributing uniformly in Mg–Ni composites significantly facilitates hydrogen diffusion and improves the hydriding/dehydriding kinetics and hydrogen storage capacity at low temperature. The amount of Ni is related greatly to the hydriding/dehydriding properties of Mg100−xNix, which makes the hydrogen storage capacity and hydriding/dehydriding kinetics remarkable. Besides, the excellent cycling stability was also obtained through the isothermal de/hydrogenation cycling kinetics measurement.
1. Introduction
A hydrogen storage system is required for hydrogen to become a widely used fuel.1 Some materials for solid hydrogen storage such as metal–organic frameworks,2,3 nanoporous polymers,4 and other carbon-based materials5,6 are under development, which can only absorb a small amount of hydrogen (typically less than 1 wt%) at room temperature. Magnesium hydride has been regarded as one of the most potential materials for hydrogen storage due to its high gravimetric and volumetric hydrogen densities.7,8 However, a very high temperature (above 573 K) required for desorption and the poor hydrogen absorption/desorption kinetics resulting from the high thermal stability limit its practical application.A commonly effective method is to use transition metals,9 metal oxides,10 carbon,11 and halides12 as the catalysts to improve the hydrogen storage performance of MgH2. Lu et al.13 added TiH2 to MgH2, showing excellent hydrogen absorption capacity of about 2.5 wt% at room temperature within 60 min under 4.0 MPa hydrogen pressure. Nano-confinement has also been an interesting approach to enhance the kinetics and reduce the desorption temperature.14–16 MgH2 nanoparticles were synthesized within the pores of the mesoporous materials CMK3 by Konarova et al.,17 and the desorption peak temperature of MgH2 decreased to 253 °C for MgCMK20. A number of different techniques such as ball milling,18 thin film formation,19 physical vapor deposition,20 hydriding chemical vapor deposition21 and organic solution synthesis22 have been used to synthesize Mg-based materials. Liu et al.23 used the hydrogen plasma-metal reaction (HPMR) method to prepare Mg-9.2 wt% TiH1.971–3.7 wt% TiH1.5 nanocomposite, which could absorb 4.3 wt% of hydrogen at 373 K within 60 min.
In this work, Mg is alloyed with transition metal of Ni to decrease the desorption temperature and improve the kinetics at low temperature. The method of hydriding combustion synthesis followed by mechanical milling (HCS + MM) is used to synthesize Mg–Ni composites. The HCS method has the advantages of low energy consumption, high activity of the product and short processing time, which is regarded as an innovative process for the preparation of Mg-based hydrogen storage materials.24,25 The hydrogen storage property of Mg–Ni composites at low temperature is studied, which will contribute to the application for the solid hydrogen storage. Furthermore, the effect of the atomic ratio (at%) of Ni on the absorption/desorption kinetics of Mg–Ni composites is also investigated.
2. Experimental details
Original powders of Mg (99 wt% in purity and <74 μm in diameter) and Ni (99 wt% in purity and 2–3 μm in diameter) were commercially obtained. Mg and Ni powders with an atomic ratio of 100−x![[thin space (1/6-em)]](https://www.rsc.org/images/entities/char_2009.gif) :
:![[thin space (1/6-em)]](https://www.rsc.org/images/entities/char_2009.gif) x (x = 0, 5, 10 and 20) were homogenized by ultrasonic vibration in acetone for 60 min. After drying in air, the mixtures were used directly for HCS. More details about HCS are described in our previous work.26 The HCS product were further treated by mechanical milling under 0.1 MPa argon atmospheres with process control agent of 2 wt% graphite on a planetary ball mill with ball to powder ratio of 30
x (x = 0, 5, 10 and 20) were homogenized by ultrasonic vibration in acetone for 60 min. After drying in air, the mixtures were used directly for HCS. More details about HCS are described in our previous work.26 The HCS product were further treated by mechanical milling under 0.1 MPa argon atmospheres with process control agent of 2 wt% graphite on a planetary ball mill with ball to powder ratio of 30![[thin space (1/6-em)]](https://www.rsc.org/images/entities/char_2009.gif) :
:![[thin space (1/6-em)]](https://www.rsc.org/images/entities/char_2009.gif) 1 at 400 rpm for 600 min.
1 at 400 rpm for 600 min.
The crystal structure and surface configuration of samples were determined by powder X-ray diffraction (XRD, SmartLab TM, Rigaku, Tokyo, Japan) with Cu Kα radiation (40 kV and 35 mA), scanning electron microscopy (SEM, JSM-6360LV, JEOL, Tokyo, Japan) and high-resolution transmission electron microscope (HRTEM, JEM-2010 UHR, JEOL, Tokyo, Japan). The software Rietica was used for the quantitative phase analysis of the HCS products based on the Rietveld method.27
Thermal decomposition property was examined by using a differential scanning calorimeter (DSC, Q2000, TA instruments, USA). In the DSC tests argon was adopted as carrier gas. The hydriding and dehydriding properties of products after HCS + MM were measured by volumetric method, using the gas reaction controller made by Advance Materials Corporation (AMC, Pittsburgh, USA). In order to prevent possible oxidation, the transfer of samples to the sample chamber was performed in a glove box under an argon atmosphere. Ahead of hydriding measurement, the samples would have a thermal desorption, which were dehydrided completely under vacuum by heating up to approximately 603 K. Then, the hydriding kinetics at different temperatures was measured under the hydrogen pressure of 3.0 MPa. The dehydriding kinetics at temperatures of 473 K, 493 K and 523 K were measured under a hydrogen pressure of 0.001 MPa.
3. Results and discussions
3.1 Structural characterization
Fig. 1a shows the XRD patterns of the HCS products of Mg100−xNix (x = 0, 5, 10 and 20). For the pure Mg, the peaks of MgH2 and Mg are detected, showing that part of Mg is not fully hydrogenated. In the Mg–Ni composites, Mg and the intermetallic compound of Mg2Ni reacted with hydrogen and led to the formation of MgH2, Mg2NiH4 and Mg2NiH0.3. As the amount of Ni over 5 at%, the peaks of Mg disappears, suggesting Ni facilitates the hydrogenation of Mg. With the addition of Ni, the contents of Mg2NiH4 and Mg2NiH0.3 are also increased. Table 1 presents the results of quantitative phase analysis of the HCS products by Rietveld method. The Rietveld analysis profiles of Mg100−xNix (x = 0, 5, 10 and 20) are shown in Fig. S1.† The XRD patterns of Mg100−xNix (x = 0, 5, 10 and 20) composites after HCS + MM are shown in Fig. 1b. It can be seen that the diffraction peaks of Mg, MgH2, Mg2NiH4 and Mg2NiH4 peaks are significantly broadened, especially for Mg–Ni composites, indicating the crystallites are refined during MM.18 Besides, the relative intensity of Mg2NiH0.3 diffraction peaks are significantly strengthened after MM, especially when x = 10 and 20, which is based on the ratio of diffraction intensity between MgH2 and Mg2NiH0.3. This indicates that part of MgH2 and Mg2NiH4 in the HCS products may have dehydrogenated during MM in argon. The phenomenon is also observed in other studied.28,29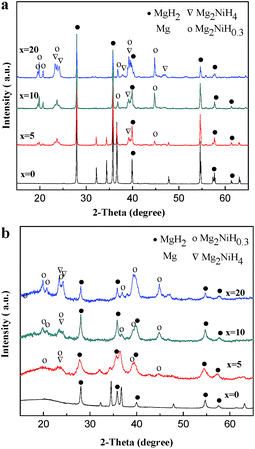 | ||
| Fig. 1 XRD patterns of the HCS product of Mg100−xNix (x = 0, 5, 10 and 20) (a) before and (b) after MM. | ||
| x = | MgH2 (wt%) | Mg2NiH4 (wt%) | Mg2NiH0.3 (wt%) | Mg (wt%) |
|---|---|---|---|---|
| 0 | 66.58 | 0 | 0 | 33.42 |
| 5 | 69.19 | 11.36 | 5.25 | 14.0 |
| 10 | 64.45 | 15.08 | 20.47 | 0 |
| 20 | 33.71 | 38.31 | 27.98 | 0 |
The SEM images of Mg100−xNix (x = 0, 5, 10 and 20) composites after HCS + MM are shown in Fig. 2. It can be seen that the particles are spherical and distribute uniformly. The particle size distribution of Mg100−xNix (x = 0, 5, 10 and 20) composites according to the SEM images (a, b, c, and d) are show in Fig. S2.† All the Mg100−xNix composites have the main particle size below 400 nm. However, as shown in Fig. 2e, the particle size of Mg before MM is much more bigger, indicating that the method of HCS + MM has superiority in the preparation of Mg-based hydrogen storage materials with sub-micron scale. Compared with the pure Mg, the Mg–Ni composites possess relatively smaller and uniform particle size. It reveals that the addition of Ni is helpful for the particle refinement of the composites during the process of MM.
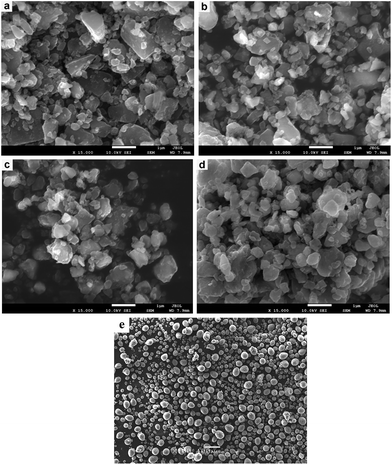 | ||
| Fig. 2 SEM images of Mg100−xNix composites after HCS + MM: (a), (b), (c) and (d) are corresponding to x = 0, 5, 10 and 20, respectively, (e) is the HCS product of Mg before MM. | ||
The composite of Mg90Ni10 was chosen to further study by TEM analysis to investigate the existence and dispersion form of the different phases in the composites after MM. Fig. 3 shows the TEM images of the Mg90Ni10 composite after MM. In the bright field image as shown in Fig. 3a, the black area and gray area is distinguishable. It is more clearly recognized from the dark field image in Fig. 3b that the white points are Ni, which are corresponding to Mg–Ni hydrides. It shows that the Mg–Ni hydrides distribute uniformly in the Mg–Ni composites. The HRTEM images in Fig. 3c and d show that the lattice fringes with a separation of 0.2497 nm agree well with the (101) interplanar spacing of MgH2; and the lattice fringes with a separation of 0.2025 nm agree well with the (203) interplanar spacing of Mg2NiH0.3. Due to the small amount and the incomplete dehydrogenation of Mg2NiH4 during MM, the lattice fringe was not detected.
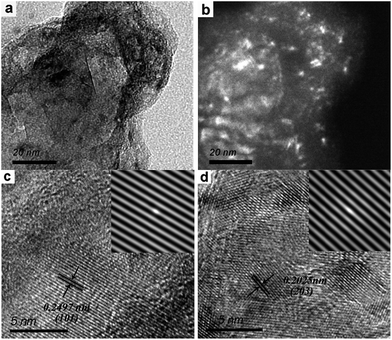 | ||
| Fig. 3 TEM images of the Mg90Ni10 composite after HCS + MM: (a) bright field image; (b) dark field image; (c and d) HRTEM image, the inset in c and d are the IFFT images. | ||
3.2 Hydrogen storage properties of Mg–Ni composites
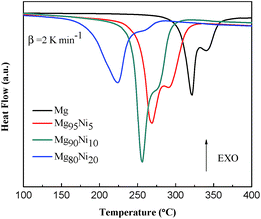
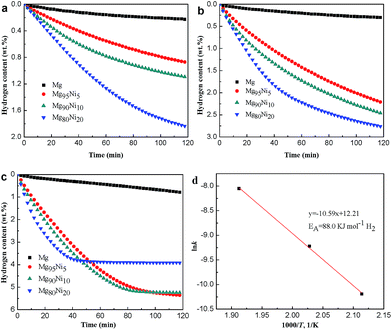
Thermal decomposition properties of Mg100−xNix (x = 0, 5, 10 and 20) composites after HCS + MM were measured by DSC curves at the heating rate of 2 K min−1. As shown in Fig. 4, all the samples show two endothermic peaks. The endothermic peaks were correspond to hydrogen desorption of β-MgH2 and γ-MgH2 by da Conceicao et al.30 whose works are in accordance with us. Liu et al.31 thought the two peaks may be due to bimodal particle size distribution of MgH2 formed during ball milling. As the amount of Ni added to 20 at%, the hydrogen desorption temperature of MgH2 decreased from 320.3/340.4 °C to 223.9/247.3 °C, indicating that the Ni could significantly attribute to the decrease of desorption temperature. Due to the small amount, relatively low hydrogen content and the incomplete dehydrogenation during MM, the hydrogen desorption peak of Mg2NiH4 (∼186 °C shown in Fig. S3†) is not found.Fig. 5 shows the hydrogen absorption curves of the HCS + MM products of Mg100−xNix (x = 0, 5, 10 and 20) at 313 K and 473 K under 3.0 MPa hydrogen pressure. As shown in Fig. 5a, the hydrogen absorption capacities of the Mg100−xNix composites are significantly improved when the atomic ratio of Ni is increased, indicating that the addition of Ni facilitates hydrogen absorption of the composites. The Mg80Ni20 absorbs 3.70 wt% H2 in 1 h at 313 K, though the Mg can hardly absorb hydrogen under the same condition. When the temperature increases to 473 K shown in Fig. 5b, all the samples except Mg exhibit rapid hydriding kinetics and can reach their saturated hydrogen absorption capacity within 100 s. The Mg95Ni5 can absorb 5.80 wt% H2 at 473 K within 100 s. Isothermal hydrogenation curves of Mg100−xNix (x = 0, 5, 10 and 20) composites at 493 K and 523 K under 3.0 MPa hydrogen pressure are shown in Fig. S4.† With the increase of temperature, the amount of hydrogen absorption is increasing. The hydrogen absorption capacities of all the samples at different temperatures are listed in Table S1.†
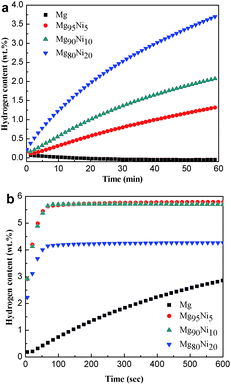 | ||
| Fig. 5 Isothermal hydrogenation curves of the HCS + MM products of Mg100−xNix (x = 0, 5, 10 and 20) at (a) 313 K and (b) 473 K under 3.0 MPa hydrogen pressure. | ||
To investigate the hydrogen desorption kinetics of Mg100−xNix, isothermal dehydrogenation measures were performed at different temperatures. Fig. 6a–c show the isothermal dehydrogenation curves of the HCS + MM products of Mg100−xNix (x = 0, 5, 10 and 20) at 473 K, 493 K and 523 K. A hydrogen desorption capacity of 1.84 wt% can be reached for Mg80Ni20 at 473 K. However, the Mg releases only 0.22 wt% H2 at the same condition. When the temperature is increased, both of the dehydriding kinetics and hydrogen desorption capacities of the composites are improved. At 523 K, the Mg80Ni20 reaches its saturated hydrogen desorption capacity of 3.92 wt% within 50 min, displaying the relatively excellent dehydriding kinetics at low temperature. As for Mg90Ni10, it releases 5.24 wt% H2 within 90 min. For different samples at the same temperature, the dehydriding kinetics and hydrogen desorption capacities are also significantly improved with the addition of Ni. The hydrogen desorption capacities of all the samples at different temperatures are listed in Table S2.†
The XRD pattern of Mg100−xNix (x = 0, 5, 10 and 20) composites after dehydrogenation at 523 K are shown in Fig. S5.† Mg and Mg2Ni are detected for the Mg–Ni composites, indicating the complete dehydrogenation at 523 K. As for pure Mg, there is also many MgH2. Due to the poor dehydriding kinetics, MgH2 can not be fully dehydrogenated at 523 K.
The experimental results have demonstrated that the hydrogen storage properties of Mg–Ni composites are considerably enhanced compared with pure Mg. To further understand the dehydriding kinetics mechanism, the Johnson–Mehl–Avrami (JMA) kinetic model was used to describe the hydrogen desorption.32,33 The Mg90Ni10 with relatively better properties was chosen to further study. The equation of JMA model is presented below:
ln[−ln(1 − α)] = n![[thin space (1/6-em)]](https://www.rsc.org/images/entities/char_2009.gif) ln ln![[thin space (1/6-em)]](https://www.rsc.org/images/entities/char_2009.gif) t + n t + n![[thin space (1/6-em)]](https://www.rsc.org/images/entities/char_2009.gif) ln ln![[thin space (1/6-em)]](https://www.rsc.org/images/entities/char_2009.gif) k k
| (1) |
According to the kinetic model, different k values of the dehydrogenation curves at 473 K, 493 K and 523 K were attained. Afterwards, the activation energy for dehydrogenation was obtained according to the Arrhenius equation presented below:
| k = Ae−Ea/RT | (2) |
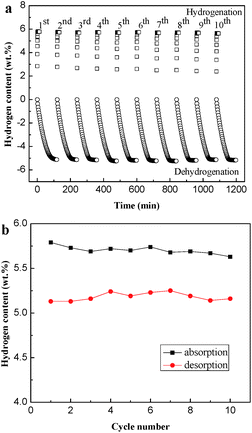
Isothermal hydrogenation and dehydrogenation cycling kinetics of the Mg90Ni10 have been measured for 10 cycles at 523 K to prove the cycling stability. As shown in Fig. 7a, the hydriding kinetics of the composite from the 1st to the 10th cycle remain almost the same, which can reach its saturated hydrogen capacity within 100 s. The saturated hydriding capacity is 5.63 wt% in the 10th hydriding cycle, only 0.16 wt% loss compared with the 1st hydriding cycle shown in Fig. 7b. As for the dehydrogenation process, only 0.12 wt% difference between the maximum (5.25 wt%) and the minimum values (5.13 wt%) of the hydrogen desorption capacity. Due to the inevitable reaction time for instrument and people, the capacity of hydrogen desorption at 523 K is a litter lower than hydrogen absorption. The cyclic hydriding/dehydriding properties illustrate the excellent cycling stability of the Mg–Ni composites.
3.3 Effects of atomic ratio of Ni on the hydrogen storage properties of Mg–Ni composites
As shown above, the hydriding/dehydriding kinetics of pure Mg is poor. However, with 5 at% Ni added, the saturated hydrogen absorption capacity of Mg rises from 3.25 wt% to 5.80 wt% at 473 K and can reach its saturated hydrogen absorption capacity within 100 s. The hydriding/dehydriding kinetics and hydrogen storage capacity are significantly improved. At 523 K, it can also release 5.36 wt%. With the content of Ni increased to 20 at%, the Mg80Ni20 absorbs 3.7 wt% H2 at 313 K and releases 1.84 wt% H2 at 473 K. The properties of Mg80Ni20 at low temperature are remarkable in the field of hydrogen storage. The amount of Ni is related greatly to the hydriding/dehydriding properties of Mg100−xNix, which makes the hydrogen storage capacity and hydriding/dehydriding kinetics regulable. Besides, the excellent cycling stability is also obtained for Mg with the effect of Ni. The Mg–Ni composites with better hydriding/dehydriding kinetics at low temperature or higher hydrogen storage capacity can be easily obtained with the reasonable amount of Ni through the method of HCS + MM.After the process of MM, the Mg–Ni composites are considered as having a smaller particle size as shown in Fig. S2.† Through MM, Mg–Ni hydrides may inlay and disperse on the MgH2 surface, restraining the MgH2 particles from growing during MM. Besides, due to the difference of brittleness between MgH2 and Mg–Ni hydrides, they may interact with each other and improve the efficiency of MM. The broad trend of diffraction peaks shown in Fig. 1b also indicates the refinement of crystallite size. The average crystallite sizes of MgH2 in different samples after MM are estimated according to the Scherrer equation:
D = Kλ/β![[thin space (1/6-em)]](https://www.rsc.org/images/entities/char_2009.gif) cos cos![[thin space (1/6-em)]](https://www.rsc.org/images/entities/char_2009.gif) θ θ
| (3) |
Besides, the dissociation of hydrogen molecules is very slowly on the magnesium surface due to the large energy barrier of the hydrogen dissociation, which limits the rate of the hydrogenation/dehydrogenation process. However, the hydrogen molecules can rapidly spitted into hydrogen atoms on the Mg2Ni surface due to the catalytic effect of nickel in the Mg–Ni composites shown in period 2 of Fig. 8. In addition, Mg–Ni hydrides of Mg2NiH4 also has a smaller enthalpy compared with MgH2 (the enthalpy of desorption for MgH2 and Mg2NiH4 are 76 kJ mol−1 H2 and 60.8 kJ mol−1 H2, respectively),36,37 it is much easier to absorb/release hydrogen compared with MgH2 in the hydrogenation/dehydrogenation process (shown in period 3 of Fig. 8). Therefore, the widely dispersed, Mg2Ni in Mg–Ni composites can significantly facilitate hydrogen dissociation. So the hydrogen storage properties of Mg100−xNix (x = 0, 5, 10 and 20) composites are extremely related to the amount of Mg–Ni hydrides. The Mg80Ni20 composite with the largest amount of Mg2NiH0.3 and Mg2NiH4 shows the most excellent performance at low temperature.
4. Conclusions
In this study, the Mg100−xNix (x = 0, 5, 10 and 20) composites with the phases of MgH2, Mg2NiH4, Mg2NiH0.3 and Mg (Mg just for x = 0 and 5) are prepared by HCS. The Mg–Ni hydrides distribute uniformly in the Mg–Ni composites. With the addition of Ni, the hydrogenation degree of Mg is significantly improved. The hydrogen storage properties of Mg–Ni composites at low temperature are excellent and become regulable by controlling the amount of Ni. With 5 at% Ni added, the hydrogen absorption capacity of Mg rises to 5.86 wt% at 523 K. As for Mg80Ni20 without any activation, it absorbs 3.7 wt% H2 at 313 K within 1 h and releases 1.84 wt% H2 at 473 K. With more Ni added, the hydrogen storage properties at low temperature tend to be more excellent. The excellent properties should attribute to Mg2Ni, which can significantly facilitate hydrogen diffusion. The method of hydriding combustion synthesis follow by mechanical milling is proved to have superiority in the preparation of Mg-based hydrogen storage materials with excellent properties.Acknowledgements
This work was supported by the National Natural Science Foundation of China (51471087, 51171079), Natural Science Foundation of the Jiangsu Higher Education Institutions of China (13KJA430003), Innovation Foundation for Graduate Students of Jiangsu Province (KYLX_0741, CXZZ13_0420), Qing Lan Project and the Priority Academic Program Development (PAPD) of Jiangsu Higher Education Institutions.Notes and references
- L. Schlapbach, Nature, 2009, 460, 809–811 CrossRef CAS PubMed.
- W. P. Qin, W. X. Cao, H. L. Liu, Z. Li and Y. W. Li, RSC Adv., 2014, 4, 2414–2420 RSC.
- G. Q. Li, H. Kobayashi, J. M. Taylor, R. Ikeda, Y. Kubota, K. Kato, M. Takata, T. Yamamoto, S. Toh, S. Matsumura and H. Kitagawa, Nat. Mater., 2014, 13, 802–806 CrossRef CAS PubMed.
- J. Germain, J. M. Fréchet and F. Svec, Small, 2009, 5, 1098–1111 CrossRef CAS PubMed.
- A. C. Dillon, K. M. Jones, T. A. Bekkedahl, C. H. Kiang, D. S. Bethune and M. J. Heben, Nature, 1997, 386, 377–379 CrossRef CAS PubMed.
- S. H. Aboutalebi, S. Aminorroaya-Yamini, I. Nevirkovets, K. Konstantinov and H. K. Liu, Adv. Energy Mater., 2012, 2, 1439–1446 CrossRef CAS PubMed.
- C. Pistidda, N. Bergemann, J. Wurr, A. Rzeszutek, K. T. Møller, B. R. S. Hansen, S. Garroni, C. Horstmann, C. Milanese, A. Girella, O. Metz, K. Taube, T. R. Jensen, D. Thomas, H. P. Liermann, T. Klassen and M. Dornheim, J. Power Sources, 2014, 270, 554–563 CrossRef CAS PubMed.
- H. Z. Liu, C. Wu, H. Zhou, T. Chen, Y. A. Liu, X. H. Wang, Z. H. Dong, H. W. Ge, S. Q. Li and M. Yan, RSC Adv., 2015, 5, 22091–22096 RSC.
- Y. N. Liu, J. X. Zou, X. Q. Zeng and W. J. Ding, RSC Adv., 2015, 5, 7687–7696 RSC.
- D. L. Croston, D. M. Grant and G. S. Walker, J. Alloys Compd., 2010, 492, 251–258 CrossRef CAS PubMed.
- B. Kuchta, L. Firlej, A. Mohammadhosseini, P. Boulet, M. Beckner, J. Romanos and P. Pfeifer, J. Am. Chem. Soc., 2012, 134, 15130–15137 CrossRef CAS PubMed.
- I. E. Malka, T. Czujko and J. Bystrzycki, Int. J. Hydrogen Energy, 2010, 35, 1706–1712 CrossRef CAS PubMed.
- J. Lu, Y. J. Choi, Z. Z. Fang, H. Y. Sohn and E. Ronnebro, J. Am. Chem. Soc., 2010, 132, 6616–6617 CrossRef CAS PubMed.
- C. Zloteaa, F. Cuevas, J. Andrieux, C. M. Ghimbeu, E. Leroy, E. Leonel, S. Sengmany, C. Vix-Guterl, R. Gadiou, T. Martens and M. Latroche, Nano Energy, 2013, 2, 12–20 CrossRef PubMed.
- Y. N. Liu, J. X. Zou, X. Q. Zeng, X. M. Wu, H. Y. Tian, W. J. Ding, J. Wang and A. Walter, Int. J. Hydrogen Energy, 2013, 38, 5302–5308 CrossRef CAS PubMed.
- T. K. Nielsen, K. Manickam, M. Hirscher, F. Besenbacher and T. R. Jensen, ACS Nano, 2009, 3, 3521–3528 CrossRef CAS PubMed.
- M. Konarova, A. Tanksale, J. N. Beltramini and G. Q. Lu, Nano Energy, 2013, 2, 98–104 CrossRef CAS PubMed.
- Y. P. Pang, Y. F. Liu, X. Zhang, M. X. Gao and H. G. Pan, Int. J. Hydrogen Energy, 2013, 38, 1460–1468 CrossRef CAS PubMed.
- G. B. Xin, J. Z. Yang, H. Fu, W. Li, J. Zheng and X. G. Li, RSC Adv., 2013, 3, 4167–4170 RSC.
- Y. P. Pang, Y. F. Liu, M. X. Gao, L. Z. Ouyang, J. W. Liu, H. Wang, M. Zhu and H. G. Pan, Nat. Commun., 2014, 5, 3519–3527 Search PubMed.
- C. Y. Zhu, S. Hosokai, I. Matsumoto and T. Akiyama, Cryst. Growth Des., 2010, 10, 5123–5128 CAS.
- K. J. Jeon, H. R. Moon, A. M. Ruminski, B. Jiang, C. Kisielowski, R. Bardhan and J. J. Urban, Nat. Mater., 2011, 10, 286–290 CrossRef CAS PubMed.
- T. Liu, C. G. Chen, F. Wang and X. G. Li, J. Power Sources, 2014, 267, 69–77 CrossRef CAS PubMed.
- L. Q. Li, T. Akiyama and J. Yagi, J. Alloys Compd., 2001, 316, 118–123 CrossRef CAS.
- J. G. Yuan, Y. F. Zhu and L. Q. Li, Chem. Commun., 2014, 50, 6641–6644 RSC.
- Y. J. Tan, Y. F. Zhu and L. Q. Li, Chem. Commun., 2015, 51, 2368–2371 RSC.
- H. M. Rietveld, J. Appl. Crystallogr., 1969, 2, 65–71 CrossRef CAS.
- W. Chen, Y. F. Zhu, C. Yang, J. G. Zhang, M. H. Li and L. Q. Li, J. Power Sources, 2015, 280, 132–140 CrossRef CAS PubMed.
- A. Zaluska, L. Zaluski and J. O. Strom-Olsen, J. Alloys Compd., 1999, 289, 197–206 CrossRef CAS.
- M. O. T. da Conceição, M. C. Brum, D. S. dos Santos and M. L. Dias, J. Alloys Compd., 2013, 550, 179–184 CrossRef PubMed.
- G. Liu, Y. J. Wang, C. C. Xu, F. Y. Qiu, C. H. An, L. Li, L. F. Jiao and H. T. Yuan, Nanoscale, 2013, 5, 1074–1081 RSC.
- T. Liu, C. G. Qin, M. Zhu, Y. R. Cao, H. L. Shen and X. G. Li, J. Power Sources, 2012, 219, 100–105 CrossRef CAS PubMed.
- Z. S. Wronski, G. J. C. Carpenter, T. Czujko and R. A. Varin, Int. J. Hydrogen Energy, 2010, 36, 1159–1166 CrossRef PubMed.
- C. Y. Zhu and T. Akiyama, Cryst. Growth Des., 2012, 12, 4043–4052 CAS.
- Y. J. Choi, J. Lu, H. Y. Sohn and Z. Z. Fang, J. Power Sources, 2008, 180, 491–497 CrossRef CAS PubMed.
- K. F. Aguey-Zinsou and J. R. Ares-Fernandez, Energy Environ. Sci., 2010, 3, 526–543 CAS.
- X. F. Liu, Y. F. Zhu and L. Q. Li, J. Alloys Compd., 2008, 455, 197–202 CrossRef CAS PubMed.
Footnote |
| † Electronic supplementary information (ESI) available. See DOI: 10.1039/c5ra09754a |
| This journal is © The Royal Society of Chemistry 2015 |

