Opposite particle size effects on the adsorption kinetics of ZIF-8 for gaseous and solution adsorbates†
Xinxin Fan,
Junwen Zhou,
Teng Wang,
Jie Zheng* and
Xingguo Li*
Beijing National Laboratory for Molecular Sciences (BNLMS), (The State Key Laboratory of Rare Earth Materials Chemistry and Applications), College of Chemistry and Molecular Engineering, Peking University, Beijing, 100871, China. E-mail: zhengjie@pku.edu.cn; xgli@pku.edu.cn; Fax: +86 10 6276 5930; Tel: +86 10 6276 5930
First published on 30th June 2015
Abstract
ZIF-8 shows complete opposite particle size effects on the adsorption kinetics for two different adsorbates. Smaller ZIF-8 particles favor fast I3− uptake in aqueous solution while larger, less defective ZIF-8 particles exhibit faster adsorption kinetics for gaseous H2, which suggests different adsorption mechanisms for the two adsorbates.
Porous materials have many important applications related to their adsorption ability, such as gas storage, separation and hazard removal for purification of water or ambient air.1–4 In real applications, the adsorption kinetics of porous materials is an important concern aside from the adsorption capacity. Therefore, it is highly desirable to understand the structure parameters that determine the adsorption kinetics.5,6
There have been many studies on the adsorption kinetics of porous materials, covering different porous materials, such as porous carbon, zeolites and metal organic frameworks (MOFs), using different probing molecules, including various gases, vapour of water, organic compounds and molecules dissolved in solution.7–14 Most of these studies focused on the effect of the pore structure, such as total pore volume, size and shape of the pores and specific binding sites inside the pores. However, all these porous materials have finite particle size, and there have been very few studies on how the particle size of a porous material affects the adsorption kinetics. Such studies are mainly limited by the unavailability of porous materials with uniform particle size.
Recently, there have been rapid progress in preparation of MOF nanoparticles with controlled size, which makes it possible to study the particle size effect on the adsorption behaviours.15 Here we use ZIF-8 as a prototypical porous material to study the particle size effect on the adsorption kinetics for two representative probing molecules, I3− and H2. ZIF-8 is composed of Zn2+ and 2-methylimidazole (H-MeIM) and is one of the most studied MOF systems, which is commercially available as Basolite Z1200.16 Particularly, there have been several well established methods to prepare ZIF-8 particles with different particle size.17–19
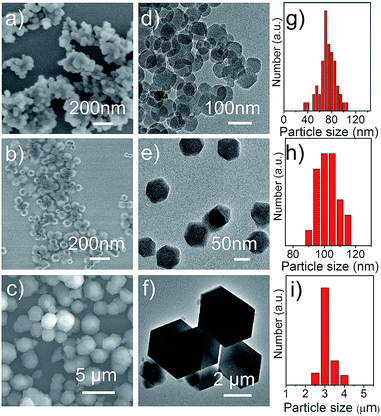
In this study, three ZIF-8 samples with varied particle sizes were prepared in different solvents. Detailed preparation methods are given in the ESI† or found in previous publications.19,20 As shown in Fig. 1, ZIF-8 nanocrystals prepared in an aqueous emulsion (ZIF-8_water) exhibit irregular shape with particle size of 70 ± 13 nm (Fig. 1a and d). ZIF-8 nanocrystals prepared in methanol show well defined polyhedral shape and slightly larger average particle size of 100 ± 7 nm (Fig. 1b and e). ZIF-8 prepared in ethanol (ZIF-8_ethanol) shows much larger particle size of 3 ± 0.3 μm, also with well-defined polyhedral shape (Fig. 1c and f). X-ray diffraction (XRD, Fig. S1a†) results indicate that the three ZIF-8 samples are composed of pure ZIF-8 phase without crystalline impurities.
The N2 sorption isotherms of the three ZIF-8 samples (Fig. S1b–d†) exhibit typical features corresponding to microporous materials. The specific surface areas (SSA) obtained using the Brunauer–Emmett–Teller (BET) model are 1360, 1769 and 1846 m2 g−1 for ZIF-8_water, ZIF-8_methanol and ZIF-8_ethanol, respectively. The SSAs of the ZIF-8_methanol and ZIF-8 ethanol samples are close to the maximum value for ZIF-8 reported in literature,17 while the ZIF-8_water sample, which is prepared in the presence of surfactant, shows much lower SSA. Although most surfactants can be removed by thorough refluxing in ethanol, some surfactant molecules that are strongly adsorbed or deeply enclosed by the ZIF-8 particles may still remain, which results in lower SSA of the ZIF-8_water sample.
The three ZIF-8 samples exhibit slightly different pore size distribution (Fig. S1e†). All the three samples show a high peak in the micropore region centred at 1.07 nm, which corresponds to the large cage (geometric diameter of 1.16 nm) in ZIF-8 structure. As the particle size becomes smaller, this peak becomes broader and small shoulder peaks start to appear, which can be ascribed to some distorted/blocked pores. Such defective pores are more likely to locate near the external surface. Therefore, smaller particles contain more such defective pores. Expect for the micropore region (<2 nm), nanoparticles also have small fraction of mesopores in the 2–50 nm region which are stemmed from the interparticle space of the nanoparticles. This effect is more notable for aggregated nanoparticles, i.e. the ZIF-8_water sample in this case.
As a summary for the structural characterization results, the three ZIF-8 samples have the same topological pore structural but different particle sizes. The difference in SSA, total pore volume and pore size distribution is also related to the particle size. Although adsorption kinetics can be affected by a number of structural parameters, using the above three ZIF-8 samples makes it possible to focus on the particle size effect.
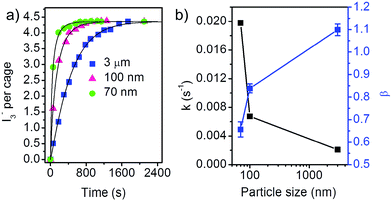
We first looked at the adsorption in aqueous solution, which was studied by using I3− as the probing species. ZIF-8 has a sodalite porous structure, in which larger cages with diameter of 11.6 Å are connected by narrow windows with diameter of 3.4 Å.16 I3− is a linear anion with width of 2.6 Å and length of 3.35 Å, which is sufficiently small to fit into the cages of ZIF-8. Fig. 2a shows the variation of the number of I3− adsorbed by per cage of ZIF-8 versus time for ZIF-8 samples with different particle size. Degassed ZIF-8 is fed to the I3− solution, and the adsorption amount is calculated from the change of the concentration of I3−, monitored by the absorbance of the characteristic absorption peak of I3− at 287 nm in UV-Vis spectra (Fig. S4†). Within 35 min, all the samples reach equilibrium with the same I3− concentration. The uptake of I3− at the equilibrium state is calculated to be 1.09 per formula unit of ZIF-8 (Zn-MeIM2), or 4.36 per cage. Such high uptake implies that the adsorption of I3− must occur inside the pores of ZIF-8 rather than on the external surface. For comparison, the amount of adsorption on the external surface is only 0.001 molecules per formula unit for 70 nm ZIF-8 nanoparticles, as estimated by the adsorption of Rhodamine B molecules which are larger than the window of ZIF-8.19
 | ||
| Fig. 2 (a) Adsorption kinetics of I3− in water by ZIF-8 samples with different particle size. The solid curves are the fit results by the stretched exponential function (eqn (1)). (b) The fitting parameters k and β in the stretched exponential function for different ZIF-8 samples. | ||
Despite of the same equilibrium adsorption capacity of the three ZIF-8 samples, the adsorption kinetics shows strong dependence on the particle size of ZIF-8. Clearly, the adsorption is faster for ZIF-8 samples with smaller particle size. It should be noted that for the adsorption kinetics, the SSA and pore volume of ZIF-8 play a minor role. ZIF-8_water with 70 nm particle size shows the highest adsorption rate though it has the lowest SSA and pore volume.
The adsorption kinetics can be well fitted by a stretched exponential function:
| f(t) = 1 − exp[−(kt)β] | (1) |
The fitting parameters k and β for the three samples are summarized in Fig. 2b. The 3 μm ZIF-8 sample has β value close to 1, which means that the adsorption can also be described by the linear driving force model.21 The ZIF-8 samples with smaller size shows smaller β value, which is indicated by the accelerated initial adsorption rate. Smaller β value is indicative of non-uniform relaxation time.12 The rate constant k monotonically increases for smaller ZIF-8 particle size.
The above particle size dependence suggests that the diffusion inside the porous ZIF-8 particle is the rate limiting step. Although both the width and length of I3− are smaller than the window width of ZIF-8, the transport through the narrow windows might still cause a barrier for the intra-particle diffusion. Smaller particle size will enhance the adsorption kinetics due to the larger external surface area and reduced diffusion length.
The adsorption in gas phase is studied by H2 adsorption at 77 K. Cryogenic adsorption of H2 by porous materials such as MOFs has been extensively studied as a potential hydrogen storage technology.22–24 The H2 adsorption isotherms of the ZIF-8 samples from 0–1 bar are shown in Fig. S2.† In the low pressure region (0–0.1 bar), the adsorption isotherms are linear and the adsorption capacity is similar for the three samples. The adsorption starts to show saturation trends as the H2 pressure increases. H2 molecules will preferably bind to the strongest adsorption sites. Deviation from the linearity as H2 pressure increases is indicative of weaker adsorption for the additional H2 molecules, which is caused by the unavailability of the strong adsorption sites or the interaction between the adsorbed H2 molecules. The adsorption capacity at 1 bar H2 shows positive correlation with their SSA: ZIF-8_ethanol ≈ ZIF-8_methanol > ZIF-8_water, which is in agreement with the general law of cryogenic hydrogen adsorption by porous materials.22,23
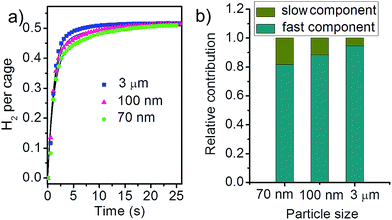
The kinetic data is given at an equilibrium pressure of ∼0.06 bar which is within the linear region for all the three samples. The corresponding equilibrium uptake capacity is 12 cm3 H2 per gramme ZIF-8, or 0.52 H2 per cage. At this equilibrium H2 pressure, the three samples exhibit almost identical uptake capacity despite of their different SSA and total pore volume (Fig. S2†). This will largely exclude the influence of different SSA and total pore volume and simplify the following analysis for the adsorption kinetics. All samples reach adsorption equilibrium within 20 s, much faster compared to the adsorption of I3−. However, the difference in the kinetics can still be clearly identified. The dependence on the particle size is completely opposite to that observed in the liquid phase: larger particles exhibit faster adsorption kinetics in this case.
The adsorption kinetics for H2 in the gas phase can be modelled by a double exponential function:
f(t) = 1 − [A1![[thin space (1/6-em)]](https://www.rsc.org/images/entities/char_2009.gif) exp(−k1t) + A2 exp(−k1t) + A2![[thin space (1/6-em)]](https://www.rsc.org/images/entities/char_2009.gif) exp(−k2t)] exp(−k2t)]
| (2) |
The double exponential model assumes that there are two kinetic barriers for the adsorption. The slow and fast processes are characterized by the rate constants k1 and k2 (k1 < k2), respectively. The relative contribution of the slow and fast components are given by A1 and A2, where A1 + A2 = 1.10–12,25
In the ln(1 − f(t))–t plot, there clearly show different slopes in the initial uptake stage and after sufficiently long time (Fig. S3†), indicating that the adsorption kinetics contains two components with different decay rates. The three ZIF-8 samples have similar k1 (0.08 ± 0.02 s−1) and k2 (0.80 ± 0.05 s−1) values within the fitting error. The above k1 and k2 values give very good fit for the adsorption kinetics of the three ZIF-8 samples (Fig. 3b, the solid curves). The difference in kinetics, therefore, can be attributed to the different contribution of the slow and fast components. As shown in Fig. 3b, the contribution from the fast component increases as the ZIF-8 particles become larger.
 | ||
| Fig. 3 (a) Adsorption kinetics of H2 at 77 K by ZIF-8 samples with different particle size. The solid curves are the fit results by the double exponential function (eqn (2)). (b) The relative contribution of the fast and slow components for the three ZIF-8 samples. | ||
H2 molecules are much easier to transport through the narrow channels in the ZIF-8 structure due to their much smaller size (width 1.0 Å and length 2.89 Å) and higher diffusivity.26 However, there exists some defective regions where the pores are distorted or blocked to some extent, which will result in a higher barrier for the transport of H2 molecules. Therefore, we propose that the slow and fast processes describe the H2 transport through the distorted/blocked and well defined pores, respectively. The adsorption kinetics is controlled by the slow process which is directly related to the defective region in the ZIF-8 structure. As the region close to the external surface tends to be more defective, smaller ZIF-8 particles usually contain more distorted/blocked pores due to their larger external surface area. This is in agreement with the reduced SSA for smaller particles (Table S1†). In the pore size distribution graph (Fig. S1e†), smaller particles show higher fraction of pores smaller than the ZIF-8 cage, which is also indicative of distorted/blocked pores. Therefore, smaller ZIF-8 particles, due to higher fraction of distorted/block pores, exhibit slower H2 adsorption kinetics.
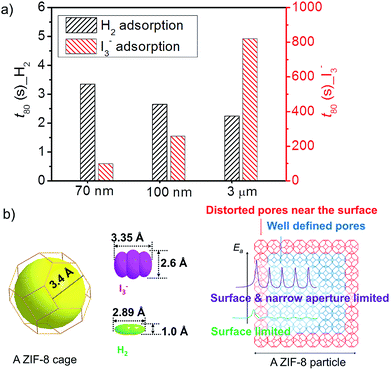
The opposite particle size effect on the adsorption kinetics for I3− in aqueous solution and H2 in gas phase is summarized in Fig. 4a. We use a simple time parameter t80, defined as the time to reach 80% of the equilibrium adsorption amount, to compare the adsorption kinetics for the two adsorbates. Clearly, smaller particles are favorable for fast uptake of I3− in aqueous solution while exhibit slower kinetics for cryogenic H2 adsorption. Moreover, the difference in t80 due to the particle size effect is relatively small for H2 adsorption while significantly larger for I3− adsorption.
The adsorption of both I3− and H2 by ZIF-8 in this study dominantly occurs inside the pores. Therefore, the adsorption involves the interaction with the pores and the transport inside the porous particles. For the same porous material, the interaction term is the same. Therefore, the difference in the adsorption kinetics for the three ZIF-8 samples is mainly determined by the intra-particle transport. For ZIF-8 with finite particle size, the intra-particle transport of the adsorbates is limited by both the intrinsic narrow channels in the framework and the distorted/blocked pores in the defective region. As the ZIF-8 samples in this study are highly crystalline, distorted/blocked pores only amount to a very small fraction and are mostly enriched near the external surface of the particles (Fig. 4b).
H2 is a small molecule with high diffusivity, which can easily pass through the narrow channels if the channels are well defined. Therefore, the transport is mainly limited by the distorted/blocked pores near the external surface region.26,27 In this case, smaller particles will show slower adsorption kinetics due to their larger external surface, i.e. more distorted/blocked pores. As schematically illustrated in Fig. 4b, the major barrier for H2 transport is near the external surface of the ZIF-8 particles. Once the H2 molecules penetrate the surface defective region, the transport through the well-defined pores only requires very low activation energy. The adsorption of H2, therefore, is limited by the defective region near external surface. Larger, less defective ZIF-8 particles will show faster adsorption kinetics.
The transport of I3−, on the other hand, is also constrained by the narrow channels due to the much larger size of I3−. The length of I3− is already comparable to the window width of ZIF-8. Congestion may occur when the I3− anions penetrate the narrow windows of ZIF-8 in specific orientations.28,29 As shown in Fig. 4b, although the transport through the distorted/blocked pores near the external surface is more difficult, the transport through the well-defined pores also requires high activation energy. Considering the fact that the distorted/blocked pores only consist of very low fraction, the adsorption kinetics of I3−, therefore, is mainly limited by the intra-particle bulk diffusion. In this case, smaller particle size will enhance the adsorption kinetics.
Conclusions
In summary, three ZIF-8 samples with different particle size were prepared and their adsorption kinetics for I3− in aqueous solution and H2 in gas phase was studied. Completely opposite particle size dependence on the adsorption kinetics is observed. For adsorption of I3− in aqueous solution which is limited by the intra-particle bulk diffusion, fast adsorption kinetics is observed for smaller particles due to their reduced diffusion length. The adsorption of H2 in the gas phase is limited by the transport through the distorted/block pores near the external surface. In this case, smaller particles show slower adsorption kinetics due to their larger external surface. The particle size effect on the adsorption kinetics reported here will provide useful guideline for facile adjustment of the particle size of porous materials to achieve rapid adsorption for a specific adsorbate in varied applications such as gas storage, separation and water purification.Acknowledgements
The study is supported by National Natural Science Foundation of China (No. U1201241, 11375020, 51431001 and 21321001).Notes and references
- J. Sculley, D. Yuan and H.-C. Zhou, Energy Environ. Sci., 2011, 4, 2721–2735 CAS.
- J. Lee, O. K. Farha, J. Roberts, K. A. Scheidt, S. T. Nguyen and J. T. Hupp, Chem. Soc. Rev., 2009, 38, 1450–1459 RSC.
- Z. P. Lai, G. Bonilla, I. Diaz, J. G. Nery, K. Sujaoti, M. A. Amat, E. Kokkoli, O. Terasaki, R. W. Thompson, M. Tsapatsis and D. G. Vlachos, Science, 2003, 300, 456–460 CAS.
- B. K. Jung, J. W. Jun, Z. Hasan and S. H. Jhung, Chem.–Eng. J., 2015, 267, 9–15 CrossRef CAS PubMed.
- Z. S. Xu, Q. Kang, T. T. Cai, T. T. Huang, P. Zhang and D. Z. Shen, Thin Solid Films, 2014, 556, 325–332 CrossRef CAS PubMed.
- S. H. Jhung, J. H. Lee, J. W. Yoon, C. Serre, G. Férey and J. S. Chang, Adv. Mater., 2007, 19, 121–124 CrossRef CAS PubMed.
- A. J. Fletcher, Y. Yuzak and K. M. Thomas, Carbon, 2006, 44, 989–1004 CrossRef CAS PubMed.
- X. B. Zhao, S. Villar-Rodil, A. J. Fletcher and K. M. Thomas, J. Phys. Chem. B, 2006, 110, 9947–9955 CrossRef CAS PubMed.
- C. R. Reid and K. M. Thomas, J. Phys. Chem. B, 2001, 105, 10619–10629 CrossRef CAS.
- A. J. Fletcher, E. J. Cussen, D. Bradshaw, M. J. Rosseinsky and K. M. Thomas, J. Am. Chem. Soc., 2004, 126, 9750–9759 CrossRef CAS PubMed.
- B. L. Chen, X. Zhao, A. Putkham, K. Hong, E. B. Lobkovsky, E. J. Hurtado, A. J. Fletcher and K. M. Thomas, J. Am. Chem. Soc., 2008, 130, 6411–6423 CrossRef CAS PubMed.
- L. J. Li, J. G. Bell, S. F. Tang, X. X. Lv, C. Wang, Y. L. Xing, X. B. Zhao and K. M. Thomas, Chem. Mater., 2014, 26, 4679–4695 CrossRef CAS.
- D. Saha, Z. B. Bao, F. Jia and S. G. Deng, Environ. Sci. Technol., 2010, 44, 1820–1826 CrossRef CAS PubMed.
- E. Haque, J. W. Jun and S. H. Jhung, J. Hazard. Mater., 2011, 185, 507–511 CrossRef CAS PubMed.
- E. A. Flugel, A. Ranft, F. Haase and B. V. Lotsch, J. Mater. Chem., 2012, 22, 10119–10133 RSC.
- K. S. Park, Z. Ni, A. P. Côté, J. Y. Choi, R. Huang, F. J. Uribe-Romo, H. K. Chae, M. O'Keeffe and O. M. Yaghi, Proc. Natl. Acad. Sci. U. S. A., 2006, 103, 10186–10191 CrossRef CAS PubMed.
- J. Cravillon, R. Nayuk, S. Springer, A. Feldhoff, K. Huber and M. Wiebcke, Chem. Mater., 2011, 23, 2130–2141 CrossRef CAS.
- Y. Pan, Y. Liu, G. Zeng, L. Zhao and Z. Lai, Chem. Commun., 2011, 47, 2071–2073 RSC.
- X. Fan, W. Wang, W. Li, J. Zhou, B. Wang, J. Zheng and X. Li, ACS Appl. Mater. Interfaces, 2014, 6, 14994–14999 CAS.
- J. Zhou, X. Yu, X. Fan, X. Wang, H. Li, Y. Zhang, W. Li, J. Zheng, B. Wang and X. Li, J. Mater. Chem. A, 2015, 3, 8272–8275 CAS.
- J. Klafter and M. F. Shlesinger, Proc. Natl. Acad. Sci. U. S. A., 1986, 83, 848–851 CrossRef CAS.
- L. J. Murray, M. Dinca and J. R. Long, Chem. Soc. Rev., 2009, 38, 1294–1314 RSC.
- H. Nishihara, P. X. Hou, L. X. Li, M. Ito, M. Uchiyama, T. Kaburagi, A. Ikura, J. Katamura, T. Kawarada, K. Mizuuchi and T. Kyotani, J. Phys. Chem. C, 2009, 113, 3189–3196 CAS.
- S. S. Kaye, A. Dailly, O. M. Yaghi and J. R. Long, J. Am. Chem. Soc., 2007, 129, 14176–14177 CrossRef CAS PubMed.
- A. J. Fletcher, E. J. Cussen, T. J. Prior, M. J. Rosseinsky, C. J. Kepert and K. M. Thomas, J. Am. Chem. Soc., 2001, 123, 10001–10011 CrossRef CAS PubMed.
- Q. Liu, N. Wang, J. Caro and A. Huang, J. Am. Chem. Soc., 2013, 135, 17679–17682 CrossRef CAS PubMed.
- H. J. Choi, M. Dincă and J. R. Long, J. Am. Chem. Soc., 2008, 130, 7848–7850 CrossRef CAS PubMed.
- J. He, J. Duan, H. Shi, J. Huang, J. Huang, L. Yu, M. Zeller, A. D. Hunter and Z. Xu, Inorg. Chem., 2014, 53, 6837–6843 CrossRef CAS PubMed.
- G. Massasso, J. Long, C. Guerin, A. Grandjean, B. Onida, Y. Guari, J. Larionova, G. Maurin and S. Devautour-Vinot, J. Phys. Chem. C, 2015, 119, 9395–9401 CAS.
Footnote |
| † Electronic supplementary information (ESI) available: Details of ZIF-8 sample preparations, measurements of adsorption kinetics, Fig. S1–S4 and Table S1. See DOI: 10.1039/c5ra09981a |
| This journal is © The Royal Society of Chemistry 2015 |


