
Excellent tribological and anti-corrosion performance of polyurethane composite coatings reinforced with functionalized graphene and graphene oxide nanosheets†
Mengting Moab,
Wenjie Zhao*a,
Zifei Chenab,
Quanyao Yuab,
Zhixiang Zeng*a,
Xuedong Wua and
Qunji Xuea
aKey Laboratory of Marine Materials and Related Technologies, Zhejiang Key Laboratory of Marine Materials and Protective Technologies, Ningbo Institute of Materials Technology and Engineering, Chinese Academy of Sciences, Ningbo 315201, P.R. China. E-mail: zhaowj@nimte.ac.cn; zengzhx@nimte.ac.cn; Tel: +86-0574-86694901, +86-0574-86685809
bUniversity of Chinese Academy of Sciences, Beijing, 100049, P.R. China
First published on 19th June 2015
Abstract
In order to improve the mechanical durability, polyurethane (PU) needs to be modified to enhance the tribological and anti-corrosion properties. In this work, we fabricated a series of PU composite coatings reinforced with functionalized graphene (FG) and functionalized graphene oxide (FGO). The structural and morphological features of the composite coatings were characterized by Fourier transform infrared spectroscopy, Raman spectroscopy, X-ray diffraction, transmission electron microscopy and scanning electron microscopy. The results showed that the dispersion and compatibility of graphene and graphene oxide were improved via chemical modification. Moreover, they effectively enhanced the tribological and anti-corrosion properties of PU composite coatings, whose optimized additive range was between 0.25 wt% and 0.5 wt%. The effect depends on the balance of lubrication and barrier of fillers and cracks generated by them. Finally, in comparison with FG/PU coatings, the FGO/PU coatings exhibited a better tribological property but worse anti-corrosion property owing to the abundant oxygenated groups of GO. They led to stronger interfacial interactions between FGO and the PU matrix, but destroyed the graphene lattice structure to some extent.
1. Introduction
Polyurethane (PU) is one of the most broad and versatile polymers with the typical urethane functional group (–NHCO–O–), which is usually obtained by a reaction between isocyanate and hydroxyl groups in the presence of some suitable additives.1,2 PU is well-known for its outstanding abrasion resistance, corrosion resistance, excellent flexibility, strong adhesion to substrates, possibility of tailoring its properties, and also some other specific properties.3–6 Therefore, it is widely used in manufacturing, daily life, health care, and even the national defense industry. Whereas, conventional PU still has several deficiencies such as unsatisfactory thermal stability, stiffness, tensile strength and barrier properties, which limited its extensive applications.7,8 In addition, friction, wear and corrosion are the major causes for material and energy losses in mechanical processes.9 In order to improve mechanical durability and energy efficiency, PU needs to be modified to enhance its performance, especially the tribological and anti-corrosion comprehensive properties. It is beneficial for PU to meet the requirements of adapting to the harsh environment.In general, polymers in large amount can be simply modified by proper hybridization with other materials for broader industrial application.10 Appearance of nanomaterials provide new ideas and methods for the preparation of high-performance polymer composites, which gain increasing attention and become one of the hot spots in recent years. Nanofillers, such as clay, carbon nanotubes, calcium carbonate, etc., are widely used to improve mechanical, thermal, electrical properties and abrasion resistance of composites.11,12 Particularly, graphene (G) and its derivatives has attracted tremendous attention owing to their better properties than other nanofillers. Appel et al.13 pointed out that the G could provide higher stiffness and strength than conventional carbon nanofillers such as conducting carbon black and carbon nanotube (CNT). Li et al.14 stated that G tended to have higher aspect ratio than nano-clay, which could enhance the barrier properties.
Graphene (G), a single-layered two-dimensional (2D) graphitic carbon material firstly discovered by Konstantin Novoselov and Andre Geim in 2004,15 has unique geometry and novel physical properties.16–23 Graphene oxide (GO), a typical 2-D oxygen-containing graphene derivative, consists of multiple oxygen-containing functional groups (such as hydroxyl and epoxy functional groups on their basal planes and carboxyl groups located at plane edges), which have similar outstanding properties to G and easier to prepare than G.10,24–28 However, graphene nanosheets aggregate easily and disperse difficultly in common organic solvents due to the strong intrinsic van der Waals attraction and p–p stacking. In addition, the absence of a strong bonding between polymer matrix and G poses a substantial obstacle to obtain graphene-based composites with excellent compatibility and efficiently improved properties. In order to solve these two problems, a series of effective and various strategies have been employed to prepare high-performance composites with good dispersion and compatibility of graphene. The most convenient one is chemical modification. When it comes to GO, the presence of considerable amount of reactive group, such as hydroxyl, carboxyl, and epoxy groups facilitates the dissolution of GO in common organic solvents, which makes it disperse more easily than G. In addition, rich functional group also provide reactive sites for chemical modification.6,11
Owning to these unique and remarkable properties, G and GO are investigated widely in various fields as supercapacitors, transparent electrodes, sensors (chemical/biological sensors, pressure/temperature/humidity sensors), catalysis, solar cells, hydrogen storage, drug delivery, rechargeable batteries, liquid crystal devices, and so on.9,29–31 In particular, they are suitably blended with other materials as nanofillers to gain a better functional composites without adding excessive weight or sacrificing their processability.32
Meanwhile, as reported in previous literatures, G and GO are considered to be a excellent and promising building block than other known materials to improve the tribological and anti-corrosion comprehensive properties for the matrix.6,11,12,14,33 On the one hand, G and its derivative has become one of the emerging and promising lubricating materials,9,34 whose tribological behaviours have been widely studied. Lin et al.23,31 investigated the tribological properties of G and GO as lubricant additives, attributing the outstanding lubrication performance to their small size and extremely thin laminated structure. Kandanur et al.35,36 observed suppression of wear in G-reinforced composites and shown that graphene additives were highly effective in imparts excellent wear resistance to matrix which including organic polytetrafluoroethylene and inorganic silicon nitride. Li et al.32,37–39 investigated the tribological properties of GO-reinforced composites with various matrix such as nitrile rubber, polyimide, epoxy and polyethylene matrix, and pointed out that the superiority of the GO owed to their high specific surface area, good GO adhesion/interlocking, oxygenous groups, 2-D planar geometry and the enhanced glass transition temperature. On the other hand, studies in great number have been devoted to the anti-corrosion behaviors of G and GO. Schriver et al.40–42 revealed that although graphene offered effective short-term protection, over long-time scales it promoted corrosion because of its high electrical conductivity. Prabakar et al.43 demonstrated that GO could serve as an effective corrosion inhibiting layer in contrast to graphene coating for the aluminum current collector. In addition, Chang et al.44–48 presented a series of polymer (such as polyaniline, polyimide, epoxy, polymethyl methacrylate)/graphene composites for corrosion protection of steel, which displayed remarkable barrier properties. Shim et al.49 reported that addition of GO in poly(ethylene terephthalate) (PET) improved tensile and gas barrier properties of the PET/GO composite.
To the best of our knowledge, few studies focused on the tribological and anti-corrosion comprehensive behaviours of composite, and the different functions served by G and GO as building block were never referred to. In this work, functionalized graphene (FG) and functionalized graphene oxide (FGO) was obtained by treating G and GO with 3-aminopropyltriethoxysilane (APTES). Then, we fabricated a series of PU-based composite coatings reinforced with various content of FG and FGO. Structural properties were characterized by Fourier transform infrared spectroscopy (FT-IR), X-ray photoelectron spectrometer (XPS), Raman spectroscopy, X-ray diffraction (XRD). Moreover, morphological properties were observed with the help of atomic force microscopy (AFM), transmission electron microscopy (TEM) and scanning electron microscopy (SEM). Furthermore, tribological and anti-corrosion behaviours were investigated by UMT-3 tribometer, surface profiler, and electrochemical workstation. Finally, tribological and anti-corrosion mechanisms of PU composite coatings were analyzed based on the experimental results.
2. Experimental
2.1 Materials
Hydroxyl acrylic resin (HAR: hydroxyl value = 58 mg KOH per g) was purchased from Innotek TECHNOLOGY Co., Ltd, China, and was diluted by dimethylbenzene (DMB, produced by Aladdin Co., Ltd, China). The curing agent hexamethylene diisocyanate (HMDI: NCO% = 19.6%) were supplied by BAYER Co., Ltd, German. G was obtained from Morsh Co., Ltd, Ningbo, China, and GO was provided by Ningbo Institute of Materials Technology and Engineering, Chinese Academy of Sciences. Ethanol, acetone, and silane coupling agent 3-aminopropyltriethoxysilane (APTES) were purchased from Sinopharm Chemical Reagent Co., Ltd, China. All materials were used as received.2.2 Chemical modification of G and GO
FG was obtained by treating G with APTES to get good dispersion and compatibility. The synthesis process was depicted as follows: first, 2 g of APTES, 7.2 g of alcohol and 0.8 g of distilled water were loaded into the beaker equipped with stirring for 10 min, then 0.1 g of G was added with ultrasonic treatment for 1 h. Afterward, the suspension obtained was introduced into a flask equipped with a magnetic stirring for 6 h at 60 °C. Subsequently, the slurry reaction mixture was centrifuged and washed with ethanol and distilled water to remove residual APTES and achieve neutral. Finally, the FG was freeze-dried and collected. And the FGO can be obtained with similar process.2.3 Preparation of PU composite coatings
A series of FG/PU composite coatings with 0 wt%, 0.25 wt%, 0.5 wt%, 0.75 wt% and 1.0 wt% of FG were prepared as follows: first, specific amount of FG was dispersed in ethanol with ultrasonication for 30 min and then added into 6 g of HAR with stirring to get a uniform mixture. Next, residual ethanol was removed by stoving. Then 2 g of DMB was added to the uniform mixture in order to reduce viscosity. After stirring for 5 min, 1.62 g of HMDI was added to obtain the PU composite. Subsequently, the fabricated mixture was fully mixed with glass rod for 10 min, and air bubbles were removed under vacuum at room temperature for 10 min. Finally, the mixture was coated on the surface of pretreatmented substrates (white cast iron) by a wire bar coater with 25 μm and 200 μm. The coatings with 25 μm were used for anti-corrosion test, while the coatings with 200 μm were used for tribology test. The PU composite coatings were cured for 3 hours at 70 °C. FGO/PU composite coatings with different mass fractions of FGO were prepared in the same way. The fabrication of FGO/PU composite coatings are illustrated schematically in Fig. 1. | ||
| Fig. 1 Schematic illustration of the fabrication of FGO/PU composite coatings. | ||
2.4 Characterization
The change of functional groups before and after chemical modification was tested by FTIR (Nicolet 6700, Thermo Fisher Scientific, USA) with the scanning range of 4000–500 cm−1.The ordered and disordered crystal structures of carbon products were identified by Raman spectroscopy (Renishaw inVia Reflex, Renishaw, UK).
The crystalline structure of carbon products were characterized by XRD (D8 Advance, Bruker AXS, Germany) equipped with Cu Kα radiation. The 2θ scan range was from 5 to 90° and scan rate was 12° min−1.
The elements composition and chemistry state of samples were analyzed by XPS (Axis Ultra Dld, Shimadzu, UK).
The morphological properties of the filler were estimated by AFM (Agilent 5500, Agilent, USA) and TEM (JEM2100, JEOL, Japan).
The morphology of fracture surface of the PU composite coatings was observed by SEM (FEI Quanta FEG 250, FEI, USA) under a vacuum environment. The samples were sputter coated by Au prior.
2.5 Tribological and electrochemical measurements
The coefficient of friction (COF) was characterized by UMT-3 tribometer (UMT-3, Bruker-Cetr, USA) with a reciprocating ball-on-plate mode at room temperature. And the test conditions were listed as follows: load of 3 N, frequency of 1 Hz, the time for 20 min and wear track length of 5 mm. Besides, GCr15 steel balls with a diameter of 3 mm were used as the stationary upper counterparts. Tribological tests were performed under dry sliding and seawater lubrication.The wear tracks of the coatings was examined by using surface profiler (Alpha-Step IQ, KLA-Tencor, USA). The wear resistance of the coatings was represented by wear track cross-sectional area on account of the uniform wear track length. Then wear rate can be calculated according to the following equation:50
| W = V/(F × L) | (1) |
The morphology of wear track was observed by SEM (EVO18, Zeiss, Germany) under a vacuum environment.
The anti-corrosion properties were characterized using an electrochemical workstation (Modulab, Solartron, USA). Bare cast iron electrode was measured immediately after immersion in 3.5 wt% NaCl solution, and the coated electrodes were measured after 24 h of immersion in the solution. A three electrode system was used: the samples were used as the working electrode with a platinum wire counter electrode and a saturated calomel reference electrode. The electrolyte was 3.5 wt% NaCl solution and the used cell was polytetrafluoroethylene with a test area of 0.2 cm2. Potentiodynamic measurement of polarization curves was carried out within the potential range from −0.5 to 1 V vs. reference, with a scan rate of 5 mV s−1. Some important parameters including current density (Icorr), corrosion potential (Ecorr) were derived from the polarization curves in a Tafel model. The electrochemical impedance spectroscopic (EIS) measurements were conducted relative to the open circuit potential (OCP) applying the 10−2 to 105 Hz frequency range and 10 mV excitation amplitude. Equivalent circuits were used to analyze the EIS plots by ZSimp-Win software.
3. Results and discussion
3.1 Structural properties
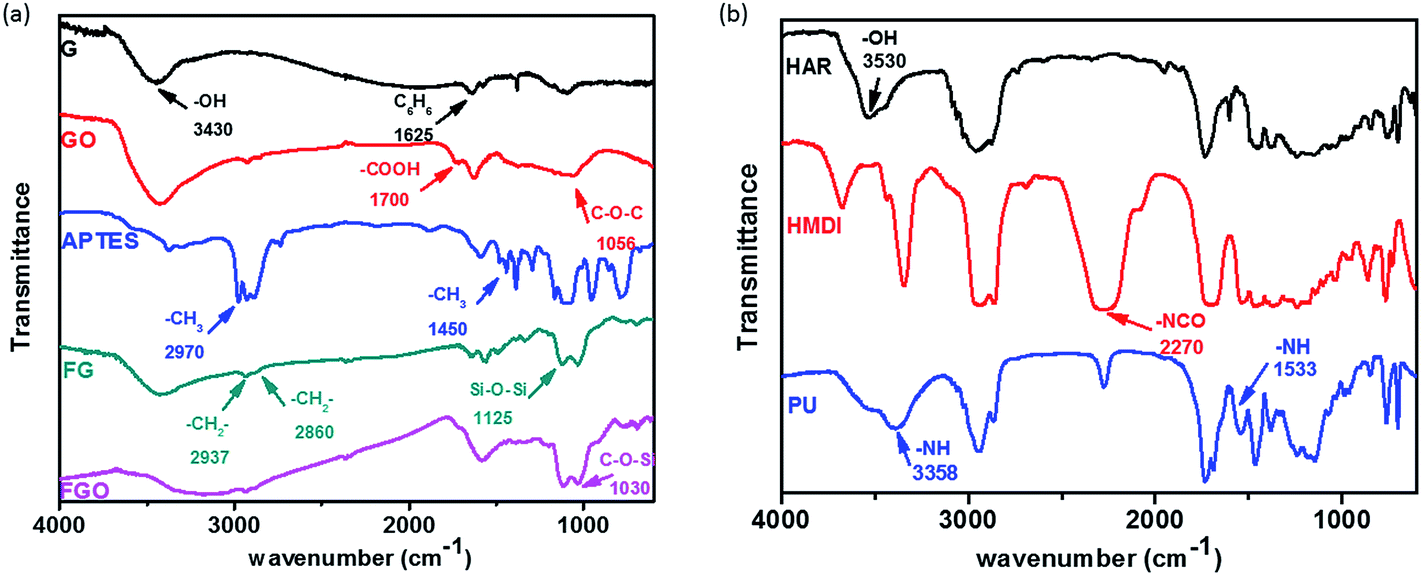
IR analysis was employed to investigate the reaction between G (or GO) and APTES in the process of chemical modification, and show the condensation reaction between OH functional group of HAR and NCO functional group of HMDI during the preparation process of PU coatings. IR spectra of G, GO, APTES, FG and FGO in the range of 500–4000 cm−1 are shown in Fig. 2(a). The characteristic absorption band of G at 3430 and 1625 cm−1 is ascribed to OH characteristic functional group and stretching vibration of benzene ring structure, respectively. Compared with G, GO shows the additional groups including carboxyl group and C–O–C in epoxide group at 1700 and 1056 cm−1.21 From the spectrum of APTES, the adsorption peak at 2970 and 1450 cm−1 is corresponding to –CH3 group. Meanwhile, the doublet at 2937 and 2860 cm−1 is due to symmetric and asymmetric vibrations of the –CH2– group.26 Moreover, the absorption peaks at 1125 and 1030 cm−1 are from absorption peak of Si–O–Si and C–O–Si group, respectively.10 When it comes to FG and FGO, –CH2–, Si–O–Si and C–O–Si group are observed, but –CH3 peaks are not. The absence of –CH3 peaks and the presence of –CH2, Si–O–Si and C–O–Si peaks in FG and FGO reveal that APTES is successfully attached to the G and GO. IR spectra of HAR, HMDI and PU are shown in Fig. 2(b). The absorption peaks due to OH characteristic functional group of HAR are observed at 3530 cm−1.3,51 The absorption peaks due to the N![[double bond, length as m-dash]](https://www.rsc.org/images/entities/char_e001.gif) CO group of HMDI appear as intense and sharp bands at 2270 cm−1. In addition, PU shows characteristic absorptions between 1720–1725 cm−1 due to CO stretching of urethane groups.52 And the N–H group displays a characteristic absorption band at 3358 cm−1 and 1533 cm−1.1 The presence of CO and N–H peaks and the absence of OH peak in PU reveal that the condensation reaction has been completed.
CO group of HMDI appear as intense and sharp bands at 2270 cm−1. In addition, PU shows characteristic absorptions between 1720–1725 cm−1 due to CO stretching of urethane groups.52 And the N–H group displays a characteristic absorption band at 3358 cm−1 and 1533 cm−1.1 The presence of CO and N–H peaks and the absence of OH peak in PU reveal that the condensation reaction has been completed.
 | ||
| Fig. 2 IR spectra of G, GO, APTES, FG, FGO (a) and HAR, HMDI, PU (b). | ||
Raman spectra provided further evidence of the successful preparation of FG and FGO, as shown in Fig. 3. All of the samples display two typical peaks at 1580 and 1350 cm−1, which are corresponding to G band and D band respectively. One side, G band is attributed the bond stretching of all atom pairs in both rings and chains of the graphitic lattice (E2g vibrational mode). For another, D band refers to symmetry breakdown at the edge of graphene sheets, which indicates the defects in the graphitic domain.11,30 In addition, the intensity ratio of D and G (ID/IG) is considered as a unique characteristic tool to measure the density of defects and probe the degree of graphitization.53 The ID/IG values were 0.090, 1.429, 0.207, 1.106 corresponding to G, GO, FG and FGO respectively, which was calculated according to the Fig. 3. Obviously, the ID/IG value of FG was far higher than that of G, attributing to the chemical modification by APTES. While the ID/IG value of FGO showed a opposite variation trend, which indicated that removal of the oxygenated groups was more than attachment of APTES.
 | ||
| Fig. 3 Raman spectra of G, GO, FG and FGO. | ||
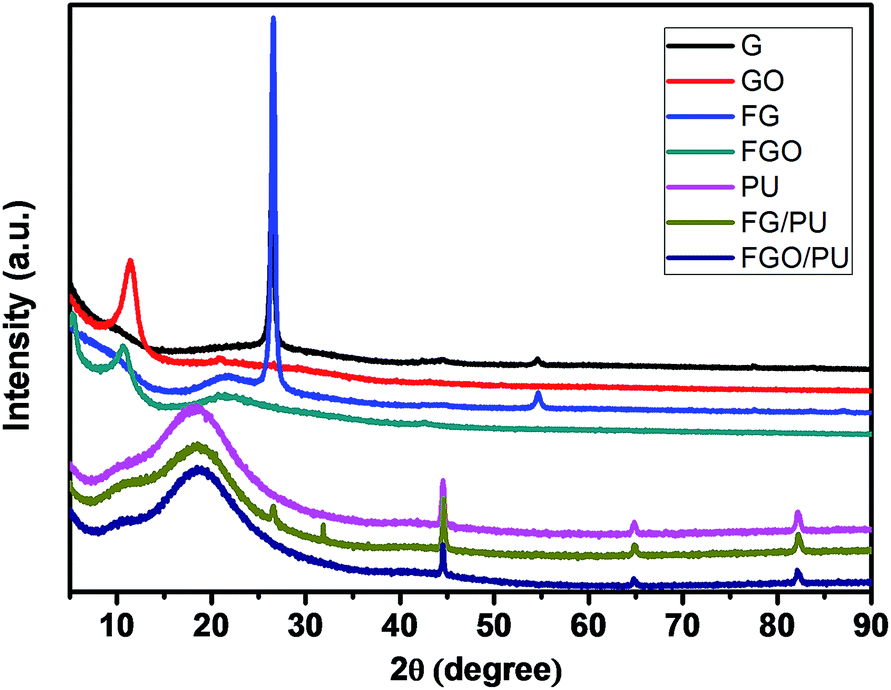
XRD analysis was performed to illustrate the structures of G, GO, FG, FGO, PU, FG/PU and FGO/PU. According to the Bragg's equation, the 2θ value of the peak is inversely proportional to the layer-to-layer distance of nanosheets.27 As shown in Fig. 4, comparing FGO with GO, the diffraction peak shifted to the left due to enlarged d-spacing during the chemical modification.21,54 While a strong sharp peak of both G and FG was observed near 2θ = 27°, which indicated that they are highly crystalline. Compared with the different peak location of GO and FGO, the similar XRD patterns of G and FG also reveal that the modification degree of G is lower than that of GO due to lack of oxygenated groups. For the pure PU, a broad peak appeared at near 2θ = 18° owing to the amorphous feature of cross-linking in PU matrix.32 FG characteristic peak was observed in the XRD pattern of FG/PU, while the XRD pattern of FGO/PU was similar to that of pure PU in spite of the addition content of FGO. These results imply the long-range disorder of FGO due to good exfoliation and uniform dispersion of FGO instead of aggregation in PU matrix.6,12
 | ||
| Fig. 4 XRD patterns of G, GO, FG, FGO, PU, FG/PU and FGO/PU. | ||
FTIR, Raman and XRD results were further confirmed by XPS analysis in Fig. S1,† which was employed to characterize the elements composition and chemistry state of samples. The C 1s peak of G shown in Fig. S1(a)† can be resolved into three components, attributing to the functional groups of C–C, graphite, and C–O with binding energies of 284.7, 285.0 and 286.7 eV respectively. While GO in Fig. S1(b)† showed three different C 1s peaks at 284.7, 286.7, and 288.9 eV, corresponding to the functional groups of C–C, C–O and O–CO. Besides, the peak area of oxygenated groups in GO was far more than that in G, which indicated the abundant oxygenated groups at the plane and edge of GO.6,10,39 Fig. S1(c)† showed the C 1s XPS spectra of PU where the four different peaks at 284.7, 285.4, 286.7 and 288.9 eV, illustrating the presence of C–C, C–N, C–O and O–CO and the successful reaction between HAR and HMDI. In addition, Fig. S1(d)† is full XPS spectrum of G, GO, FG, FGO, PU, FG/PU and FGO/PU, indicating peaks at 533, 400, 285 and 102 eV due to O 1s, N 1s, C 1s and Si 2p, respectively. As can be seen from Fig. S1(e),† the single peak at 102 eV corresponding to the functional group of Si–O–C, can be observed in Si 2p spectrum of FG, FGO, FG/PU and FGO/PU instead of G, GO and PU. The results demonstrate the successful chemical modification of G and GO by APTES.21,26
3.2 Morphological properties
AFM observations shown in Fig. S2† were conducted to measure the thickness of G, GO, FG and FGO (dispersed in ethanol). It can be seen from the cross-section analysis that the thickness of G and FG was about 5 nm, which was thicker than that of the GO (3 nm). The reason is that GO is very hydrophilic, leading to its good solubility and dispersion in ethanol.55 As demonstrated in previous research, the thickness of completely exfoliated single-layer G and GO was less than 1 nm.21,37,39 In consequence, the nanosheets obtained are all multilayer. Moreover, the distribution of G (Fig. S2(a)†) and GO (Fig. S2(b)†) was relatively concentrated, in comparison with that of FG (Fig. S2(c)†) and FGO (Fig. S2(d)†). The results suggest that stacking and agglomeration dramatically reduce after chemical modification, which is ascribed to the attachment of functionalized APTES chains on the plane and edge of G and GO.6,26TEM was performed to further confirm the exact structures of G, GO, FG, FGO dispersing in the ethanol and PU, FG/PU, FGO/PU. As shown in Fig. 5(a1), G displayed a typically flat yet folded nanosheet shape. While GO (Fig. 5(b1)) exhibited a typically transparent sheet morphology with slight corrugation and scrolling due to its abundant oxygenated groups.5,12,37,38 The thickness of G (Fig. 5(a2)) and GO (Fig. 5(b2)) was around 5 and 3 nm respectively, which was consistent with the AFM results. In addition, from the TEM images shown in Fig. 5(c and d), in some places appeared to be the dark contrast frequently and the thickness of FG and FGO could not be observed obviously. The distinct phenomenon is could be the result of functionalized APTES chains grafted on the surface of FG and FGO.26,30 In Fig. 5(e), pure PU presented uniform without any addition of fillers. It can be clearly observed in Fig. 5(f) that FG nanosheet was evenly dispersed in the PU matrix at low concentration of 0.5 wt% of FG.26 When the concentration of FG further increased, the agglomeration of FG can be observed in Fig. 5(g) that dark area represented FG and bright area represented the PU matrix.14,45 It is worth noting from Fig. 5(h) that FGO was dispersed homogeneously in the PU matrix at the same concentration of 0.75 wt% of FGO. It was due to the attachment of abundant functional groups onto GO surface, which could effectivity enhance compatibility between FGO and PU matrix.46
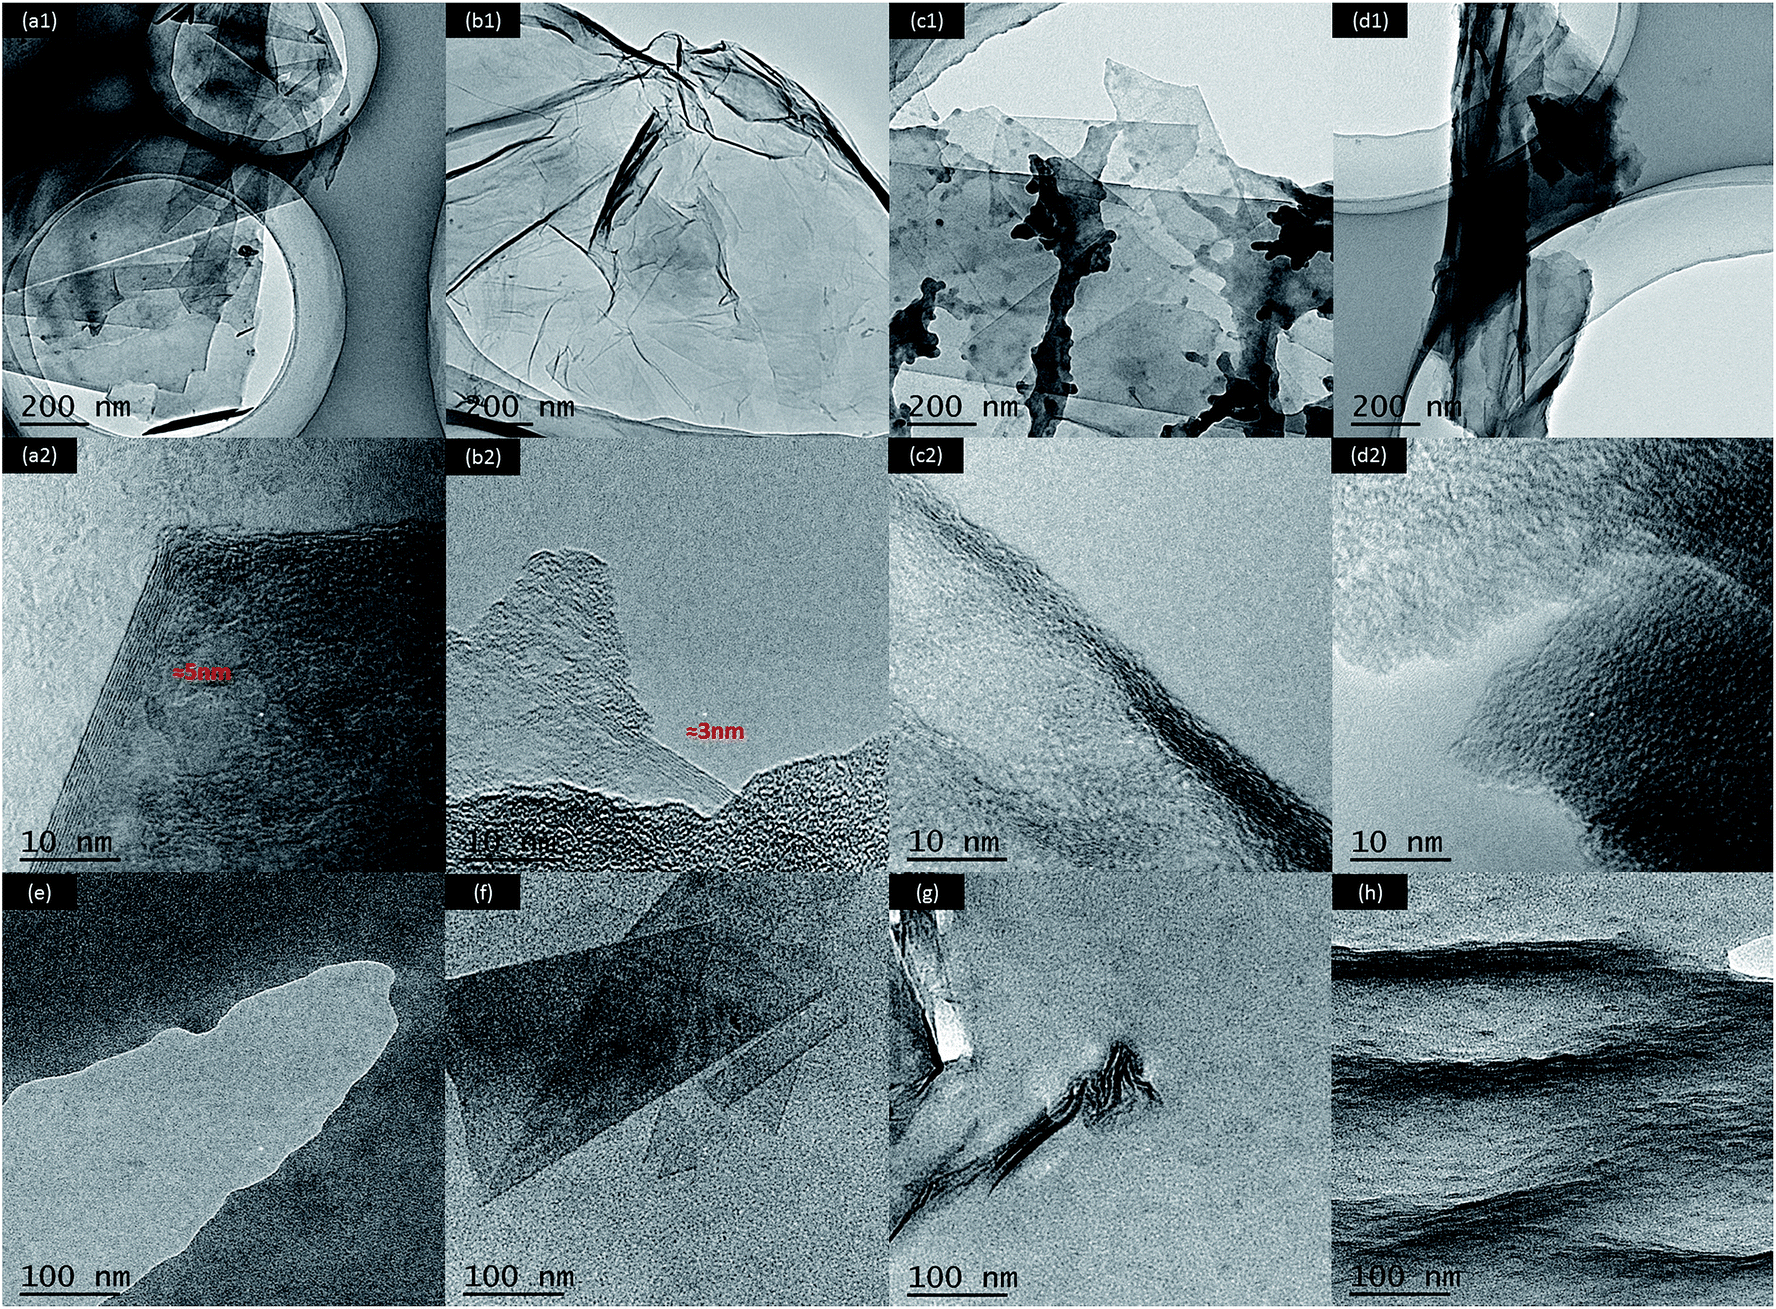 | ||
| Fig. 5 TEM images of G (a), GO (b), FG (c), FGO (d) at different magnifications and pure PU (a), 0.5 wt% FG/PU (c), 0.75 wt% FG/PU (d) and 0.75% FGO/PU (f). | ||
SEM was performed to observe the fracture surface of the PU composite coatings. Fig. 6 showed that the morphology of fracture surface of the PU composite coatings was identical all over the whole fracture surface, indicating good dispersion and compatibility of FG and FGO in the PU matrix.32,45 Pure PU presented in Fig. 6(a) exhibited a smooth and uniform fracture surface without obvious defects. As shown in Fig. 6(b), when a small amount of FG was added into the PU matrix, rougher surfaces appeared and some cracks initiated. Moreover, the cracks propagated and expanded rapidly with the increasing concentration of FG, resulting in a growing number of cracks across the fracture surface of the coatings in Fig. 6(c–e).14 In addition, it could be found from Fig. 6(d and f) that the cracks generated by FGO were less and shorter than those generated by FGO with the same additive amount, which was ascribed to stronger interfacial interaction between FGO and PU matrix.39 Finally, it could not be neglected that the cracks generated by FG and FGO were closely related with the dispersion of them in the matrix.
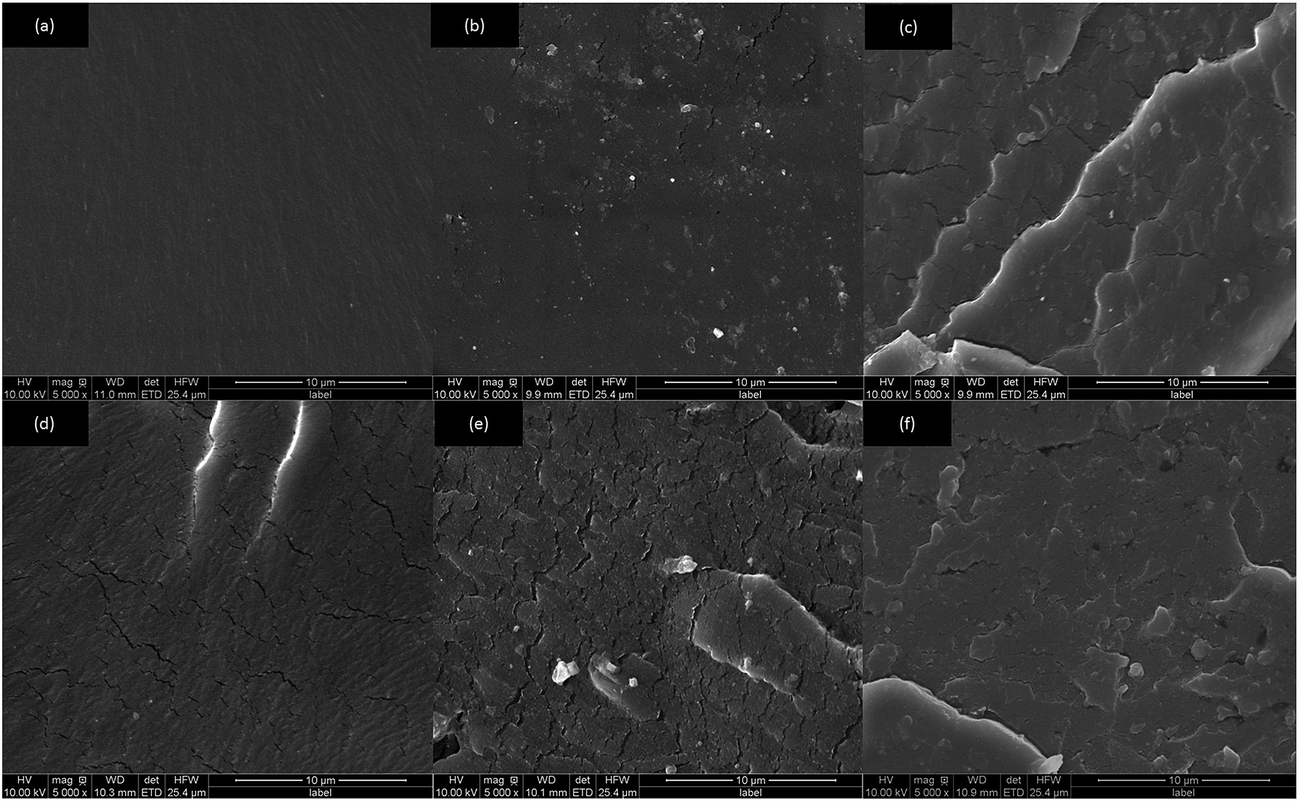 | ||
| Fig. 6 The cross-section topographies of pure PU (a) and PU composite coatings with 0.25 wt% FG (b), 0.5 wt% FG (c), 0.75 wt% FG (d) 1.0 wt% FG (e) and 0.75% FGO (f). | ||
3.3 Tribological properties
In order to optimize the FG and FGO concentration for the best tribological performance and compare the different functions served by them as building block, different doses of them (0 to 1.0 wt%) dispersed in PU matrix were evaluated in terms of COF and wear rate.30 Fig. 7 showed the COF of the PU composite coatings reinforced by different concentration of FG and FGO under dry sliding and seawater lubrication, respectively. The COF first increased rapidly and then reached to be stable as the time goes on.56 It could be observed that the COF of PU composites decreased slightly with the addition of the FG and FGO, especially under seawater lubrication. Moreover, the COF of PU coatings reached the lowest value and rate of increasing when the FG content was 0.25 wt%. When it came to FGO, its optimum additive concentration was 0.5 wt%. It was also worth mentioning that when the content of FG and FGO was further increased, the COF of PU coatings seemed to be increasing, instead of continuing to decrease.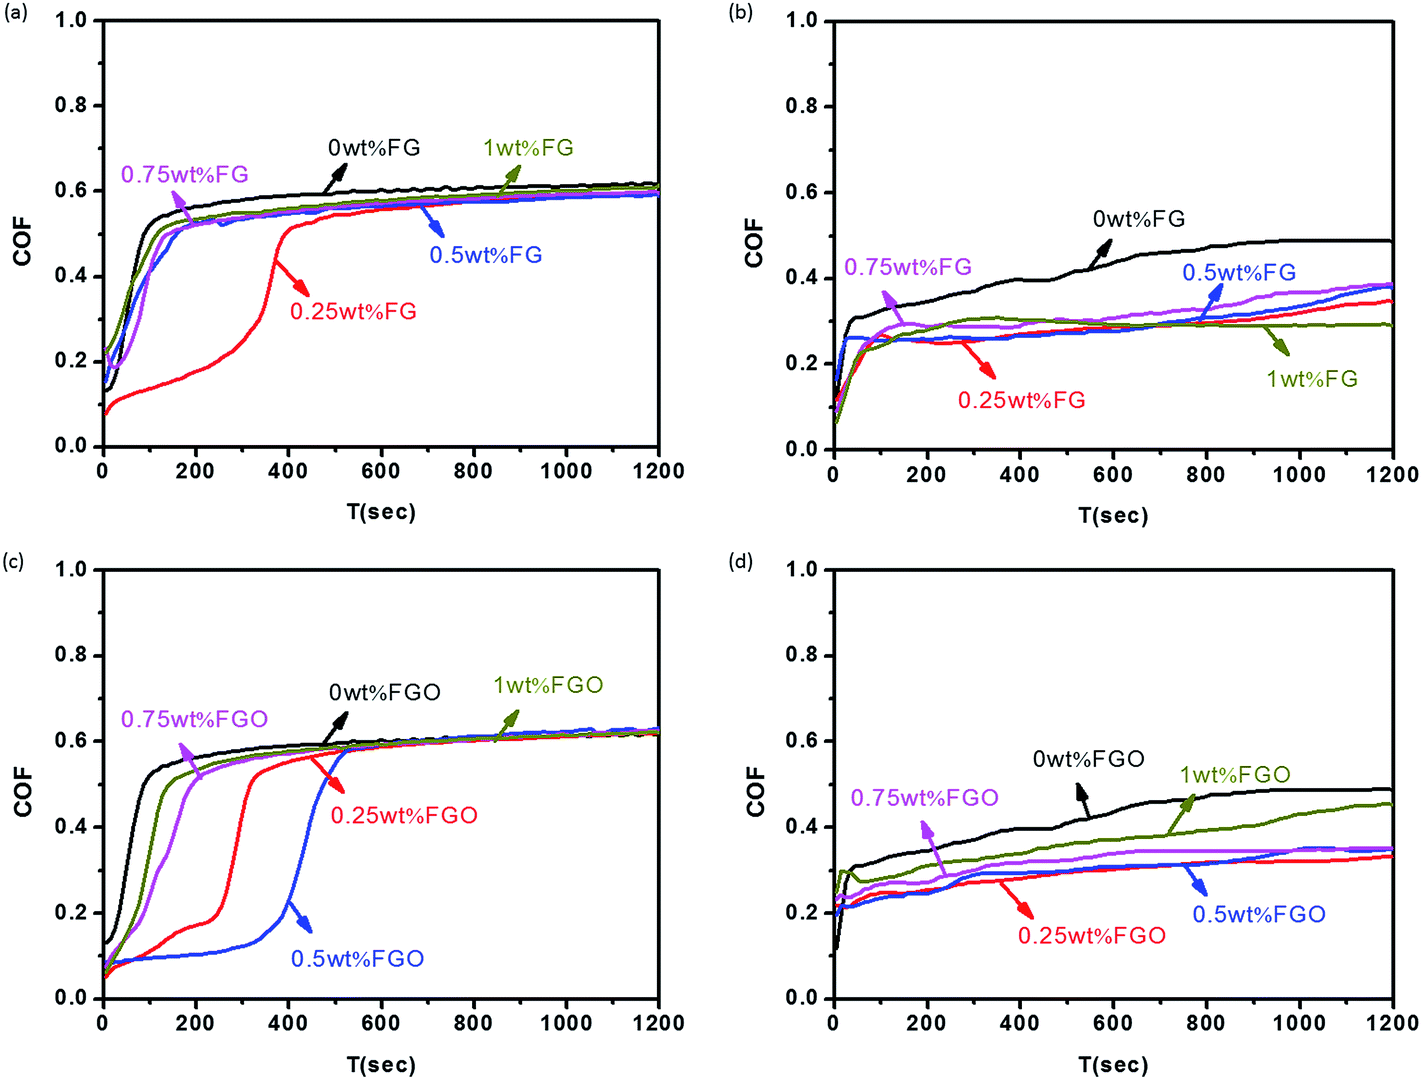 | ||
| Fig. 7 COF of the FG/PU coatings under dry sliding (a) and seawater lubrication (b), COF of the FGO/PU coatings under dry sliding (c) and seawater lubrication (d). | ||
Presented in Fig. 8 was the wear rate of the PU composite coatings as a function of FG and FGO content under dry sliding and seawater lubrication. It was obviously that with the increasing concentration of FG and FGO, the wear rate of PU coatings decreased firstly, and then increased. In addition, the optimum additive concentration of FG and FGO corresponding to the lowest value of wear rate were 0.25 wt% and 0.5 wt% respectively, which was consistent with the COF results.
 | ||
| Fig. 8 Wear rate of the FG/PU coatings (a) and FGO/PU (b) coatings under dry sliding and seawater lubrication. | ||
The reason why the COF and wear rate show the change trend presented above is attributed to balancing the reinforcement and lubrication of fillers and cracks generated by them. On the one hand, the stress is transferred by FG and FGO as building block, which can absorb a great deal of energy during the course of friction. Significantly, loosely bound layers of FG and FGO intrinsically possess low shear strength, lubricating the contact of friction pair surface.36–39 On the other hand, the growing number of cracks across the fracture surface of the coatings (shown in Fig. 6) accelerate the peeling of the coatings. As discussed previous (Fig. 6(d and f)), the cracks generated by FGO were less and shorter than those generated by FGO, leading to the result that the wear rate of FGO/PU coatings was generally lower than that of FGO/PU coatings. Consequently, proper additive amount and good dispersion of FG and FGO are needed to get the best tribological performance of PU composite coatings.
In addition, it could not be ignored that the COF and wear rate under seawater lubrication were far lower than those under dry sliding condition. There are three main factors. Firstly, the frictional heat during the sliding is dissipated by seawater, which is beneficial to hinder the plastic deformation and chemical degradation. Secondly, boundary lubricating provided by adsorbed water molecules avoids direct contact between steel ball and PU coatings, which decreases adherence wear to a great degree. Thirdly, the wear debris can be removed by water continuously, leading to smooth surfaces. In consequence, the presence of water molecules is of great importance for the COF and wear rate.32,57–62
Fig. S3 and S4† showed the wear trace of the friction pairs of FG/PU and FGO/PU composite coatings with different concentration under dry sliding and seawater lubrication at different magnifications. It could be obviously seen that compared with the severe worn surface under dry sliding condition, the morphology of wear trace under seawater lubrication showed a flat and smooth look. And the wear trace of the friction pairs seemed to be finest and flattest with the optimal additive amount of FG and FGO adding into the PU matrix. All of these were in agreement with the results obtained from the tribological test. To be specific, partial melting could be clearly observed on the edge of ridges under dry sliding. The presence of severe wrinkled with wavy morphology on the worn surface is attributed to thermal effect of friction caused chemical plastic degradation of the friction pair surface.36 On the contrary, under seawater lubrication, the wear trace of the friction pairs became smoother and less wrinkles appeared, indicating that the formation of continuous water film between steel ball and PU coatings were of great importance as a kind of polar lubricant.32,56,63–65
3.4 Anti-corrosion properties
Electrochemical measurements were conducted to evaluate the anti-corrosion properties of PU coatings reinforced with FG and FGO. Tafel polarization curves of bare substrate, pure PU, FG/PU and FGO/PU composite coatings exposed to 3.5 wt% NaCl solution are displayed in Fig. 9(a and b). Some important parameters including current density (Icorr), corrosion potential (Ecorr) and protection efficiency (η) derived from the polarization curves are listed in Table 1.66–68 | ||
| Fig. 9 Tafel polarization curves (a), Bode plots (c) and Nyquist plots (e) of bare substrate, pure PU, FG/PU composite coatings; Tafel polarization curves (b), Bode plots (d) and Nyquist plots (f) of bare substrate, pure PU, FGO/PU composite coatings. | ||
| Samples | Icorr (A cm−2) | Ecorr (V) | η (%) |
|---|---|---|---|
| Substrate | 2.126 × 10⁻⁵ | −1.0043 | |
| Pure PU | 8.539 × 10⁻⁶ | −0.5264 | 59.84 |
| FG/PU (0.25 wt%) | 5.761 × 10⁻⁷ | −0.5879 | 97.29 |
| FG/PU (0.5 wt%) | 2.126 × 10⁻⁷ | −0.6025 | 99.00 |
| FG/PU (0.75 wt%) | 2.779 × 10⁻⁶ | −0.5920 | 86.93 |
| FG/PU (1.0 wt%) | 3.196 × 10⁻⁶ | −0.5457 | 84.97 |
| FGO/PU (0.25 wt%) | 2.873 × 10⁻⁶ | −0.5073 | 86.49 |
| FGO/PU (0.5 wt%) | 1.734 × 10⁻⁶ | −0.5165 | 91.84 |
| FGO/PU (0.75 wt%) | 3.274 × 10⁻⁶ | −0.5186 | 84.60 |
| FGO/PU (1.0 wt%) | 4.117 × 10⁻⁶ | −0.4824 | 80.63 |
The protection η of PU coatings on substrate was calculated from Icorr values according to the following equation:69
 | (2) |
In general, a lower Icorr value represents a lower corrosion dynamic rate. By comparing the value of Icorr and η from different aspects, four important information can be obtained. Firstly, the Icorr of bare substrate was far higher than that of PU-coated substrate, indicating the protective effect from PU coatings. Secondly, the introduction of FG and FGO into PU matrix led to the decreasing of Icorr and the increasing of η. It is attributed to barrier properties provided by FG and FGO, hindering migration of corrosive medium.14,41,44,46–48 Thirdly, after adding an excess of FG and FGO, the value of Icorr and η changed in the opposite direction due to the presence of more and more cracks. Lastly, in comparison with FGO/PU composite coatings, FG/PU composite coatings showed the lower Icorr and the higher η with the same concentration. This implies the barrier effect of FG and FGO note only depending on the tortuosity of the diffusion pathway of corrosive medium, but also up to integrity of the graphene lattice.45 The abundant oxygenated groups of FGO destroy the graphene lattice to a certain degree, while FG owes integrated lattice structure comparatively. From the above we can come to the conclusion that chemical stability of FG and FGO plays an important role in affecting their anti-corrosion performance.
In addition, electrochemical impedance spectroscopy (EIS) as a kind of effective means, was used to evaluate the dielectric properties of a medium.44,46 Fig. 9(c and d) presents the Bode plots of the measured samples. In general, a larger value of impedance modulus at low frequency represents a smaller Icorr. Fitted by the ZSimp-Win software, Nyquist plots of all samples are shown in Fig. 9(e and f) and the value of semicircle diameter is inversely proportional to Icorr. Moreover, to further evaluate the anti-corrosion properties of PU composite, electrochemical model impedance parameters summarized in Tables S1 and S2† were calculated in terms of the equivalent circuits of Fig. 10. The impedance equivalent circuits are consisting of capacitors, resistors, insulators and so on. Among them, Rfilm is on behalf of the resistance of coating. Therefore, the value of impedance modulus at low frequency, semicircle diameter and Rfilm can be applied as indicators of anti-corrosion property.
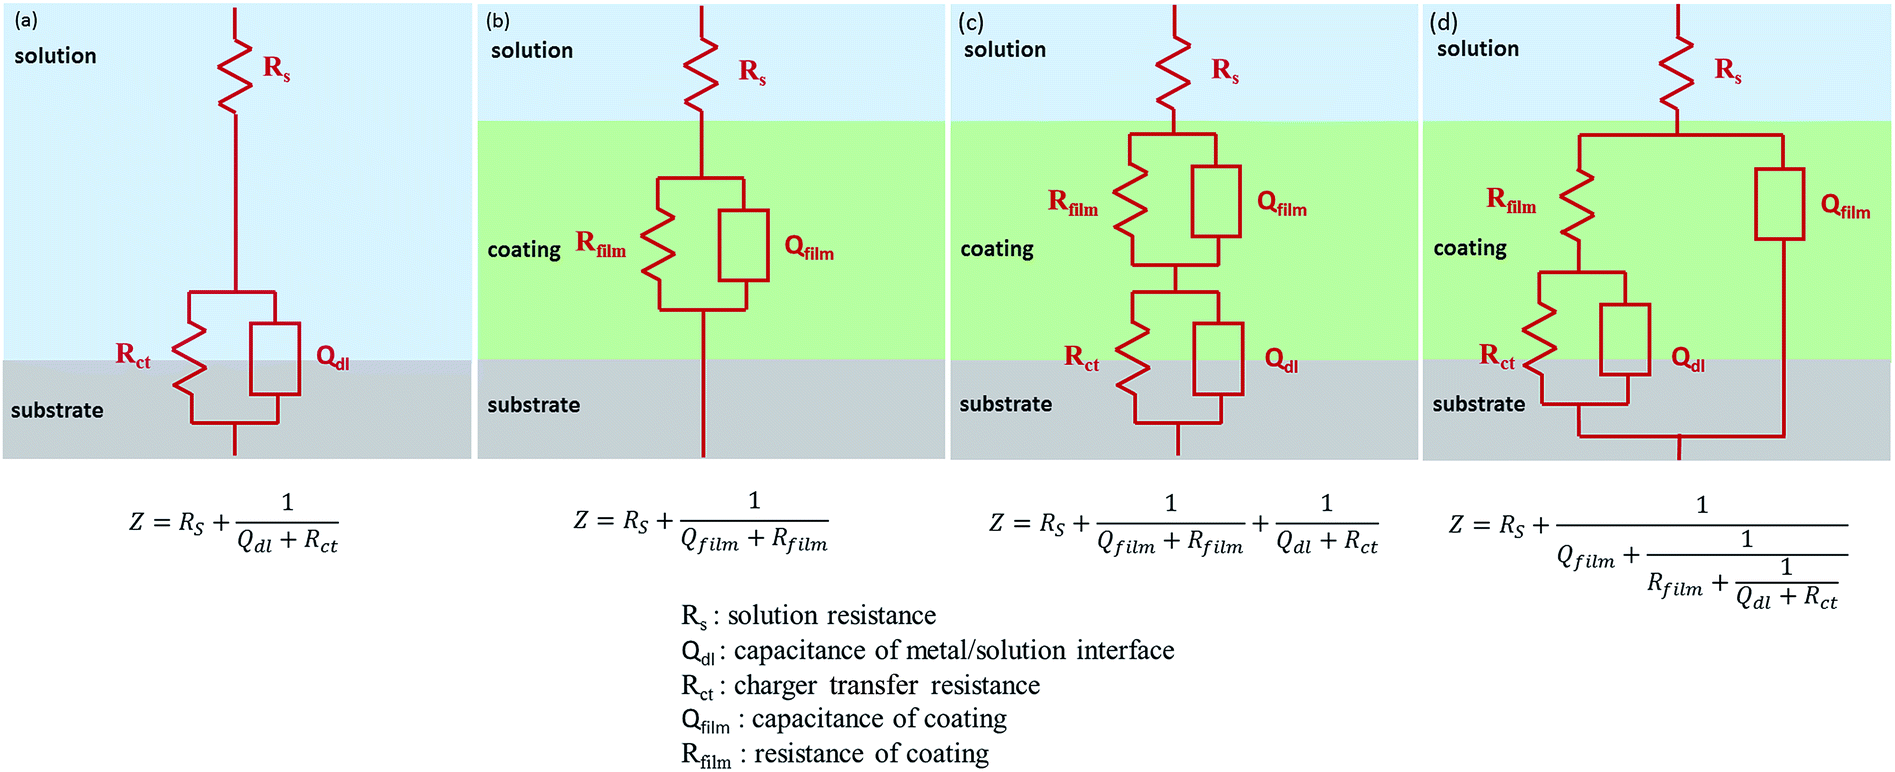 | ||
| Fig. 10 Equivalent circuit for EIS data fitting. | ||
It could be found obviously that all the three value had a sequence of bare substrate < pure PU < FG/PU (0.25 wt%) < FG/PU (0.5 wt%) > FG/PU (0.75 wt%) > FG/PU (1.0 wt%) and the similar order of bare substrate < pure PU < FGO/PU (0.25 wt%) < FGO/PU (0.5 wt%) > FGO/PU (0.75 wt%) > FGO/PU (1.0 wt%). Moreover, with the optimum concentration of FG and FGO, all the three value of FG/PU coatings were more than that of FGO/PU coatings by an order of magnitude. The obtained results were consistent with tendency of polarization curves.
To sum up, FG and FGO as effective building blocks can provide lubrication and barrier properties for PU composite coatings. The effect depends on the balance of lubrication and barrier of fillers and cracks generated by them.44,46–48 According to the above results, the mechanism figure shown in Fig. 11 was drawn to intuitively explain the function of the FG and FGO in PU matrix during tribological and corrosion process. For pure PU, a large amount of debris are produced during tribological process and pathway of corrosive medium is straight. After adding FG and FGO into PU matrix, friction-generated debris become much smaller and less. Meanwhile, the tortuosity of the diffusion pathway increases to a great extent. They are due to the lubrication and barrier of well-dispersed fillers. Consequently, the tribological and anti-corrosion properties of the PU composite coatings are improved substantially.39 However, as the content of FG and FGO is further added, the growing number of cracks plays a dominated role. As a result, the debris will become more and bigger again during tribological process and corrosive medium permeates through the cracks quickly. Most important of all, there are two sides to the abundant oxygenated groups of GO. One hand, they provide more reaction sites for chemical modification, leading to stronger interfacial interaction between FGO and PU matrix. For another, the graphene lattice structure can be destroyed by them to some extent, and the barrier property is influenced accordingly.
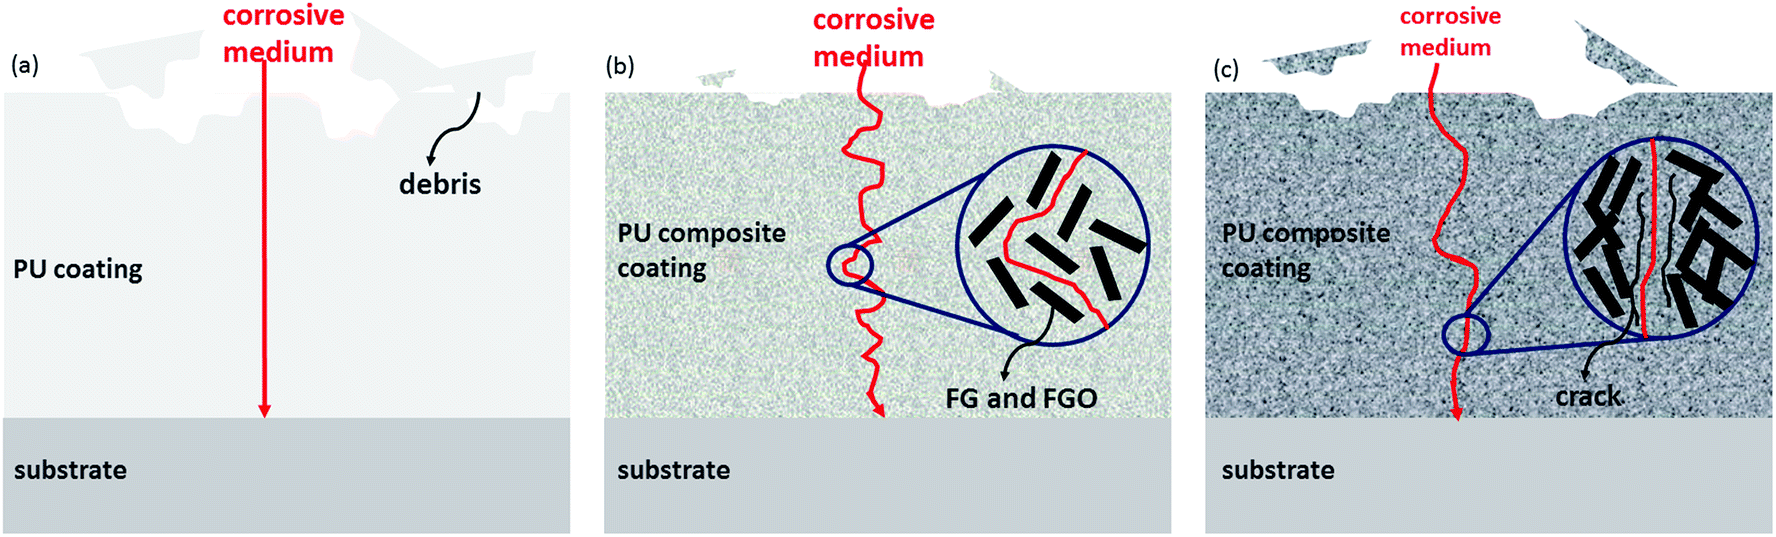 | ||
| Fig. 11 Schematic of pure PU (a), PU composite coatings with appropriate content of FG and FGO (b) and PU composite coatings with excess content of FG and FGO (c) during tribological and corrosion process. | ||
4. Conclusions
From the investigation of tribological and anti-corrosion behaviours of the PU composite coatings, following points can be concluded:(1) After chemical modification by treating G and GO with APTES, the obtained FG and FGO are confirmed to get good dispersion and compatibility in PU matrix.
(2) As effective building blocks, FG and FGO enhanced the tribological and anti-corrosion comprehensive properties of PU composite coatings due to lubrication and barrier properties provided by them. And the optimized additive range were between 0.25% and 0.5%.
(3) The tribological and anti-corrosion performance of PU composite coatings were weaken, as the content of FG and FGO was further added in excess of optimized additive amount. It is attributed to growing number of cracks across the whole PU composite coatings.
(4) In comparison with FG/PU coatings, FGO/PU coatings exhibited better tribological property but worse anti-corrosion property. They are both due to the abundant oxygenated groups of GO, which not only provide more reaction sites for chemical modification to get better dispersion but also destroy the graphene lattice structure against barrier property.
Acknowledgements
The project was supported by the National Natural Science Foundation of China (51202263, 51335010), Ningbo Key Technology Project on Graphene (2013B6013), Zhejiang Province Public Welfare Program (2014C31154) and the Municipal Nature Science Foundation (2014A610132). Thanks for professor Zhaoping Liu and professor Xufeng Zhou providing the raw materials of graphene and graphene oxide.References
- Z. S. Petrović and J. Ferguson, Prog. Polym. Sci., 1991, 16, 695–836 CrossRef.
- M. C. L. de Oliveira, R. A. Antunes and I. Costa, Int. J. Electrochem. Sci., 2013, 8, 4679–4689 Search PubMed.
- S. Dutta and N. Karak, Polym. Int., 2006, 55, 49–56 CrossRef CAS PubMed.
- A. K. Mishra, S. Allauddin, K. R. Radhika, R. Narayan and K. Raju, Polym. Adv. Technol., 2011, 22, 882–890 CrossRef CAS PubMed.
- P. L. Li, H. Ren, F. X. Qiu, J. C. Xu, Z. P. Yu, P. F. Yang, B. B. Xu, Y. Jiang and D. Y. Yang, Polym.-Plast. Technol. Eng., 2014, 53, 1408–1416 CrossRef CAS PubMed.
- B. Yu, X. Wang, W. Y. Xing, H. Y. Yang, L. Song and Y. Hu, Ind. Eng. Chem. Res., 2012, 51, 14629–14636 CrossRef CAS.
- K. Yao, M. Song, D. Hourston and D. Luo, Polymer, 2002, 43, 1017–1020 CrossRef CAS.
- J. N. Gavgani, H. Adelnia and M. M. Gudarzi, J. Mater. Sci., 2014, 49, 243–254 CrossRef CAS.
- V. Eswaraiah, V. Sankaranarayanan and S. Ramaprabhu, ACS Appl. Mater. Interfaces, 2011, 3, 4221–4227 CAS.
- Y. J. Kim and B. K. Kim, Colloid Polym. Sci., 2014, 292, 51–58 CAS.
- J. M. Hu, X. Jia, C. H. Li, Z. Y. Ma, G. X. Zhang, W. B. Sheng, X. L. Zhang and Z. Wei, J. Mater. Sci., 2014, 49, 2943–2951 CrossRef CAS PubMed.
- W. S. Ma, L. Wu, F. Yang and S. F. Wang, J. Mater. Sci., 2014, 49, 562–571 CrossRef CAS.
- A. K. Appel, R. Thomann and R. Mulhaupt, Polymer, 2012, 53, 4931–4939 CrossRef CAS PubMed.
- Y. Li, Z. Z. Yang, H. X. Qiu, Y. G. Dai, Q. B. Zheng, J. Li and J. H. Yang, J. Mater. Chem. A, 2014, 2, 14139–14145 CAS.
- K. S. Novoselov, A. K. Geim, S. Morozov, D. Jiang, Y. Zhang, S. Dubonos, I. Grigorieva and A. Firsov, Science, 2004, 306, 666–669 CrossRef CAS PubMed.
- M. J. Allen, V. C. Tung and R. B. Kaner, Chem. Rev., 2009, 110, 132–145 CrossRef PubMed.
- D. R. Dreyer, R. S. Ruoff and C. W. Bielawski, Angew. Chem., Int. Ed., 2010, 49, 9336–9344 CrossRef CAS PubMed.
- A. K. Geim and K. S. Novoselov, Nat. Mater., 2007, 6, 183–191 CrossRef CAS PubMed.
- K. P. Loh, Q. Bao, P. K. Ang and J. Yang, J. Mater. Chem., 2010, 20, 2277–2289 RSC.
- C. e. N. e. R. Rao, A. e. K. Sood, K. e. S. Subrahmanyam and A. Govindaraj, Angew. Chem., Int. Ed., 2009, 48, 7752–7777 CrossRef CAS PubMed.
- W. S. Ma, L. Wu, D. Q. Zhang and S. F. Wang, Colloid Polym. Sci., 2013, 291, 2765–2773 CAS.
- H. K. He and C. Gao, ACS Appl. Mater. Interfaces, 2010, 2, 3201–3210 CAS.
- H. J. Song and N. Li, Appl. Phys. A: Mater. Sci. Process., 2011, 105, 827–832 CrossRef CAS.
- O. C. Compton and S. T. Nguyen, Small, 2010, 6, 711–723 CrossRef CAS PubMed.
- Y. Zhu, S. Murali, W. Cai, X. Li, J. W. Suk, J. R. Potts and R. S. Ruoff, Adv. Mater., 2010, 22, 3906–3924 CrossRef CAS PubMed.
- X. Wang, W. Y. Xing, L. Song, H. Y. Yang, Y. Hu and G. H. Yeoh, Surf. Coat. Technol., 2012, 206, 4778–4784 CrossRef CAS PubMed.
- Y. T. Dai, F. X. Qiu, J. C. Xu, Z. P. Yu, P. F. Yang, B. B. Xu, Y. Jiang and D. Y. Yang, Plast., Rubber Compos., 2014, 43, 54–62 CrossRef CAS PubMed.
- L. Valentini, S. B. Bon, O. Monticelli and J. M. Kenny, J. Mater. Chem., 2012, 22, 6213–6217 RSC.
- R. M. Hodlur and M. K. Rabinal, Compos. Sci. Technol., 2014, 90, 160–165 CrossRef CAS PubMed.
- S. Choudhary, H. P. Mungse and O. P. Khatri, J. Mater. Chem., 2012, 22, 21032–21039 RSC.
- J. S. Lin, L. W. Wang and G. H. Chen, Tribol. Lett., 2011, 41, 209–215 CrossRef CAS.
- Y. Q. Li, Q. H. Wang, T. M. Wang and G. Q. Pan, J. Mater. Sci., 2012, 47, 730–738 CrossRef CAS PubMed.
- H. J. Song, X. H. Jia, N. Li, X. F. Yang and H. Tang, J. Mater. Chem., 2012, 22, 895–902 RSC.
- D. Berman, A. Erdemir and A. V. Sumant, Carbon, 2013, 59, 167–175 CrossRef CAS PubMed.
- S. S. Kandanur, M. A. Rafiee, F. Yavari, M. Schrameyer, Z.-Z. Yu, T. A. Blanchet and N. Koratkar, Carbon, 2012, 50, 3178–3183 CrossRef CAS PubMed.
- P. Hvizdos, J. Dusza and C. Balazsi, J. Eur. Ceram. Soc., 2013, 33, 2359–2364 CrossRef CAS PubMed.
- H. Liu, Y. Q. Li, T. M. Wang and Q. H. Wang, J. Mater. Sci., 2012, 47, 1867–1874 CrossRef CAS.
- X. J. Shen, X. Q. Pei, S. Y. Fu and K. Friedrich, Polymer, 2013, 54, 1234–1242 CrossRef CAS PubMed.
- Z. X. Tai, Y. F. Chen, Y. F. An, X. B. Yan and Q. J. Xue, Tribol. Lett., 2012, 46, 55–63 CrossRef CAS PubMed.
- M. Schriver, W. Regan, W. J. Gannett, A. M. Zaniewski, M. F. Crommie and A. Zettl, ACS Nano, 2013, 7, 5763–5768 CrossRef CAS PubMed.
- W. Sun, L. D. Wang, T. T. Wu, Y. Q. Pan and G. C. Liu, Carbon, 2014, 79, 605–614 CrossRef CAS PubMed.
- F. Zhou, Z. T. Li, G. J. Shenoy, L. Li and H. T. Liu, ACS Nano, 2013, 7, 6939–6947 CrossRef CAS PubMed.
- S. R. Prabakar, Y.-H. Hwang, E. G. Bae, D. K. Lee and M. Pyo, Carbon, 2013, 52, 128–136 CrossRef PubMed.
- C. H. Chang, T. C. Huang, C. W. Peng, T. C. Yeh, H. I. Lu, W. I. Hung, C. J. Weng, T. I. Yang and J. M. Yeh, Carbon, 2012, 50, 5044–5051 CrossRef CAS PubMed.
- K. C. Chang, C. H. Hsu, H. I. Lu, W. F. Ji, C. H. Chang, W. Y. Li, T. L. Chuang, J. M. Yeh, W. R. Liu and M. H. Tsai, eXPRESS Polym. Lett., 2014, 8, 243–255 CrossRef.
- K. C. Chang, M. H. Hsu, H. I. Lu, M. C. Lai, P. J. Liu, C. H. Hsu, W. F. Ji, T. L. Chuang, Y. Wei, J. M. Yeh and W. R. Liu, Carbon, 2014, 66, 144–153 CrossRef CAS PubMed.
- K. C. Chang, W. F. Ji, M. C. Lai, Y. R. Hsiao, C. H. Hsu, T. L. Chuang, Y. Wei, J. M. Yeh and W. R. Liu, Polym. Chem., 2014, 5, 1049–1056 RSC.
- K. C. Chang, W. F. Ji, C. W. Li, C. H. Chang, Y. Y. Peng, J. M. Yeh and W. R. Liu, eXPRESS Polym. Lett., 2014, 8, 908–919 CrossRef CAS.
- S. H. Shim, K. T. Kim, J. U. Lee and W. H. Jo, ACS Appl. Mater. Interfaces, 2012, 4, 4184–4191 CAS.
- L. Shan, Y. Wang, J. Li, H. Li, X. Wu and J. Chen, Surf. Coat. Technol., 2013, 226, 40–50 CrossRef CAS PubMed.
- A. Kausar, S. Zulfiqar and M. I. Sarwar, Polym. Degrad. Stab., 2013, 98, 368–376 CrossRef CAS PubMed.
- T. L. Wang and F. J. Huang, Polym. Int., 1998, 46, 280–284 CrossRef.
- C. A. Bauer, T. V. Timofeeva, T. B. Settersten, B. D. Patterson, V. H. Liu, B. A. Simmons and M. D. Allendorf, J. Am. Chem. Soc., 2007, 129, 7136–7144 CrossRef CAS PubMed.
- Y. Liu, J. K. Ma, T. Wu, X. R. Wang, G. B. Huang, Y. Liu, H. X. Qiu, Y. Li, W. Wang and J. P. Gao, ACS Appl. Mater. Interfaces, 2013, 5, 10018–10026 CAS.
- Y. Q. Qian, I. M. Ismail and A. Stein, Carbon, 2014, 68, 221–231 CrossRef CAS PubMed.
- D. X. Li, X. Deng, J. Wang, J. Yang and X. X. Li, Wear, 2010, 269, 262–268 CrossRef CAS PubMed.
- H. J. Song and Z. Z. Zhang, Mater. Sci. Eng., A, 2006, 424, 340–346 CrossRef PubMed.
- H. J. Song, Z. Z. Zhang and X. H. Men, Eur. Polym. J., 2007, 43, 4092–4102 CrossRef CAS PubMed.
- H. J. Song, Z. Z. Zhang and X. H. Men, Eur. Polym. J., 2008, 44, 1012–1022 CrossRef CAS PubMed.
- H. H. Song, Z. Z. Zhang and X. H. Men, Composites, Part A, 2008, 39, 188–194 CrossRef PubMed.
- H. J. Song, Z. Z. Zhang, X. H. Men and Z. Z. Luo, Wear, 2010, 269, 79–85 CrossRef CAS PubMed.
- H. J. Song, H. A. Qi, N. Li and X. Q. Zhang, Micro Nano Lett., 2011, 6, 48–51 CAS.
- T. M. Wang, G. Zhao and Q. H. Wang, Polym. Compos., 2012, 33, 812–818 CrossRef CAS PubMed.
- S. L. Xia, Y. L. Liu, L. Q. Zhang, D. M. Wang, W. J. Zou, J. Peng and S. K. Cao, J. Appl. Polym. Sci., 2014, 131, 40244 Search PubMed.
- G. Zhao, T. M. Wang and Q. H. Wang, Polym. Compos., 2011, 32, 1726–1733 CrossRef CAS PubMed.
- X. X. Yan and G. Y. Xu, J. Alloys Compd., 2010, 491, 649–653 CrossRef CAS PubMed.
- X. X. Yan and G. Y. Xu, Surf. Coat. Technol., 2010, 204, 1514–1520 CrossRef CAS PubMed.
- X. X. Yan and G. Y. Xu, Prog. Org. Coat., 2012, 73, 232–238 CrossRef CAS PubMed.
- S. Banerjee, A. Mishra, M. M. Singh, B. Maiti, B. Ray and P. Maiti, RSC Adv., 2011, 1, 199–210 RSC.
Footnote |
| † Electronic supplementary information (ESI) available. See DOI: 10.1039/c5ra10494g |
| This journal is © The Royal Society of Chemistry 2015 |