Controllable growth of uniform carbon nanotubes/carbon nanofibers on the surface of carbon fibers†
Wenxin Fan*ab,
Yanxiang Wang*ab,
Jiqiang Chenb,
Yan Yuanb,
Aiguo Lib,
Qifen Wangc and
Chengguo Wang*b
aKey Laboratory for Liquid-Solid Structural Evolution and Processing of Materials (Ministry of Education), Shandong University, Jinan 250061, China. E-mail: fanwenxin416@126.com; wyx079@sdu.edu.cn; Tel: +86 18706415980/+86 13854165206
bCarbon Fiber Engineering Research Center, Faculty of Materials Science, Shandong University, Jinan 250061, China. E-mail: wangchg@sdu.edu.cn; Tel: +86 13708937035
cCNGC Institute 53, Jinan 250031, China
First published on 1st September 2015
Abstract
An efficient method to obtain a good and uniform catalyst coating on the surface of carbon fibers was developed by modifying carbon fibers with electrochemical anodic oxidation (EAO), the homogeneous growth of carbon nanotubes (CNTs)/carbon nanofibers (CNFs) was then achieved on the surface of carbon fibers via chemical vapor deposition (CVD). According to the study on the effect of both the catalyst type and concentration on CNT/CNF growth, it was found that when the concentration of catalyst precursor is higher than a critical value, catalytic efficiency decreases apparently with the increase of catalyst concentration regardless of the catalyst type employed. The influence of CVD temperature on tensile strength of CNT/CNF-grafted carbon fibers was also investigated. At low temperatures, such as 500 °C and 550 °C, growing CNTs/CNFs without any degradation of mechanical properties of carbon fibers was successfully achieved, which demonstrated the feasibility of growing CNTs/CNFs directly on carbon fibers. A mathematical model for CNT growth was established to explain the experimental results successfully, which can be used to accurately control the morphology and yield of CNTs/CNFs grown on the surface of carbon fibers. Hence it provides theoretical guidance for the large-scale synthesis processes.
1. Introduction
The synthesis of carbon nanotubes (CNTs) directly on the surface of carbon fibers can not only dramatically improve the mechanical performance of carbon fiber composites by enhancing interfacial cohesive force between CF and the matrix,1,2 but also introduce extraordinary properties of CNTs into carbon fiber composites for the improvement of properties such as electrical and thermal properties.3,4 As a kind of new multiscale-hybrid reinforcement, CNT-grafted carbon fiber has been successfully produced by many researchers,5–12 CNT-grafted carbon fiber/resin composites with the pronounced improvement of mechanical properties have also been fabricated or confirmed in many reports.9–13 For instance, Agnihotri et al.14 successfully synthesized CNTs on the surface of carbon fibers by using CVD at 550 °C.The variations of the morphology and yield of CNTs grown on carbon fibers with the CVD process parameters, such as the CVD temperature and time,14–16 catalyst type and amount,16–18 and the components and concentration of carbon source gases,18,19 have been studied by many researchers under their own CVD systems, but they lacked a unified theory or mathematic model for the growth of CNTs on the surface of carbon fibers to reasonably explain all the experimental results and to accurately control the morphology and yield of CNTs. It is needed to establish a mathematic model for the growth of CNTs on the surface of carbon fibers to guide practical production.
When CNT growth is carried out via CVD, it is the critical step to obtain a good and uniform catalyst coating, which is essential for the uniform growth of CNTs on the surface of carbon fibers. Various technologies have been reported for the coating of catalyst on carbon fiber surface, such as sputtering method,20,21 electroless deposition,14 electro-deposition technique,22,23 e-beam evaporation3 and solution impregnation.18,19,24–26 Among these methods, solution impregnation is the best method because of its straightforward operation without device constraints and its technical suitability. However, the poor wettability of carbon fiber with salts can result in the difficulty for a good dispersion of metal catalyst, directly leading to the inhomogeneous distribution of CNTs on the surface of carbon fiber. Therefore, surface modification is strongly required to activate the surface of carbon fibers. Compared with the utilized liquid-phase oxidation by all the previous studies,16,19,25,26 electrochemical anodic oxidation (EAO) can accomplish the uniform surface modification of every single fiber with much less degradation of carbon fiber's mechanical properties,27,28 in addition, EAO is suitable for surface modification of carbon fibers in an industrial scale.
In this article, the high-efficiency preparation of uniform catalyst coating on the surface of carbon fibers was carried out by modifying carbon fibers with EAO, the uniform CNTs/CNFs were then obtained on the surface of carbon fibers by CVD method at low temperatures which is critical to produce CNT/CNF-grafted carbon fibers with high mechanical properties.29–31 The influences of the process parameters including the catalyst type, the catalyst concentration and CVD temperature on the morphology and catalytic efficiency of catalysts, the morphology and yield of CNTs/CNFs have been systematically studied. Using our technological process, it is easy and reproducible to produce CNT/CNF-grafted carbon fibers without any degradation of the mechanical properties at low temperatures, such as 500 °C and 550 °C. This represents an important step towards CNT-reinforced carbon fiber composites with higher damage resistance. A mathematic model for CNT/CNF growth was established to express the experimental results. Based on the mathematic model, it can be realized to accurately control the morphology and yield of CNTs/CNFs grown on the surface of carbon fibers by adjusting the process parameters, which provides a theoretical guidance for the large-scale fabrication of CNT/CNF-grafted carbon fibers.
2. Experimental
2.1. Pretreatment of carbon fibers
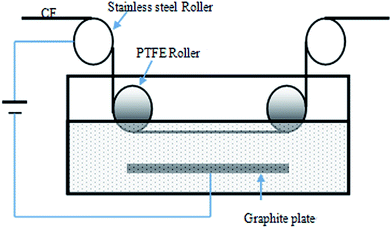
CNT/CNF-grafted carbon fibers were manufactured using the high-strength PAN based carbon fibers (T700-12K, Toray), the sizing agents which were removed by heat treatment of carbon fibers at 450 °C in N2 for 1 h. EAO was used to activate the surface of carbon fibers by creating active functional group such as carbonyl, carboxyl and hydroxyl group.32,33 The schematic diagram of the equipment for EAO is shown in Fig. 1, carbon fibers were firstly passed the stainless steel roller connected to the positive pole of the power supply, then pulled into electrolyte aqueous solution of ammonium di-hydrogen phosphate with content of 5 wt% by a PTFE roller, and last were drawn forth out of electrolyte solution by the other PTFE roller. In this study, the processing time of electrochemical treatment was 80 s and the treatment intensity was 100 C g−1. The carbon fiber samples were cleaned in distilled water for 10 min to remove residual electrolyte on the surface of carbon fiber and dried at 80 °C for an hour in air.The catalyst used for CNT/CNF growth stemmed from metallic salt solution by dissolving Fe(III) nitrate nonahydrate and Ni(II) nitrate hexahydrate in ethanol, respectively. The as-obtained carbon fibers were cut into pieces of 50 cm, then were weighed and impregnated with the catalyst solution with varying concentration ranging from 0.03 to 0.19 mol L−1 for 10 min. Subsequently, the bundles were taken out from the solution and dried in an oven at 80 °C for 30 min and then weighed to determine the amount of catalyst deposited on the surface of carbon fibers.
2.2. Synthesis of CNTs/CNFs on the surface of carbon fibers
The growth of CNTs/CNFs was performed in a low pressure CVD system. The samples were placed in the middle of a vertical graphite barrels reactor. The reactor was heated to 450 °C at 10 °C min−1 in N2, and then was kept at 450 °C for 1 h with N2 replaced by H2 at a flow of 5 L min−1 in order to convert the layer of catalyst precursor into metallic Ni or Fe nano-particles. The temperature of reactor was subsequently raised to the specified temperature varied from 450 to 600 °C at 10 °C min−1 in N2 and CNTs/CNFs were synthesized directly on the surface of carbon fibers by introducing a mixture of C2H2, H2, and N2 for 40 min. The feeding rates of these gases were set to 5, 5, and 10 L min−1 for C2H2, H2, and N2, respectively. At the end of this feeding period, the gas flow was replaced by nitrogen with a flow rate of 5 L min−1 until the reactor was cool to ambient temperature. During the whole CVD processes, the pressure of the reactor was kept at 0.02 MPa. After being taken out of the reactor, the CNT/CNF-grafted carbon fibers were cleaned in the ultrasonic bath with acetone and weighed to get the mass of CNT/CNF-grafted carbon fibers.2.3. Characterization
The morphology of Fe or Ni nano-particles and CNTs/CNFs deposited on the surface of carbon fibers was investigated by a scanning electron microscope (SEM, JEOL, SU-70) operated at 15 kV. Further detailed structure study of CNTs/CNFs was carried out by a high resolution transmission electron microscopes (HRTEM, EOL, JEM-2100) operated at 200 kV.In this study, the mass of CNTs/CNFs synthesized on the nano-particles consisting of 1 mol metal atoms was used to represent catalytic efficiency of metal nano-particles on the surface of carbon fibers and the mass of CNTs/CNFs synthesized on the surface of per gram of carbon fibers represented yield of CNTs/CNFs, which could be described as following relation,
 | (1) |
 | (2) |
To assess the variation of the tensile strength of CNT/CNF-grafted carbon fibers with CVD temperature, the single-fiber tensile test was performed on the basis of the ASTM D3822-07 specification with a gauge length of 20 mm and a crosshead speed of 2 mm min−1 by a XQ-1 tensile tester from Donghua University. At least 30 single fibers were tested for each sample.
3. Results
3.1. Effect of both the catalyst type and concentration on the morphology of catalyst deposited on carbon fibers
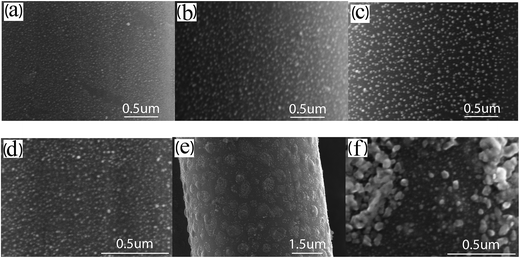
Fig. 2 describes the dependence of the morphology of catalyst nano-particles on both the catalyst type and concentration. After the surface of carbon fibers is modified by utilizing EAO and then coated with the catalyst precursor by dip coating, there is a formation of uniform and fine particles with a narrow size distribution observed on the surface of carbon fibers, which is premise of obtaining uniform and aligned CNTs/CNFs. As the concentration of catalyst precursor increases, the amount of catalyst precursor coating the surface of per gram of carbon fibers enlarges. It is approximately proportional to the concentration of catalyst precursor, as shown in Fig. 3(a). In the case of that Ni(NO3)2 serves as catalyst precursor, it can be observed from Fig. 2(a–c) that as well as a broader size distribution, the mean diameter of metallic nano-particles enlarges with the increase of Ni(NO3)2 concentration, it is approximately proportional to c1/3, as shown in Fig. 3(b).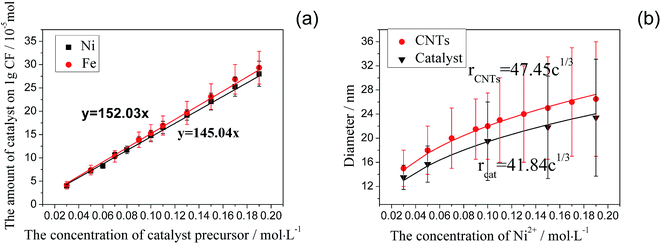 | ||
| Fig. 3 Effect of the concentration of catalyst precursor on (a) the amount of catalyst and (b) the diameters of catalyst particles and CNTs/CNFs. | ||
However, in the case of Fe(NO3)3, the high-density, homogeneously-sized and fine particles can be observed only at low concentrations, such as 0.10 mol L−1 shown in Fig. 2(d). As the concentration is increased to 0.15 mol L−1, the nano-particle clusters were formed due to the aggregation of nano-particles appearing on the surface of carbon fibers, as shown in Fig. 2(e) and (f). Between the adjacent nano-particle clusters, there also exist dense and uniform particles with a smaller particle size on the surface of carbon fibers.
3.2. Dependence of catalytic efficiency of metallic nanoparticles, CNT/CNF morphology and yield on the catalyst type and concentration
Fig. 4 compares the morphology of CNTs/CNFs synthesized at 550 °C on carbon fibers impregnated with different concentration of Ni(NO3)2 ethanol solution for 10 min. There are dense and fine CNTs with a narrow diameter distribution homogeneously grafted on carbon fibers as shown in Fig. 4(a). The mean diameter of CNTs/CNFs in this case is about 15 nm. In agreement with the morphology of catalyst nano-particles, it can be observed from Fig. 3(b) that the mean diameter of CNTs/CNFs depends on the nano-particles size16,34 and is also proportional to c1/3, meanwhile, the diameter distribution of CNTs/CNFs broadens as the concentration of solution increases. In addition, we also find that the increasing of impurity particles (see the white arrows in Fig. 4) and the worsening of homogeneous distribution of CNTs/CNFs obviously occur on the surface of carbon fibers with the increasing of concentration, which can induce stress disturbance at the interface of carbon fiber composites and is unbeneficial for the improvement of the mechanical performance of carbon fiber composites.2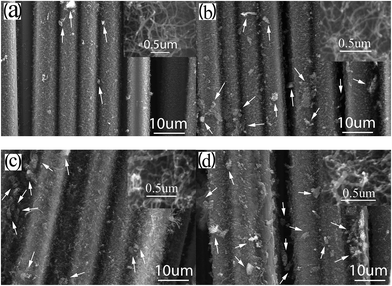 | ||
| Fig. 4 SEM images of CNTs/CNFs grown at 550 °C on carbon fibers impregnated with (a) 0.03, (b) 0.05, (c) 0.10, (d) 0.15 mol L−1 Ni(NO3)2 solution (the inset is the high resolution SEM image). | ||
Fig. 5 shows the influence of the concentration of Fe(NO3)3 solution on the morphology of CNTs/CNFs growing on carbon fibers at 550 °C. Being similar to Ni(NO3)2 solution, the increasing of concentration gives rise to four main variations of the morphology of CNTs/CNFs on the surface of carbon fibers: (1) the enlarging of mean diameter of CNTs/CNFs, (2) the broadening of diameter distribution of CNTs/CNFs, (3) the increasing of impurity particles, and (4) the worsening of homogeneous distribution of CNTs/CNFs. When the concentration of Fe(NO3)3 solution increases to 0.15 mol L−1 or higher, in agreement with the reduction results of catalyst shown in Fig. 2(e) and (f), there is an apparent formation of CNTs/CNFs clusters as shown in Fig. 5(d).
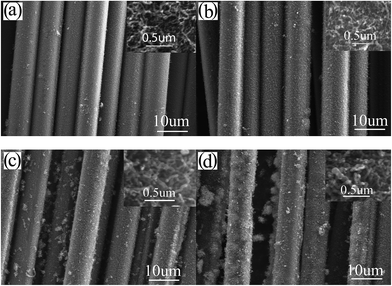 | ||
| Fig. 5 SEM images of CNTs/CNFs grown at 550 °C on carbon fibers impregnated with (a) 0.03, (b) 0.05, (c) 0.10, (d) 0.15 mol L−1 Ni(NO3)2 solution (the inset is the high resolution SEM image). | ||
Fig. 6(a) and (b) show the variation of catalytic efficiency of metal nano-particles and CNTs yield with the concentration of the Ni(NO3)2 and Fe(NO3)3 at 550 °C, respectively. It is found that catalytic efficiency of metal nano-particles, R, decreases apparently with the increase of catalyst concentration regardless of the catalyst type employed, which is related to the enlarged particle size due to the increasing of catalyst concentration, as shown in Fig. 2 and 3(b). It can be attributed to the following reason: the larger metal nano-particles have a smaller specific surface area and so they provide a smaller surface area or less active points for the decomposition of hydrocarbon, and meanwhile have a longer diffusion length which is unbeneficial for the diffusion of carbon atoms. The CNT/CNF yield, Y, increases nonlinearly with the increase of catalyst concentration as shown in Fig. 6. The functional relation between CNTs/CNFs yield and the concentration of catalyst precursor is described below:
| Y = RKc × 10−5 | (3) |
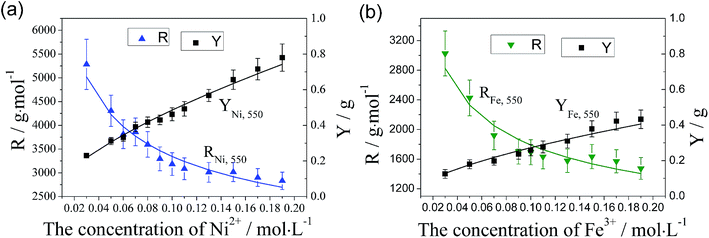 | ||
| Fig. 6 Effect of catalyst concentration of (a) Ni and (b) Fe on catalytic efficiency of catalyst particles and CNT/CNF yield. | ||
Compared Fig. 6(a) and (b), it can be inferred that Ni nano-particles have a much higher catalytic efficiency than Fe nano-particles at 550 °C under the same treatment conditions, which is in accord with the morphology of CNTs/CNFs as respectively shown in Fig. 4 and 5.
Based on the above observation, it is simple and efficient to obtain a good and uniform catalyst coating on the surface of carbon fibers by dip coating method after carbon fibers are modified by using EAO, which can be used to prepare the uniform coating of catalyst on continuous carbon fibers at an industrial scale. Ultimately, it's realized to synthesize the uniform CNTs/CNFs on the surface of carbon fibers when the concentration of catalyst precursor is lower than 1.0 mol L−1, meanwhile, the low concentration of catalyst precursor in solution is also benefit for the preparation of CNT-grafted with higher mechanical properties.35 In agreement with the study by Zhao et al.,17 it has been forcefully proved by our experiments that if the much lower concentration such as 0.01 mol L−1 is utilized, CNTs/CNFs could not be uniformly produced on the entire fiber surface.
4. Discussion
4.1. Mathematic model for CNT/CNF growth on the surface of carbon fiber
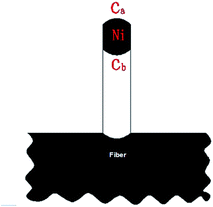
Recently it has been clearly confirmed that catalyst particle size has an important influence on CNT growth. The catalyst particles with large size have been affirmed ineffective.36,37 Actually, there have been several studies showing that the carbon filament growth rate increased with catalyst particle size decreasing,38–40 although it was not systematically explained by a mathematical model developed by considering the detailed surface reactions and the growth mechanism of carbon filaments.According to the observation from Fig. 4 and 5, and S1,† it can be found that the growth of CNTs/CNFs conforms to tip-growth model in this study. Based on the growth of carbon filaments,41 the growth of CNTs/CNFs is generally regarded as a “decomposition–diffusion–deposition” model as shown in Fig. 7. According to the model, the gaseous hydrocarbons first decompose into carbon atoms on the active crystal surface of a catalyst particle, then carbon atoms diffuse through the catalyst bulk, finally they deposit and form CNTs/CNFs at the other side of the catalyst particles. For the CVD system, the growth of CNTs/CNFs can be described as the following three steps:
(i) Decomposition of C2H2:
| C2H2 + 4∗ = 2C∗ + 2H∗ | (4) |
| H2 + 2∗ ⇆ 2H∗ | (5) |
| N2 + 2∗ ⇆ 2N∗ | (6) |
| N∗ + 3H∗ ⇆ NH3 + 3∗ | (7) |
Based on the surface reaction described above, it can be inferred that the decomposition rate of C2H2 is proportional to the concentration of active points which have not been occupied by carbon atoms on the catalyst particle surface. The decomposition rate of C2H2 on unit area, rdec, can be represented by:
| rdec = Kdec(c∗ − ca) | (8) |
(ii) Diffusion of carbon atom
| Dissolution: C∗ = CCat,f + ∗ | (9) |
| Diffusion of carbon through the catalyst particles: CCat,f → CCat,r | (10) |
| Precipitation: CCat,r → Cr | (11) |
Under the steady-state, the diffusion rate of carbon atoms on unit area (denoted as rdif) is directly proportional to the concentration gradient from one side of the particles to the other on the basis of Fick's first law of diffusion. The equation is given as follows:
 | (12) |
The carbon concentration gradient from the front of the particle to the rear of the particle, dc/dl, can be approximated by (ca − cb)/d. As a consequence, the diffusion rate of carbon atoms on unit area (denoted as rdif) can be defined as follows:41,42
 | (13) |
(iii) Deposition/growth of CNTs:
| Cr → CNTs/CNFs | (14) |
It can be deduced from eqn (14) that the higher the concentration of Cr is, the more opportunities carbon atoms forming CNTs, the faster CNTs/CNFs growing on the surface of carbon fibers. The deposition rate of CNTs/CNFs can be proportional to the concentration of Cr as defined below:
| rdep = Kdepcb | (15) |
In the initial period of CVD, there is a high concentration of activate points on the surface of catalyst particles, which leads to a fast decomposition rate of C2H2, rdec. At the moment, the high concentration gradient of carbon atoms in catalyst particles also brings about a fast diffusion rate, rdif. As the deposition time grows, rdif will decrease gradually due to the reduced concentration gradient, leading to the increasing of ca and so the decreasing of rdec inferred from eqn (8), while cb will increases gradually during the deposition, it results in the increasing of rdep learned from the eqn (15). Eventually, a balance among rdec, rdif and rdec will be achieved, and CNTs/CNFs can be grown stably on the surface of carbon fibers. Therefore, the rate for stable growth of CNTs, rr, can be represented by:
| rr = rdec = rdif = rdep | (16) |
Under the equilibrium state, ca can be labeled as ca,r, cb can be also labeled as cb,r. On this basis, while the mean radius of catalyst particles increases from r0 to r1 with other conditions remaining constant, the effective diffusion length, d, will grow, and the concentration gradient of carbon atoms in catalyst particles, dc/dl = (ca,r0 − cb,r0)/d, will decrease. This causes the decrease of rdif and rdif < rdec = rdep. Based on the above discussion, it can be deduced that:
(1) If rdif < rdec, it results in a gradual increase of ca and a gradual decrease of rdec learned from the eqn (8).
(2) If rdif < rdep, it causes a gradual decrease of cb, and a gradual decrease of rdep educed from eqn (15).
(3) In the meantime, owing to the gradual increase of ca and gradual decrease of cb, the concentration gradient of carbon atoms in catalyst particles, (ca − cb)/d, will gradually increase, leading to the gradual increase of rdif. Therefore, a new balance among rdec, rdif and rdec will be achieved finally. At the moment, ca,r1 increases, cb,r1 decreases, and the growth rate of CNTs/CNFs on carbon fibers decreases. So it can be inferred that as the mean radius of catalyst particles increases, ca,r increases, cb,r decreases, the growth rate of CNTs/CNFs on the surface of carbon fiber decreases under a balance among rdec, rdif and rdec. When the particle size enlarges to the critical size, a formation of encapsulating carbon occurs on catalyst particle surface via carbon polymerization due high ca,r, which is the reason that the large catalyst particles can't be used for the synthesis of CNTs/CNFs. On the basis of the CNTs/CNFs growth model discussed above, the catalytic efficiency of metal nano-particles, R can be calculated as follows:
 | (17) |
According to eqn (17), the effect of catalyst concentration on R can be well explained. As the catalyst concentration increases, the catalyst particle size enlarges, which brings about the following two variations: (1) the decreasing of its specific surface area, (2) the decrease of the concentration of active points or the decrease of the CNTs/CNFs growth rate on unit area, which is due to the increase of ca,r on the surface of catalyst particles.
During the growth of CNTs/CNFs, the following cases may occur: (1) the stable metal carbides are formed,43,44 (2) the carbon atoms gather within catalyst particles because of the local high concentration of internal carbon atoms, and (3) the amorphous carbon and graphite crystallite are produced on the particle surface resulting from carbon polymerization induced by the local high concentration of superficial carbon atoms,45 all of which result in that the paths for carbon atoms diffusing through the catalyst particles are gradually clogged. Therefore, the diffusion coefficient of D for the catalyst particles will decrease gradually with the increase of growth time, leading to the decreasing of rdif. On the basis of the CNT/CNF growth model established above, it can be inferred that:
(1) If rdif < rdec, it results in the increasing of ca and the decreasing of rdec learned from the eqn (8).
(2) If rdif < rdep, it causes the decreasing of cb and the decreasing of rdep educed from eqn (15).
(3) In the meantime, owing to the gradual increase of ca and the gradual decrease of cb, the concentration gradient, (ca − cb)/d, will gradually increase, which leads to the increasing of rdif. Therefore, a new balance among rdec, rdif and rdec will be achieved finally, at this moment, ca,r increases, cb,r decreases, and the growth rate of CNTs/CNFs on carbon fibers decreases. When D decreases to a critical value, it will induce the formation of encapsulating carbon on catalyst particle surface via carbon polymerization due to the too high ca,r.
The reason that the catalysts undergo very slow but continuous deactivation in the process can be explained as follows: owing to the slow decrease of D with the deposition time growing, ca,r increases slowly, cb,r decreases slowly, and the growth rate of CNTs/CNFs on carbon fibers decreases gradually in a new balance among rdec, rdif and rdec, at last, the catalyst particles lose their activities because of the formation of encapsulating carbon on catalyst particle surface induced by high ca,r.
Based on our CNT/CNF growth model, the difference in catalytic activity of different catalysts can be also easily explained: different kinds of transition metals have different crystal types or lattice parameters, leading to the different ability for the decomposition of hydrocarbon, Kdec, and different total concentration of active points, c∗, so they have different rdec. The difference in diffusion coefficient, D, and particle size results in that they have different rdif. Besides, for different catalyst, the different wettability of carbon with them gives rise to the different ability for carbons to bond to CNTs/CNFs, leading to different rdep. Therefore, different catalyst will incur different CNT/CNF growth rate, causing different catalytic efficiency for CNT/CNF growth. Obviously for Fe and Ni, they have different catalytic efficiency and yield CNTs/CNFs with different morphology, as shown in Fig. 4–6. This can be used to control the yield and morphology of CNTs/CNFs grown on carbon fibers.
According to the morphology of catalyst particles shown in Fig. S1 and 2,† most of the particles are nearly spherical. There also existed some catalyst particles with a shape of water prop shapes. In order to simplify calculation, the morphology of all of catalyst particles is seen as the spherical shape. The particle surface area possessed by 1 mol catalyst, a, can be calculated using the following equation:
 | (18) |
Substituting eqn (18) into (17), R is given as follows:
 | (19) |
Based on the discussion made above, it can be learned that the concentration gradient, (ca,r − cb,r)/d, decreases with the increasing of r and increases with the decrease of D, however, the value of D is related to the CNT/CNF growth time and CVD temperature. In consequence, the concentration gradient, (ca,r − cb,r)/d, is a function of time, temperature and mean radius of catalyst particles, it can be represented by:
 | (20) |
Separation of variables:
| h(t, T, r) = g(t, T)φ(r) | (21) |
Considering that (ca,r − cb,r)/d is a decreasing function of r, φ(x) will be estimated by using the following fitting equation:
 | (22) |
Rearrangement of R (eqn (19)) gives the following:
 | (23) |
 | (24) |
 | (25) |
In the light of eqn (23) and (25), it can be learned that F(T) is a function of temperature. When the CVD temperature is fixed, F(T) is a constant.
It can be observed from Fig. 2 that there is little concentration variation as the concentration of catalyst precursor grows. When Ni is used as catalyst, the particle density of catalyst on carbon fibers is estimated from Fig. 2(a–c) to about 732 μm2, 780 μm2 and 700 μm2 for the case of 0.05, 0.10 and 0.15 mol L−1 Ni(NO3)2, respectively. So the particle density of catalyst on carbon fiber is regarded as a constant value to simplify calculation. The particle density of catalyst on carbon fibers for the case of 0.1 mol L−1 catalyst precursor solution is used to represent all cases. The total number of catalyst particles on the surface of one gram of carbon fibers, N∗, is calculated by using the relation:
 | (26) |
 | (27) |
 | (28) |
When Ni is used as catalyst, N is found to be 780 μm2 derived from Fig. 2(b), rCF is found to be 3.5 μm observed in SEM and pCF is measured to be 1.79 g cm−3. The mean diameter of Ni particles, dcat, is given as follows by rearrangement of r (eqn (28)):
| dcat = 2r = 41.84c1/3 | (29) |
It can be learned from eqn (29) that the mean diameter of metallic nano-particles is approximately proportional to c1/3, the curve of dcat versus c is shown in Fig. 3(b). The mean diameter of CNTs/CNFs synthesized at 550 °C, dCNTs, can be calculated from dcat by using the following relation:
| dCNTs = 1.134dcat = 47.445c1/3 | (30) |
As shown in Fig. 3(b), the curve of dCNTs is basically matched with the actual results.
By substituting eqn (28) into (24), R is given as follows:
 | (31) |
 | (32) |
4.2. Influence of the CVD temperature on R, Y and morphology of CNTs/CNFs
At 500 °C and 550 °C, the plots made by linear fitting of ln![[thin space (1/6-em)]](https://www.rsc.org/images/entities/char_2009.gif) R versus ln
R versus ln![[thin space (1/6-em)]](https://www.rsc.org/images/entities/char_2009.gif) r3 are shown in Fig. 8. In the case of that Ni is used as catalyst, k and F(T) can be inferred from Fig. 8a, R is given on the basis of eqn (31) as follows:
r3 are shown in Fig. 8. In the case of that Ni is used as catalyst, k and F(T) can be inferred from Fig. 8a, R is given on the basis of eqn (31) as follows:| RNi,500 = 1231.38/c0.4822 = 649.23/m0.4822 | (33) |
| RNi,550 = 1539.21/c0.3371 = 983.92/m0.3371 | (34) |
| YNi,500 = 1.7860c0.5178 = 5.3822m0.5178 | (35) |
| YNi,550 = 2.2325c0.6629 = 5.3822m0.6629 | (36) |
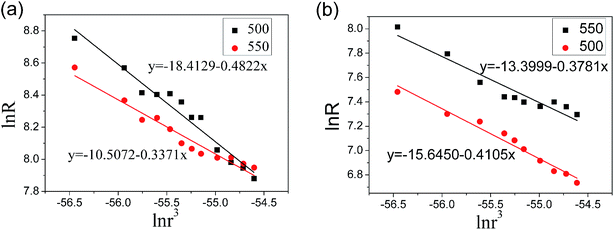 | ||
Fig. 8 Linear fitting of ln![[thin space (1/6-em)]](https://www.rsc.org/images/entities/char_2009.gif) R versus ln R versus ln![[thin space (1/6-em)]](https://www.rsc.org/images/entities/char_2009.gif) r3 with (a) Ni and (b) Fe used as catalyst at 500 °C and 550 °C. r3 with (a) Ni and (b) Fe used as catalyst at 500 °C and 550 °C. | ||
 | ||
| Fig. 9 Variation of catalytic efficiency of catalyst particles and yield of CNTs/CNFs with the concentration of catalyst precursor, (a) Fe and (b) Ni, on carbon fibers at 500 °C. | ||
Similarly, based on Fig. 8(b), R and Y for the case of Fe are given as follows:
| RFe,500 = 442.18/c0.4105 | (37) |
| YFe,500 = 0.6722c0.5895 | (38) |
| RFe,550 = 750.32/c0.3781 | (39) |
| YFe,550 = 1.1407c0.6219 | (40) |
As the deposition temperature increases to 600 °C, the catalyst particles for both Fe and Ni have a high catalytic efficiency, so the appearance of long and dense CNTs/CNFs on carbon fiber surface is observed from Fig. 10. The microstructure of final carbon products synthesized at different temperature with Ni used as catalyst was studied by a HRTEM. At 500 °C, only CNFs can be obtained, as shown in Fig. 11(a). 550 °C yields both CNTs and CNFs on carbon fibers shown in Fig. S2.† There exists structure defect in CNTs synthesized for this case whose tube walls are not strictly parallel to the axis, as shown in Fig. 11(b). In the case of 600 °C, it can be observed from Fig. 11(c) and d that multi-walled CNTs are mainly synthesized on this condition.
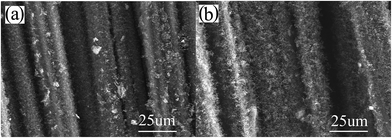 | ||
| Fig. 10 SEM images of CNTs/CNFs grown at 600 °C on carbon fibers having been impregnated with 0.05 mol L−1 catalyst precursor solution: (a) Ni and (b) Fe. | ||
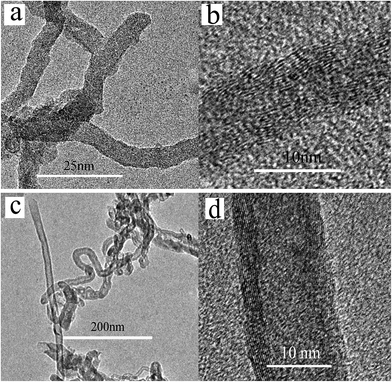 | ||
| Fig. 11 TEM images of final carbon products synthesized on carbon fibers for the case of Ni at (a) 500 °C, (b) 550 °C, (c) and (d) 600 °C. | ||
It can be seen from Fig. 12 that the variations of R and Y with the concentration of catalyst precursor differ from those obtained at 500 °C and 550 °C. For the catalyst precursor solution with a low concentration of 0.03 mol L−1, the metal nano-particles are less efficient. As the concentration of catalyst precursor increases, R increases dramatically and then reaches a maximum at a critical concentration (denoted as c0). While the concentration of catalyst precursor increases further, in agreement with the cases at 500 °C and 550 °C, R declines significantly. This phenomenon may be caused by intensive diffusion of catalyst atoms into carbon fibers at a high temperature of 600 °C or higher, which leads to that the smaller catalyst particles formed on the surface of carbon fiber due to the lower concentration of catalyst precursor will easily diffuse into carbon fibers and become less active or even deactivated,46,47 therefore, the amount of catalyst that remains active for the synthesis of CNTs on carbon fibers decreases with the reduction of the concentration, it leads to the low R for the case of low catalyst precursor concentration. When the concentration of catalyst precursor is c0 or higher, the large catalyst particles are formed, which results in that the effect of diffusion of catalyst particles into fibers on their activity is very low, the variations of R with c match well with the conclusion of CNT/CNF growth model. R and Y of both Fe and Ni at 600 °C can be deduced on the basis of eqn (3), (31) and (32), the corresponding results are shown in Table 1. It can be seen from Fig. 12 that the curves of Rcat,T and Ycat,T are consistent with the experimental results.
 | ||
| Fig. 12 Dependence of catalytic efficiency of catalyst particles and yield of CNTs/CNFs on the concentration of catalyst precursor at 600 °C: (a) Ni and (b) Fe. | ||
| Catalyst type | c0 (mol L−1) | Rcat,T = m/ca | Ycat,T = nc1−a | ||
|---|---|---|---|---|---|
| m | a | n | 1 − a | ||
| Ni | 0.06 | 1267.85 | 0.3396 | 1.8389 | 0.6604 |
| Fe | 0.09 | 2636.59 | 0.3430 | 4.0083 | 0.6570 |
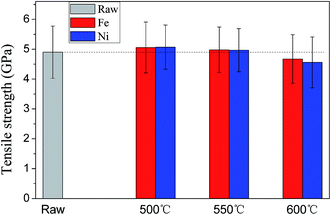
Similarly, Cartwright et al.48 observed the degradation of tetrahedral-amorphous carbon induced by metal nano-particles at temperatures greater 550 °C. High temperatures (∼550 °C or higher) also induce a mechano-chemical degradation of carbon fiber exacerbated with the increased temperature.31 To further assess the influence of temperature on diffusion of catalyst particles, the single-fiber tensile test was performed to measure the tensile strength of CNT/CNF-grafted carbon fibers produced at different temperature for both cases of 0.05 mol L−1 Fe(NO3)3 and 0.05 mol L−1 Ni(NO3)2. Kim et al.35 suggested that in addition to the repair to the catalyst-induced damage, an increase in the carbon crystal size and the formation of crosslinks of neighboring crystals by CNTs also occur during the CVD process, all of which are conducive to the improvement of mechanical properties of CNT-grafted carbon fibers. Similarly, our experimental results also show an increase in tensile strength of CNT/CNF-grafted carbon fibers produced at 500 °C and 550 °C. However, as the deposition temperatures is increased to 600 °C, the tensile strength of CNT-grafted carbon fibers decrease significantly, further confirming intensive diffusion of catalyst atoms into carbon fibers to damage the carbon fiber surface at 600 °C (Fig. 13).
Therefore, in order to fabricate the CNT/CNF-grafted carbon fibers with higher mechanical properties, it is critical to perform the CVD process at a low temperature to reduce the catalyst-induced degradation of carbon fibers. This work has paved the way towards feasible fabrication methods for CNT/CNF-grafted carbon fibers with high mechanical properties.
5. Conclusion
By modifying carbon fibers via EAO and then immersing them into catalyst precursor solution for 10 min, a good and uniform catalyst coating on the surface of carbon fibers was easily obtained on a large scale, so the homogeneous growth of CNTs/CNFs on the surface of carbon fibers was achieved.Based on the systematical study on the influence of the CVD process parameters including catalyst type, concentration, CVD temperature on the growth of CNTs/CNFs, it is found that as the concentration of catalyst precursor increases, the catalytic efficiency of catalyst particles decreases apparently, whereas CNT/CNF yield increases nonlinearly regardless of the catalyst type employed when the CVD process was performed at low temperatures. However, in the case of a higher CVD temperature of 600 °C, a critical concentration exists for the maximum catalytic efficiency, which is due to the fact that the intensive diffusion of carbon atoms into carbon fibers makes small catalyst particles less active or even deactivated. This leads to the pronounced reduction in the tensile strength of CNT/CNF-grafted carbon fibers for case of 600 °C. While there is no any deterioration of tensile strength occurring for CNT/CNF-grafted carbon fibers fabricated at 500 °C and 550 °C. Therefore, it is critical to perform the CVD process at low temperatures for the fabrication of CNT/CNF-grafted carbon fibers with high mechanical properties.
The CNT/CNF growth process has been interpreted by a mathematical model, which successfully explains the experimental results and can be used to accurately control the morphology and yield of CNTs/CNFs grown on the surface of carbon fibers. These findings have important practical meaning for the large scale fabrication of CNT/CNF-grafted carbon fibers.
Acknowledgements
The authors thank the editor and the anonymous reviewers for their valuable comments on this manuscript. This work was supported by National Basic Research Program of China (2011CB605605, 2011CB605601), National Natural Science Foundation of China (51573087), and the Natural Science Foundation in Shandong Province (ZR2014EZ001, ZR2011EMM002).References
- R. J. Sager, P. J. Klein, D. C. Lagoudas, Q. Zhang, J. Liu, L. Dai and J. W. Baur, Compos. Sci. Technol., 2009, 69(7–8), 898–904 CrossRef CAS PubMed.
- R. B. Mathur, S. Chatterjee and B. P. Singh, Compos. Sci. Technol., 2008, 68(7–8), 1608–1615 CrossRef CAS PubMed.
- H. Kim, Composites, Part B, 2014, 60, 284–291 CrossRef CAS PubMed.
- Y. X. Kong, T. T. Qiu and J. Qiu, Appl. Surf. Sci., 2013, 265, 352–357 CrossRef CAS PubMed.
- E. T. Thostenson, W. Z. Li, D. Z. Wang, Z. F. Ren and T. W. Chou, J. Appl. Phys., 2002, 91(9), 6034–6037 CrossRef CAS PubMed.
- Z. G. Zhao, L. J. Ci, H. M. Chen and J. B. Bai, Carbon, 2005, 43(3), 663–665 CrossRef CAS PubMed.
- N. Sonoyama, M. Ohshita, A. Nijubu, H. Nishikawa, H. Yanase, J. Hayashi and T. Chiba, Carbon, 2006, 44(9), 1754–1761 CrossRef CAS PubMed.
- S. Zhu, C. H. Su, S. L. Lehoczky, I. Muntele and D. Ila, Diamond Relat. Mater., 2003, 12, 1825–1828 CrossRef CAS.
- H. Qian, A. Bismarck, E. S. Greenhalgh, G. Kalinka and M. S. P. Shaffer, Chem. Mater., 2008, 20(5), 1862–1869 CrossRef CAS.
- S. P. Sharma and S. C. Lakkad, Surf. Coat. Technol., 2010, 205(2), 350–355 CrossRef CAS PubMed.
- P. Lv, Y. Y. Feng, P. Zhang, H. M. Chen, N. Q. Zhao and W. Feng, Carbon, 2011, 49(14), 4665–4673 CrossRef CAS PubMed.
- S. P. Sharma and S. C. Lakkad, Composites, Part A, 2011, 42(1), 8–15 CrossRef PubMed.
- X. S. Du, H. Y. Liu, F. Xu, Y. Zeng and Y. W. Mai, Compos. Sci. Technol., 2014, 101, 159–166 CrossRef CAS PubMed.
- P. Agnihotri, S. Busu and K. K. Kar, Carbon, 2011, 49(9), 3098–3106 CrossRef CAS PubMed.
- Q. H. Zhang, J. W. Liu, R. Sager, L. M. Dai and J. Baur, Compos. Sci. Technol., 2009, 69(5), 594–601 CrossRef CAS PubMed.
- S. P. Sharma and S. C. Lakkad, Surf. Coat. Technol., 2009, 203(10–11), 1329–1335 CrossRef CAS PubMed.
- J. Zhao, L. Liu, Q. Guo, J. Shi, G. Zhai, J. Song and Z. Liu, Carbon, 2008, 46(2), 380–383 CrossRef CAS PubMed.
- N. de Greef, L. Zhang, A. Magrez, L. Forró, J. P. Locquet, I. Verpoes and J. W. Seo, Diamond Relat. Mater., 2015, 51, 39–48 CrossRef CAS PubMed.
- Z. H. Hu, S. M. Dong, J. B. Hu, Z. Wang, B. Lu, J. S. Yang, Q. G. Li, B. Wu, L. Gao and X. Y. Zhang, New Carbon Materials, 2012, 27(5), 352–360 CrossRef CAS.
- K. J. Kim, W. R. Yu, J. H. Youk and J. Lee, ACS Appl. Mater. Interfaces, 2012, 4(4), 2250–2258 CAS.
- A. Y. Boroujeni, M. Tehrani, A. J. Nelson and M. Al-Haik, Composites, Part B, 2014, 66, 475–483 CrossRef CAS PubMed.
- N. K. Dey, E. M. Hong, K. H. Choi, Y. D. Kim, J. H. Lim, K. H. Lee and D. C. Lim, Procedia Eng., 2012, 36, 556–561 CrossRef CAS PubMed.
- M. F. de Riccardis, D. Carbone, T. D. Makris, R. Giorgi, N. Lisi and E. Salernitano, Carbon, 2006, 44(4), 671–674 CrossRef CAS PubMed.
- Q. Song, K. Z. Li, L. L. Zhang, L. H. Qi, H. J. Li, Q. J. Fu and H. L. Deng, Mater. Sci. Eng., A, 2013, 560, 831–836 CrossRef CAS PubMed.
- K. H. Hung, W. S. Kuo, T. H. Ko, S. S. Tzeng and C. F. Yan, Composites, Part A, 2009, 40(8), 1299–1304 CrossRef PubMed.
- S. Rahmanian, A. R. Suraya, R. Zahari and E. S. Zainudin, Appl. Surf. Sci., 2013, 271, 424–428 CrossRef CAS PubMed.
- J. Liu, Y. L. Tian, Y. J. Chen and J. Y. Liang, Appl. Surf. Sci., 2010, 256, 6199–6204 CrossRef CAS PubMed.
- S. K. Ryu, B. J. Park and S. J. Park, J. Colloid Interface Sci., 1999, 215(1), 167–169 CrossRef CAS PubMed.
- N. de Greef, A. Magrez, E. Couteau, J. P. Locquet, L. Forró and J. W. Seo, Phys. Status Solidi B, 2012, 249(12), 2420–2423 CrossRef CAS PubMed.
- S. A. Steiner, R. Li and B. L. Wardle, ACS Appl. Mater. Interfaces, 2013, 5(11), 4892–4903 CAS.
- J. Qiu, C. Zhang, B. Wang and R. Liang, Nanotechnology, 2007, 18(27), 275708 CrossRef.
- B. Linsay, L. Abelm and J. F. Watts, Carbon, 2007, 45(12), 2433–2444 CrossRef PubMed.
- Z. R. Yue, W. Jiang, L. Wang, S. D. Gardner and C. U. Pittman, Carbon, 1999, 37(11), 1785–1796 CrossRef CAS.
- T. Inoue and I. Gunjishima, Carbon, 2007, 45(11), 2164–2170 CrossRef CAS PubMed.
- K. J. Kim, J. Kim, W. R. Yu, J. H. Youk and J. Lee, Carbon, 2013, 54, 258–267 CrossRef CAS PubMed.
- P. M. Ajayan, Nature, 2004, 427(6973), 402 CrossRef CAS PubMed.
- O. A. Nerushev, S. Dittmar, R. E. Morjan, F. Rohmund and E. E. B. Campbell, J. Appl. Phys., 2003, 93(7), 4185 CrossRef CAS PubMed.
- R. T. K. Baker, P. S. Harris, R. B. Thomas and R. J. Waite, J. Catal., 1973, 30(1), 86–95 CrossRef CAS.
- P. Chitrapu, C. R. F. Lund and J. A. Tsamopoulos, Carbon, 1992, 30(2), 285–293 CrossRef CAS.
- K. P. de Jong and J. W. Geus, Catal. Rev., 2000, 42(4), 481–510 CAS.
- Z. Yu, D. Chen, B. Tøtdal and A. Holmen, Catal. Today, 2005, 100(3–4), 261–267 CrossRef CAS PubMed.
- D. Chen, K. O. Christensen, E. Christensen, Z. Yu, B. Tøtdal, N. Latorre, A. Monzon and A. Holmen, J. Catal., 2005, 229(1), 82–96 CrossRef CAS PubMed.
- H. Nakano, S. Kawakami, T. Kawakami and J. Nakamura, Surf. Sci., 2000, 454, 295–299 CrossRef.
- F. C. Schouten, O. L. J. Gijzeman and G. A. Bootsma, Surf. Sci., 1979, 87(1), 1–12 CrossRef CAS.
- J. Xu and M. Saeys, J. Catal., 2006, 242(1), 217–226 CrossRef CAS PubMed.
- C. Hebert, S. Ruffinatto, D. Eon, M. Mermoux, E. Gheeraert, F. Omnes and P. Mailley, Carbon, 2013, 52, 408–417 CrossRef CAS PubMed.
- M. Delmas, M. Pinault, S. Patel, D. Porterat and C. Reynaud, Nanotechnology, 2012, 23(10), 105604 CrossRef CAS PubMed.
- R. Cartwright, S. Esconjauregui, D. Hardeman, S. Hardeman, R. Weatherup, Y. Guo, L. D'Arsié, B. Bayer, P. Kidambi, S. Hofmann, E. Wright, J. Clarke, D. Oakes, C. Cepek and J. Robertson, Carbon, 2015, 81, 639–649 CrossRef CAS PubMed.
Footnote |
| † Electronic supplementary information (ESI) available. See DOI: 10.1039/c5ra15556h |
| This journal is © The Royal Society of Chemistry 2015 |

