Interactions of graphene oxide with luminescent biofunctionalized semiconductor nanoparticles: simultaneous monitoring in a protein–semiconductor coupled system†
Somashree Kundu,
Susmita Maiti,
Debasmita Ghosh,
Somrita Mondal,
Chandra N. Roy and
Abhijit Saha*
UGC-DAE Consortium for Scientific Research, Kolkata, India. E-mail: abhijit@alpha.iuc.res.in; Fax: +91-33-23357008; Tel: +91-33-23351866
First published on 14th October 2015
Abstract
We have demonstrated the physicochemical aspects of the interactions of free graphene oxide (GO) with bovine serum albumin (BSA) encapsulated ZnSe NPs as a representative protein–semiconductor coupled system. The well-resolved emissions of tryptophan and ZnSe NPs in the chosen biofunctional nanomaterial enables to follow interactions of GO with protein and semiconductor components simultaneously. The long average emission lifetime of semiconductor nanoparticles in BSA–ZnSe NPs changed significantly on interactions with GO from 131.5 to 108.6 ns, while there was little change from 5.24–5.08 ns for protein component. Influence of solvent polarity on steady-state emissions provide evidence of non-electrostatic interactions of BSA and charge transfer from ZnSe NPs towards GO sheet. Circular dichroism spectral measurements suggest change in protein secondary structure and iodide quenching studies provide a quantitative estimate of decrease in accessibility of tryptophan residues (fa) towards polar environment (fa changes from 42% to 17%) on interactions of GO with BSA–ZnSe NPs. These results are consistent with the observed changes in UV-vis absorption and zeta potential, which also indicate hydrophobic association of GO with BSA–ZnSe NPs. Further, electron transfer process is evident from Raman peak shift and the observed changes in ID/IG ratio, which indicate strong interactive nature of BSA–ZnSe NPs towards GO. We also justified the thermodynamic feasibility of electron transfer process and calculated the rate of electron transfer from semiconductor component in BSA–ZnSe NPs to the GO surface to be 2.06 × 10⁹ s−1. Thus, the present study provides useful information for future fabrication of multifunctional single platform combining the graphene, semiconductor and protein molecules.
Introduction
Graphene, a 2-dimensional single atom thick layer of carbon, appears as an important material due to its outstanding physicochemical properties.1–4 However, chemical inertness and difficulties in large scale production of graphene in defect-free state limits its essential real life applications. Graphene oxide (GO), the oxygenated counter part of graphene not only compensates the drawbacks of graphene but also introduces new properties.5,6 An important characteristic of GO over graphene is its ability to form easy aqueous dispersion. Excellent aqueous processability broadens the usage of graphene oxide in various bio-applications, such as biosensor, cellular imaging, drug delivery and so on.7–9 Large surface area, surface functionalizability, fluorescence quenching ability and bio-stability of GO having aqueous solubility and reactive oxygenic groups (hydroxyl, carbonyl and carboxylic groups and epoxide groups) help form conjugate system with nanoparticles and bio molecules in the carbon network.In recent years, many reports have shown significant advantages of graphene-based materials in biological applications such as light-induced therapeutics10 tissue and genetic engineering,11 and drug delivery.12 On the other hand, semiconductor nanoparticles are well known for its enormous potential in the fields of light-emitting devices,13 solar cells,14 biosensors,15–17 imaging,18,19 drug delivery, etc. Thus, rational combination of these two kinds of nanomaterials may generate synergy effects to make pronounced impacts in biological applications.20 Current research developments have shown a promising outlook for the application of graphene/nanoparticle hybrids in real-life diagnostics and therapeutics. Thus, it is an obvious challenge to incorporate nanoparticles with these 2-D carbon nanostructures to facilitate various biological applications. Moreover, use of biomolecule as capping agent not only affords stabilization to nanoparticles but also gives biocompatibility for further biological interactions and coupling. Therefore, combination of the beneficial characteristics of GO and biomolecule encapsulated nanoparticles can lead to the birth of many fascinating applications. However, prior to the preparation of graphene based composite material of biomolecule capped nanoparticle systems for its real applications, the possible outcome from the interactions of individual components should be assessed in case they get released from the conjugated system in the environment in which the composite may be attempted to employ. Thus, the interaction of bio-conjugated nanoparticles to the graphene materials will have a great relevance to the field of nano-bio interfacing. However, little attention has been paid to investigate the interactions of GO with nanoparticles. The excited state interactions between ZnO nanoparticles and colloidal CdSe QDs with graphene oxide molecule have been demonstrated by Williams and Kamat.21,22 Recently, the interactions between protein molecules and graphene oxide have been described several workers.23–25 This has spurred the interest to look into the physico-chemical aspect on interactions of GO with the combined system of protein and nanoparticles. In the present study, we have endeavoured to explore the type of interactions between free GO molecule with protein/nanoparticle coupled system using model BSA–ZnSe nanoparticles (NPs) in which the graphene oxide molecule not only interacts with semiconductor nanoparticles but also with the host protein molecule. We have chosen this system because of non-toxic nature of water soluble luminescent ZnSe NPs, which has made a great promise for various biological and medical applications. Further, interestingly, emission from BSA and ZnSe is well resolved having maxima at 350 nm and 450 nm, respectively with a single excitation of 295 nm. On the other hand, emission of ZnSe can be exclusively monitored with excitation at 350 nm. To the best of our knowledge, this is the first report where we have followed the interactions of GO with respective components of nanocomposite materials, protein and semiconductor NPs simultaneously.
We have monitored the interactions of both protein and semiconductor components in BSA–ZnSe NPs with GO through absorption, both steady-state and time-resolved emission and Raman spectroscopic measurements. To understand the association of BSA molecule with GO, zeta potential measurement has been performed. Circular dichroism (CD) spectroscopy has been done in order to gain insight on the conformational changes of BSA molecule due to interaction with graphene oxide. The photochemical aspects of 2-D carbon nanostructured graphene oxide (GO) sheets and its effect in BSA–ZnSe can be better understood from this study and may open up an exciting new array of ideas and applications.
Experimental
Materials
Graphite flakes (natural, 325 mesh, 99.8%) was obtained from Alfa Aesar, USA. Sodium nitrate (NaNO3), potassium permanganate (KMnO4), hydrogen peroxide (H2O2) and sulfuric acid (H2SO4) were obtained from Merck, India. For synthesis of ZnSe nanoparticle, zinc acetate dihydrate and sodium borohydride were also purchased from Merck, India. Se powder and Bovine Serum Albumin (BSA) were purchased from Sigma Aldrich, USA. Millipore water was used as solvent.Synthesis of BSA capped ZnSe
The synthesis of BSA encapsulated ZnSe QDs was carried out by a simple aqueous route using NaHSe as the selenide source. The selenide precursor was prepared by the reduction of selenium powder. Black selenium powder (78.9 mg) was suspended in 1 mL water and sodium borohydride was then added to it and subsequently, the mixture was heated under nitrogen atmosphere. After 10–15 min, the solution became colorless. The resulting clear aqueous solution of NaHSe was then used as selenide precursor. In brief, 1 mL of Zn(OAC)2 solution was added to 4 mL of BSA solution (3 mg mL−1) and then allowed to stand for some time to ensure the formation of Zn2+–BSA complex. Then, 1 mL of freshly prepared 1 × 10⁻² M NaHSe solution was added to it under continuous flow of nitrogen gas, keeping the final concentration ratio of Zn![[thin space (1/6-em)]](https://www.rsc.org/images/entities/char_2009.gif) :
:![[thin space (1/6-em)]](https://www.rsc.org/images/entities/char_2009.gif) Se as 2
Se as 2![[thin space (1/6-em)]](https://www.rsc.org/images/entities/char_2009.gif) :
:![[thin space (1/6-em)]](https://www.rsc.org/images/entities/char_2009.gif) 1. The resulting solution contained BSA encapsulated ZnSe nanoparticles which were characterized by absorption and emission spectroscopy, transmission electron microscopy (TEM), etc. (see ESI†).
1. The resulting solution contained BSA encapsulated ZnSe nanoparticles which were characterized by absorption and emission spectroscopy, transmission electron microscopy (TEM), etc. (see ESI†).
Synthesis of graphene oxide
Graphene oxide was synthesized by the oxidative treatment of natural graphite using Hummer's method.26 In brief, graphite flakes (0.5 g), sodium nitrate (0.25 g), and sulphuric acid (12 mL) were mixed in a ice bath with vigorous stirring keeping the temperature 0–5 °C. 1.5 g potassium permanganate was slowly added to the mixture maintaining the temperature below 20 °C. The ice bath was then removed and the temperature rose to 35 ± 5 °C. The mixture was kept for one hour at this temperature with continuous stirring and it appeared as a thick paste. About 25 mL of Millipore water was added to it and left for 15 minutes. The temperature rose to 90 ± 5 °C during addition of water. The solution was further diluted with 100 mL of Millipore water. 30% H2O2 solution was subsequently added to it until the evolution of effervescence ceased and the colour became bright yellow. The solution was then filtered in warm condition. The resulting graphitic oxide residue was re-dispersed in 150 mL Millipore water and centrifuged several times and washed with copious amount of water and then dried in vacuum to get in solid form. X-ray diffraction (XRD) profile and TEM image of the synthesized graphene oxide are presented in ESI.†Methods
The absorption spectra were recorded with Shimadzu (UV-VIS-NIR Lamda 950) spectrophotometer using quartz cuvette of 10 mm path length. Photoluminescence (PL) measurements were performed using a Perkin Elmer (LS 55) Luminescence spectrometer at room temperature.Fluorescence lifetimes of ZnSe QDs both in the absence and presence of GO were measured using a time-correlated single-photon-counting (TCSPC) spectrophotometer (Horiba Jobin Yovon) using nanosecond diode LED of 300 and 370 nm (IBH, nanoLED-03). For ZnSe QDs, excitation was done at 370 nm and the decay kinetics was monitored at 450 nm, while excitation and emission were taken at 300 and 350 nm, respectively for excited-state life time of tryptophan in BSA. The data stored in a multichannel analyzer were routinely transferred to IBH DAS-6 decay analysis software. The fluorescence decay curves were analyzed by a multi-exponential fitting program provided by IBH considering reduced chi-square value.
The changes in the conformation of BSA due to addition of GO were determined by circular dichroism (CD) spectroscopy using a Jasco-810 spectropolarimeter fitted with a xenon lamp and calibrated with (+)-D-10-camphorsulfonic acid. The light path length of the cell used was 5 mm in the near-UV region.
Raman spectra of GO and GO–ZnSe conjugate system were taken by Horiba Jobin Yovon (LabRam-HR) Spectrometer using He–Ne laser of 632.8 nm. A film of GO and GO–ZnSe mixture was prepared on a glass slide and dried under vacuum prior to record the Raman spectra.
Zeta potential values were determined by dynamic light scattering spectrophotometer (Model DLS – nano ZS, Zetasizer, Nanoseries, Malvern Instruments). Samples were filtered several times through a 0.22 mm Millipore membrane filter prior to recording measurements. The zeta potential was calculated from the electrophoretic mobility using the Smoluchowski equation with the help of commercial software. The results are expressed as mean values of three samples. Zeta potential measurements were performed at 25 °C.
Results and discussion
Absorption spectroscopic analysis
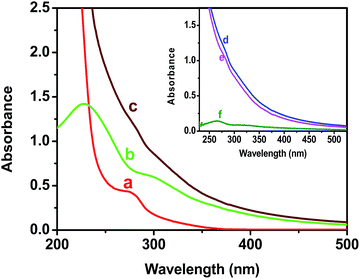
The absorbance spectra of colloidal BSA–ZnSe solution, pure GO dispersion and dispersion of their mixture have been presented in Fig. 1. The absorption intensity of the physically mixed system increases in comparison to the spectra obtained by the addition of spectrum of ZnSe nanoparticle solution and that of GO (in both case concentration of GO and ZnSe were same). It has also been shown that the absorption intensity has shifted and increased near 270 nm (Fig. 1, inset) in the spectra of composite mixture of BSA–ZnSe and GO. Since, absorption around 280 nm is primarily due to absorption by aromatic amino acid residues, it may be assumed that this change is probably due to the interactions between polyaromatic system of GO and BSA of ZnSe–BSA.27–29 In addition, this increase in absorption can also result from reduction of GO by ZnSe–BSA through electron transfer process.30Steady-state photoluminescence spectroscopy
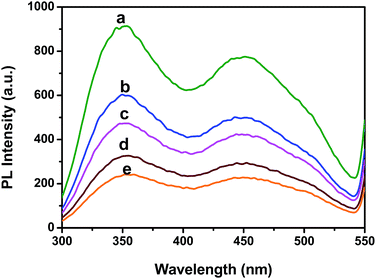
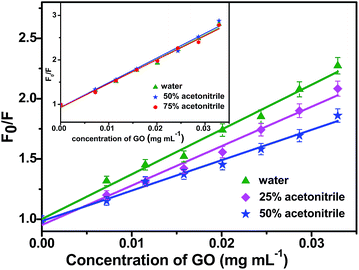
Fig. 2 illustrates changes in the fluorescence spectra of BSA–ZnSe nanoparticles with varying amounts of graphene oxide added to the aqueous solution. From Fig. 2, we can observe significant GO-induced quenching of fluorescence intensity at both 350 nm (emission from tryptophan and/or tyrosine group of BSA molecule) and 450 nm (emission from ZnSe nanoparticle) when BSA–ZnSe NPs were excited at 280 nm. Quenching of emission at 450 nm from ZnSe NPs was also observed when excited at 350 nm. It might be noted that the fluorescence signal from GO was very low and thus had no significant affect on the fluorescence feature of the BSA–ZnSe system under our experimental conditions. In order to investigate further the mechanism of quenching, similar experiment was carried out by varying solvent polarity (changing the ratio of water to acetonitrile). The Stern–Volmer plots (using eqn (1)) for interactions of GO with BSA–ZnSe NPs with varying solvent polarity for emission at 350 nm with an excitation of 280 nm (for protein component) and for emission at 450 nm with excitation of 350 nm (semiconductor ZnSe NPs) have been illustrated in Fig. 3.
 | (1) |
The Ksv values for interactions of GO with protein component, namely, BSA and with semiconductor, namely, ZnSe NPs as a function of solvent polarity are shown in Table 1. It is observed that Ksv values with regard to emission of tryptophan residues in BSA do not change with solvent polarity for a change in dielectric constant (ε) from 80.1 to 48.5. In contrast, significant change in Ksv values has been observed in case of ZnSe nanoparticles when we move from ε = 80.1 to ε = 58.8. These results suggest that two types of quenching processes can occur in the protein–semiconductor combined system. Since, emission of BSA component in the presence of GO is not affected with change in polarity of solvent, it can be inferred that interaction between GO and tryptophan in BSA is non-electrostatic, which may include hydrophobic, covalent and/or π–π stacking interactions. On the other hand, dependence of GO-induced quenching of ZnSe on solvent polarity suggests that interactions at excited state of semiconductor particles with graphene oxide involve interfacial charge transfer process.31–33 Further, we observed that Ksv value determined for GO-induced quenching of semiconductor component at 450 nm in ZnSe–BSA NPs was significantly lower when excited at 350 nm (Ksv = 37.12) in comparison with that under excitation of 280 nm (Ksv = 46.65). This could be presumably due to the fact that emission of tryptophan overlaps with excitation of ZnSe NPs encapsulated with BSA and considerable quenching of emission of tryptophan in BSA–ZnSe simultaneously on interactions with GO.
| Quenching of emission of ZnSe NPs by GO | Quenching of tryptophan emission by GO | ||
|---|---|---|---|
| Solvent (dielectric constant, ε) | Ksv value | Solvent (dielectric constant, ε) | Ksv value |
| H2O (80.1) | 37.12 | H2O (80.1) | 54.28 |
| 25% acetonitrile (71.5) | 32.69 | 50% acetonitrile (58.8) | 55.34 |
| 50% acetonitrile (58.8) | 25.21 | 75% acetonitrile (48.2) | 53.69 |
Time resolved luminescence spectroscopy
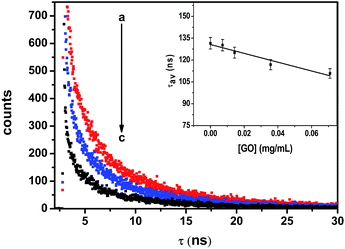
Fig. 4 shows the emission decay profiles of ZnSe NPs in the absence and in the presence of various concentrations of GO. The multiexponential decay of ZnSe nanoparticle was analyzed employing eqn (2).| f(t) = A1e−t/τ1 + A2e−t/τ2 + A3e−t/τ3 | (2) |
The average lifetime of ZnSe nanoparticles as a function of GO concentration has been shown in inset of Fig. 4. The lifetimes (τ1, τ2 and τ3), relative amplitudes (A1, A2 and A3), and average lifetime of ZnSe NPs emission (τav) at different concentrations of GO are summarized in Table 2. The average lifetime obtained from eqn (3) gives us information about the quenching behavior GO upon ZnSe nanoparticles.
 | (3) |
| Conc. of GO (mg mL−1) | τ1 (ns) | τ2 (ns) | τ3 (ns) | A1 | A2 | A3 | τav (ns) | χ2 |
|---|---|---|---|---|---|---|---|---|
| 0.00 | 32.43 | 143.3 | 2.11 | 31.44 | 60.99 | 7.57 | 131.50 | 1.16 |
| 0.01 | 26.70 | 134.1 | 1.35 | 28.65 | 62.77 | 8.58 | 125.06 | 1.19 |
| 0.04 | 21.22 | 124.4 | 0.81 | 25.67 | 64.38 | 9.95 | 116.80 | 1.14 |
| 0.10 | 16.80 | 113.8 | 0.39 | 21.12 | 56.44 | 22.44 | 108.58 | 1.00 |
With increasing concentration of GO, the first decay component (τ1) shows a decrease from 32.43 to 16.80 ns over the range of GO concentrations of 0–0.11 mg mL−1. In the absence of GO, the fast component of the emission decay (τ2) has a lifetime of 2.11 ns whereas the slowest component (τ3) has a lifetime of 143.33 ns.
Both of these lifetimes decrease with increasing concentrations of GO. The average lifetime of ZnSe emission follow same trend and decreases from 131.50 to 108.58 ns for a given GO concentration of 0.11 mg mL−1. Such long luminescence decay time (τav = 131.50 ns) can make ZnSe–BSA NPs a promising candidate for use as a luminescent biological probe. Thus, the present observed results with regard to emission of semiconductor particles in the absence and in the presence of GO may have ramifications in the area of sensor development. Consistent with PL quenching results, increasing concentrations of GO successively decrease the PL lifetime of ZnSe QDs. The decrease in the slowest component is relatively small whereas for the fast component decreases in greater extent (about 80%). As GO concentration increase, the number of free ZnSe NPs diminishes, resulting in a smaller pre-exponential contribution (A1) from the first decay component (τ1). These results confirm the strong interactive nature of GO towards ZnSe NPs.22 The increased contribution from the fast decay component is attributed to quenching of luminescence of ZnSe NPs by GO through electron transfer and suggests considerable interaction between the two. Hence, we also calculate the apparent rate of electron-transfer (Ket) from semiconductor component21 in BSA–ZnSe NPs to GO as 2.06 × 10⁹ s−1 (eqn (4)). Thus, the rate with ZnSe NPs appears to be highest in comparison with other semiconductor systems reported in literatures, such as ZnO–GO and CdSe–GO systems,21,22 which are 1.2 × 10⁹ s−1 and 6.7 × 10⁸ s−1, respectively. The high electron transfer rate of ZnSe NPs is expected to improve electron transfer process to graphene based system.
 | (4) |
From the above experimental observation, we demonstrate the electron transfer reaction pathway described as follows. In the literature, the reported energy level for valence band (EVB) and conduction band (ECB) for ZnSe found to be −5.37 and −2.63 eV, respectively, with respect to vacuum.34,35 Now the expressions for the valence and conduction band shift with respect to diameter (in Å) of the QDs used are given below (eqn (5) and (6)).36 The positions of the valence and conduction band can be determined as −5.51 and −2.24 eV, respectively, in the present investigation. The Fermi level of graphene (−4.5 eV) may be assumed to be similar to that of graphene oxide with respect to vacuum.37 In GO–ZnSe the band alignment is such that the Fermi level of graphene oxide is much lower as compared to the conduction band of ZnSe. As a result, electron transfer reaction from the conduction band of ZnSe to graphene is thermodynamically feasible, which we have confirmed by time-resolved photoluminescence.
 | (5) |
 | (6) |
We further investigated time resolved fluorescence of tryptophan residues in order to get detailed information about the conformation change in the BSA molecule. The decay data can reflect the interactions of these residues with quencher GO. The data were fitted in a bi-exponential function following eqn (7).
| f(t) = A1e−t/τ1 + A2e−t/τ2 | (7) |
The average lifetime of tryptophan in BSA–ZnSe was found to be 5.24 ns which is close to that observed in the presence of GO of concentration of 0.07 mg mL−1. This is in contrast to what was observed with regard to ZnSe–GO interactions as described earlier. The observed results suggest that GO-induced quenching of protein component is static in nature. However, we observed a significant decrease (about 25%) in the shorter lifetime component (τ1) on GO-induced interactions with BSA–ZnSe, while longer lifetime component was not much affected. As reported earlier,38 the buried tryptophan residues display a shorter lifetime (τ1) and the exposed residues show a longer lifetime (τ2). Therefore, the decrease in lifetime component, (τ1) may be attributed to the hydrophobic or π–π stacking interactions of protein component in BSA–ZnSe NPs with graphene oxide. Although, average lifetime of tryptophan emission in BSA–ZnSe NPs decreased to 5.28 ns from that of free BSA molecule (6.30 ns), additions of GO did not alter the average values of the respective system significantly. The observed change in the fast lifetime component (τ1) of BSA in the presence of GO (from 5.0 to 3.8 ns, i.e. ∼25%) is also in similar extent to that of BSA–ZnSe NPs (1.9 to1.4 ns, i.e. ∼25%). The slower component (τ2) changes from 7.5 to 6.5 ns (13%) in native BSA on interacting with GO which is in greater extent in comparison to BSA–ZnSe (6.00 to 5.65 i.e., ∼6%). This may be due to lesser availability of exposed tryptophan residues in BSA–ZnSe NPs.
Circular dichroism spectroscopy
In order to investigate the GO-induced conformational changes, circular dichroism spectroscopy on free BSA in its native state vis-a-vis BSA bound with ZnSe NPs was followed both in the absence and in the presence of GO. Circular dichroism is observed when molecules absorb left and right circularly polarized light to different extents. The CD spectrum of native BSA exhibits two characteristics negative bands of α-helix structure39 at approximately 209 and 220 nm (curve a, Fig. 5) in the far-UV region (200–260 nm) and a positive band near 195 nm.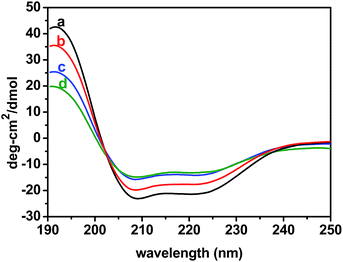 | ||
| Fig. 5 Changes in CD spectra of BSA in native state (a) and of BSA–ZnSe NPs in the absence (b) and in the presence of GO ((c), 0.14 mg mL−1 and (d), 0.27 mg mL−1). | ||
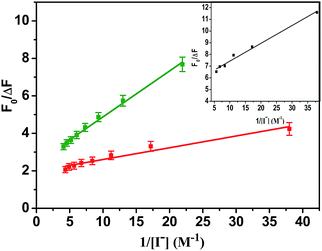 | ||
| Fig. 6 Modified Stern–Volmer plot for iodide quenching of tryptophan emission at 350 nm in BSA (red) and ZnSe–BSA (green). Inset: ZnSe–BSA/GO combined systems. Excitation was 295 nm. | ||
The CD spectra of β-sheet display a negative band near 216 nm, a positive band between 195 and 200 nm, and a negative band near 175 nm. From these results, it is assumed that the structure of precursor BSA in native form is predominately in α-helical conformation. In BSA–ZnSe system, the intensity of these negative bands has shifted towards positive direction. With increasing concentration of added GO, this trend becomes more prominent in comparison with native BSA and BSA–ZnSe system. Thus, it is tantamount to say from the observed results that GO on interaction with protein component leads to loss of α-helical conformation with concomitant unfolding of the protein structure. In addition, with the increase in concentration of GO in the BSA–ZnSe system, two negative bands appear to move together toward the region between 209 and 220 nm indicating a more β-sheet rich structure. The conformation changes imply that the BSA would adopt a more incompact conformation on the surface of GO.
Determining accessibility of tryptophan residues
In view of possible GO-induced conformational change of protein component in BSA–ZnSe NPs leading to greater exposure of tryptophan residue, accessibility of these groups were determined through iodide quenching studies. Accessibility of tryptophan groups in native precursor BSA and after formation of ZnSe NPs encapsulated by BSA has been monitored through quenching of tryptophan fluorescence at 350 nm with excitation light of 295 nm by adding iodide ions to the solution of free BSA or BSA–ZnSe NPs. It was observed that data on iodide quenching of fluorescence from tryptophan in BSA or BSA–ZnSe did not follow the linear Stern–Volmer relation (eqn (1)). However, the observed data followed the modified Stern–Volmer relation (eqn (8)) (Fig. 6).
 | (8) |
This suggests that both BSA and ZnSe–BSA NPs contain two classes of tryptophan fluorophores, such as buried (in hydrophobic environment) and exposed (in polar environment). The fractions of accessible tryptophan residues in polar media (fa) in BSA and ZnSe–BSA NPs were calculated as 0.51 and 0.42, respectively. Further, the similar iodide quenching pattern (modified Stern–Volmer) was observed when tryptophan fluorescence in the ZnSe–BSA interfaced with GO was followed. The accessible fraction was found to be 0.17 at a GO concentration of 0.02 mg mL−1. The reduction in fa values indicate that tryptophan residues get more buried on interaction with graphene oxide.24 This may be due to possible hydrophobic interactions of BSA with graphene oxide molecule, which was also evident from fluorescence lifetime measurements of BSA–ZnSe NPs.
Raman spectroscopy
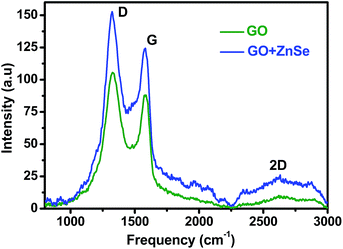
Fig. 7 shows typical Raman spectra of GO and GO–ZnSe samples. GO gives D and G bands at 1329 cm−1 and 1587 cm−1, respectively, while GO–ZnSe gives corresponding bands at 1323 cm−1 and 1581 cm−1, which are stoke shifted by 6 cm−1. Similar shifts have been also reported earlier in case of graphene–CdTe and graphene–CdSe composite systems.40,41 The Stokes shifts have been attributed to the transfer of electron from electron donor to graphene.42,43 Similarly, in the present case, the observed Stokes shift in case of GO–ZnSe may be related to the transfer of electrons from ZnSe to GO due to electron donating nature of ZnSe nanoparticles. Electron transfer has been confirmed in the present study by time-resolved measurements as discussed earlier. GO shows D and G bands at 1329 cm−1 and 1587 cm−1 with an intensity ratio (ID/IG) of 1.196, whereas ID/IG ratio increases to 1.216 for GO–ZnSe conjugate system. The red shifting of the G band and the increase in the ID/IG ratio reveal that GO is reduced partially.44 This reduction is expected to result from electron transfer from BSA–ZnSe NPs to the GO surface as reflected in the absorption and time resolved measurements.Zeta potential measurements
To understand the association of graphene oxide with BSA–ZnSe, zeta potentials of the colloidal dispersion of BSA, BSA–ZnSe NPs and GO were measured. The observed potential value of simple BSA was −28 mV and that BSA–ZnSe was about −30 mV. The almost similar values suggest that protein molecule BSA encapsulates semiconductor ZnSe nanoparticles, thus covering surface of the particles. Again, zeta potential of free GO dispersion in water at pH 7 was measured as −53 mV which is in agreement with the result reported earlier.45 However, the observed potential value of GO added BSA–ZnSe composite system was −30 mV which is almost identical to that of BSA–ZnSe or BSA. These results suggest that protein–semiconductor nanoparticles, here BSA–ZnSe, predominantly occupy the surface of GO structure.Conclusions
The present investigation demonstrates how graphene oxide interacts with a combined system of protein and semiconductor nanoparticles. Dependence of steady-state luminescence of BSA–ZnSe NPs on solvent polarity and time-resolved emission data confirm that interactions of GO with protein and semiconductor components involve non-electrostatic binding and interfacial charge transfer processes, respectively. Absorption, tryptophan accessibility, circular-dichroism (CD) and zeta potential measurements suggest that GO-induced interactions lead to changes in BSA secondary structures as a consequence of hydrophobic association with protein component. Additionally, Raman peak shift and changes in ID/IG ratio indicate strong interactive nature of ZnSe NPs towards GO. The high electron transfer rate from semiconductor component in BSA–ZnSe NPs shows great promise in developing graphene based photocatalytic system. Further, in view of potentials of graphene/protein conjugated systems in various biological applications, such as biosensing, therapeutics, the present investigation on interactions among protein, semiconductor and graphene oxide will help, in future, synthesizing multifunctional hybrid materials combing these three important components.Acknowledgements
The authors wish to thank Dr S. Baitalik and Mr S. Mati, Department of Chemistry, Jadavpur University, for time-resolved spectroscopy and to Prof. S. Basu, Chemical Sciences Division, Saha Institute of Nuclear Physics for CD measurements. The authors, S. Kundu and S. Maiti are thankful to University Grants Commission and Department of Science and Technology, Govt of India, for the award of NET Junior Research Fellowship and INSPIRE fellowship, respectively.References
- M. D. Stoller, S. Park, Z. Yanwu, J. Anand and R. S. Ruoff, Nano Lett., 2008, 8, 3498–3502 CrossRef CAS PubMed.
- S. Ghosh, W. Bao, D. L. Nika, S. Subrina, E. P. Pokatilov, C. N. Lau and A. A. Balandin, Nat. Mater., 2010, 9, 555–558 CrossRef CAS PubMed.
- Y. Zhang, Y. W. Tan, H. L. Stormer and P. Kim, Nature, 2005, 438, 201–204 CrossRef CAS PubMed.
- S. V. Morozov, K. S. Novoselov, M. I. Katsnelson, F. Schedin, D. C. Elias, J. A. Jaszczak and A. K. Geim, Phys. Rev. Lett., 2008, 100, 016602 CrossRef CAS.
- H. Yan, L. Zhu, X. Li, A. Kwok, X. Pan and Y. A. Zhao, Asian J. Org. Chem., 2012, 1, 314–318 CrossRef CAS PubMed.
- X. Pan, H. Li, K. T. Nguyen, G. Gruner and Y. Zhao, J. Phys. Chem. C, 2012, 116, 4175–4181 CAS.
- L. Feng, Y. Y. Chen, J. S. Ren and X. G. Qu, Biomaterials, 2011, 32, 2930–2937 CrossRef CAS PubMed.
- C. Peng, W. B. Hu, Y. T. Zhou, C. H. Fan and Q. Huang, Small, 2010, 6, 1686–1692 CrossRef CAS PubMed.
- X. M. Sun, Z. Liu, K. Welsher, J. T. Robinson, A. Goodwin and S. Zaric, Nano Res., 2008, 1, 203–212 CrossRef CAS PubMed.
- Z. Liu, J. T. Robinson, S. M. Tabakman, K. Yang and H. Dai, Mater. Today, 2011, 14, 316–323 CrossRef CAS.
- G. A. A. Saracino, D. Cigognini, D. Silva, A. Caprini and F. Gelain, Chem. Soc. Rev., 2013, 42, 225–262 RSC.
- S. Goenka, V. Sant and S. Sant, J. Controlled Release, 2014, 173, 75–88 CrossRef CAS PubMed.
- M. A. Haase, J. Qiu, J. M. Depuydt and H. Cheng, Appl. Phys. Lett., 1991, 59, 1272–1274 CrossRef CAS PubMed.
- H. Jeon, J. Ding, W. Patterson and A. V. Nurmikko, Appl. Phys. Lett., 1991, 59, 3619–3621 CrossRef CAS PubMed.
- A. Hagfeldt and M. Grätzel, Chem. Rev., 1995, 95, 49–68 CrossRef CAS.
- D. Ghosh, S. Ghosh and A. Saha, Anal. Chim. Acta, 2010, 675, 165–169 CrossRef CAS PubMed.
- S. Mondal, S. Ghosh, D. Ghosh and A. Saha, J. Phys. Chem. C, 2012, 116, 9774–9782 CAS.
- S. Ghosh, D. Ghosh, P. K. Bag, S. C. Bhattacharya and A. Saha, Nanoscale, 2011, 3, 1139–1148 RSC.
- A. P. Alivisatos, Science, 1996, 271, 933–937 CAS.
- K. T. Nguyena and Y. Zhao, Nanoscale, 2014, 6, 6245–6266 RSC.
- G. Williams and P. V. Kamat, Langmuir, 2009, 25, 13869–13873 CrossRef CAS PubMed.
- I. V. Lightcap and P. V. Kamat, J. Am. Chem. Soc., 2012, 134, 7109–7116 CrossRef CAS PubMed.
- K. S. Kim, Y. M. Um, J. Jang, W. S. Choe and P. J. Yoo, ACS Appl. Mater. Interfaces, 2013, 5, 3591–3598 CAS.
- Q. Shao, P. Wu, X. Xu, H. Zhang and C. Cai, Phys. Chem. Chem. Phys., 2012, 14, 9076–9085 RSC.
- Y. Zhang, C. Wu, S. Guo and J. Zhang, Nanotechnol. Rev., 2013, 2, 27–45 CAS.
- W. S. Hummers and R. E. Offeman, J. Am. Chem. Soc., 1958, 80, 1339 CrossRef CAS.
- J. Shen, M. Shi, B. Yan, H. Ma, Na. Li, Y. Hu and M. Ye, Colloids Surf., B, 2010, 81, 434–438 CrossRef CAS PubMed.
- C. Shan, H. Yang, D. Han, Q. Zhang, A. Ivaska and L. Niu, Langmuir, 2009, 25, 12030–12033 CrossRef CAS PubMed.
- W. Zhang, J. Cui, C. Tao, Y. Wu, Z. Li, L. Ma, Y. Wen and G. Li, Angew. Chem., Int. Ed., 2009, 48, 5864–5868 CrossRef CAS PubMed.
- G. Williams, B. Seger and P. V. Kamat, ACS Nano, 2008, 2, 1487 CrossRef CAS PubMed.
- P. V. Kamat and B. Patrick, J. Phys. Chem., 1992, 96, 6829–6834 CrossRef CAS.
- V. Subramanian, E. E. Wolf and P. V. Kamat, J. Phys. Chem. B, 2003, 107, 7479–7485 CrossRef CAS.
- P. V. Kamat, R. Huehn and R. A. Nicolaescu, J. Phys. Chem. B, 2002, 106, 788–794 CrossRef CAS.
- D. Bera, L. Qian, T. K. Tseng and H. P. Holloway, Materials, 2010, 3, 2260–2345 CrossRef CAS PubMed.
- J. Jasieniak, M. Califano and S. E. Watkins, ACS Nano, 2011, 5, 5888–5902 CrossRef CAS PubMed.
- S. Sapra and D. D. Sarma, Phys. Rev. B: Condens. Matter Mater. Phys., 2004, 69, 125304 CrossRef.
- I. V. Lightcap, T. H. Kosel and P. V. Kamat, Nano Lett., 2010, 10, 577–583 CrossRef CAS PubMed.
- J. R. Lakowicz, Principles of Fluorescence Spectroscopy, Springer, New York, 3rd edn, 2006 Search PubMed.
- N. Vigneshwaran, A. A. Kathe, P. V. Varadarajan, R. P. Nachane and R. H. Balasubramanya, Langmuir, 2007, 23, 7113–7117 CrossRef CAS PubMed.
- G. B. Markad, S. Battu, S. Kapoor and S. K. Haram, J. Phys. Chem. C, 2013, 117, 20944–20950 CAS.
- Y. T. Kim, J. H. Han, B. H. Hong and Y. U. Kwon, Adv. Mater., 2010, 22, 515–518 CrossRef CAS PubMed.
- R. Voggu, B. Das, C. S. Rout and C. N. R. Rao, J. Phys.: Condens. Matter, 2008, 20, 472204 CrossRef.
- B. Das, B. Choudhury, A. Gomathi, A. K. Manna, S. K. Pati and C. N. R. Rao, ChemPhysChem, 2011, 12, 937–943 CrossRef CAS PubMed.
- R. Bera, S. Kundu and A. Patra, ACS Appl. Mater. Interfaces, 2015, 7, 13251–13259 CAS.
- B. Konkena and S. Vasudevan, J. Phys. Chem. Lett., 2012, 3, 867–872 CrossRef CAS PubMed.
Footnote |
| † Electronic supplementary information (ESI) available: Absorption and emission profile of BSA–ZnSe and TEM image of ZnSe NPs; methods involved for TEM measurement and XRD patterns; XRD and TEM image of graphene oxide. See DOI: 10.1039/c5ra17191a |
| This journal is © The Royal Society of Chemistry 2015 |

